

Abstract
The Dlk1 (delta-like-1) gene is a member of the epidermal growth factor (EGF)-like homeotic gene family. It influences cell–cell interactions between stromal cells and pro-B cells in vitro. To define the in vivo role of the dlk protein in B cell development, we established a Dlk1−/− mouse model. In spleens of Dlk1−/− mice, transitional B cell numbers were increased and the ratio between transitional B cell subsets was altered. Numbers of follicular B cells decreased, while the number of marginal zone B cells and the size of the marginal zone were increased. Loss of dlk resulted in increased immunoglobulin G1 (IgG1) and IgG3 in preimmune sera. Furthermore, there was an exaggerated primary T-dependent antigen-specific humoral immune response. In bone marrow, the lack of dlk led to increased numbers of the earliest B lineage cells in young mice without affecting numbers of later B lineage cells. In vitro experiments showed that lack of dlk on either stromal cells or pro-B cells caused changes in differentiation and proliferation of pro-B cells, suggesting that lack of dlk leads to changes in cell–cell interactions in the bone marrow microenvironment. These results show that dlk expression is essential for normal B cell development.
Introduction
Antigen-independent B cell lymphopoiesis occurs in the bone marrow of adult mammals, and involves both secreted factors, such as interleukin-7 (IL-7), and cell–cell interactions. The earliest B lineage progenitors arise after commitment of common lymphoid precursors to the B lineage and undergo sequential steps of differentiation characterized by acquisition of specific cell-surface markers, immunoglobulin (Ig) gene rearrangements, and gene expression profiles [1]. Stromal cells play an important role in providing secreted growth factors and cell–cell interactions in the bone marrow microenvironment, and are functionally heterogeneous in their capacity to support B lymphopoiesis [2]. B cell differentiation in the bone marrow is regulated by multiple signals from the stroma [3]. Early progenitor cells require cell contact-mediated signals, whereas later stages require only the secreted factor IL-7 [4]. Several cellular or extracellular matrix and adhesion proteins are involved in these interactions, including Pgp-1/CD44 [5], very late antigen-4 (VLA-4)/CD49d, VLA-5/CD49e, and vascular cell adhesion molecule-1 (VCAM-1)/CD106 [6]. However, adhesion molecules are not the only molecules mediating B cell–stromal interactions; other molecules take part [7].
Cell–cell interactions in spleen also influence differentiation of B cells [8]. Transitional (Tr) B cells interact with stroma during determination of marginal zone (MZ) or follicular (FO) B cell fate, but the process is not completely understood. Targeted deletion of the Nkx2-3 gene leads to defective splenic stroma and results in splenic disorganization and absence of MZ B cells [9]. B cells interact with endothelial and/or stromal cells in spleen via lymphotoxin and thereby induce chemokines that influence lodging and retention of different cellular subsets in the MZ [10]. Kuroda et al. [11] suggest that transitional B cells may interact with dendritic cells via Notch-dependent signals that determine cell fate choice between follicular or marginal zone B cell development. Similarly, the Notch2 ligand Dll1 is expressed in the spleen, and gene inactivation studies have shown that Notch2 signaling is important for MZ B cell development [12].
The Dlk1 gene encodes the dlk protein, also known as Pref-1, Fetal Antigen-1, and other designations [13]. It belongs to the epidermal growth factor (EGF)-like repeat-containing family of proteins that are involved in cell fate decisions [14] that includes the four mammalian Notch proteins and their ligands, Delta, Serrate, Dll, and Jagged. The dlk protein can exist both as soluble and transmembrane forms, depending on splicing or proteolytic cleavage [15]. In contrast to Dll, Delta, Serrate, and Jagged, dlk lacks the DSL (Delta-Serrate-Lag2) domain that directly interacts with Notch to initiate signaling [14].
dlk is involved in several differentiation processes, including adipogenesis [16,17], neuroendocrine differentiation [18], differentiation of hepatocytes [19], and hematopoiesis [20]. Dlk1 was determined to be responsible for the hematopoietic stem cell-supporting property of fetal liver stromal cell line ATF024 [20,21]. A Hairy/Enhancer of Split (HES-1)-dependent role for Dlk1 in T cell growth has also been reported [22]. dlk was found to modulate cell colony formation triggered by several cytokines in bone marrow cells [23].
Previously, we reported that dlk expressed on stromal cells plays an important role in cell–cell interactions. Enforced down-regulation of Dlk1 by antisense RNA expression increased the supportive abilities of BALBc/3T3 and S10 stromal cells for the maintenance of undifferentiated pre-B cells in vitro [24]. These observations support a role for dlk in modulating signal transduction events triggered by different factors, as has been demonstrated in the case of insulin growth factor-1 (IGF1)/insulin [25], and suggest that Dlk1 is a pivotal factor for B lymphopoiesis in vivo.
A Dlk1 gene-targeted mouse model exhibited growth retardation, increased adiposity, and skeletal abnormalities [26]. A recent study reported that these mice display reductions in bone marrow colony forming pre-B cells in vitro and reduced IgM/B220+ B cells in the spleen of 16-week-old mice [27].
In this study, we extended analysis of changes in bone marrow and splenic B lymphopoiesis in Dlk1−/− mice. Absence of dlk expression led to increased numbers of the earliest B lineage cells (fraction A, Fr A) but decreased numbers of recirculated B lineage cells (fraction F, Fr F) in the bone marrow. We also observed changes in B cells in peripheral lymphoid organs, suggesting that dlk is also important in these stages of B cell development. Finally, we find that Dlk1−/− mice have abnormal levels of preimmune serum Ig and an exaggerated antigen-specific humoral immune response, showing that dlk influences development of normal humoral immune responses.
Materials and Methods
Derivation of Dlk1-null mice, breeding, and characterization
A targeting construct was assembled and electroporated into SvJ129 embryonic stem (ES) cells. A neomycin-resistance cassette replaced 3.8 kbp of the endogenous allele, including the promoter and first three exons of Dlk1. Chimeric animals were bred to establish Dlk1−/− mice. Genotype analysis was done by Southern blot or PCR amplification using the following primers: 5′ dlk, CCAAATTGTCTATAGTCTCCCTC; 5′ Neo, CATCTGCACGAGACTAGTG; and 3′ SCR (screen), CTGTATGAAGAGGACCAAGG (from Dlk1 intron 3). Analysis of phenotype was done after three backcrosses to C57Bl/6, and then intercrosses of heterozygotes were used to generate homozygotes, heterozygotes, and wild-type mice. For all experiments, age-matched wild-type littermates from heterozygous intercrosses were bred and used as controls.
Southern blot analysis
Southern blots of BamH1-digested genomic DNA were hybridized to a PCR-generated, 32P-labeled probe from Dlk1 exon 5. The wild-type Dlk1 allele generated a 14.5-kbp band whereas the targeted allele generated a band of 6.1 kbp.
Northern blot analysis
Northern blots of total RNA (15 μg) were hybridized to a 32P-labeled full-length Dlk1 cDNA probe. Blots were analyzed using a PhosphorImager (Molecular Dynamics, Sunnyvale, CA).
RT-PCR analysis
Total RNA from cells or tissue suspensions was reverse transcribed with oligo(dT) primers and Superscript (II) (Invitrogen) according to the manufacturer's protocol. B cells were isolated from spleen and bone marrow cell suspensions using CD19 microbeads (Miltenyi) following the manufacturer's instructions. Bone marrow adherent cells were obtained by flushing femurs and then periodically rinsing away nonadherent cells during 4 days in tissue culture. Dlk1 RT-PCR generated a 223-bp product using the following primers: 5′ mdlk 335U20, TCACCCCACCCCACCCCAGG; and 3′ mdlk 558L21, ATGAAATTCTTATTATTA. Primers for GAPDH were as follows: 5′-ATT CAA CGG CAC AAT CAA GG and 3′-TGG ATG CAG GGA TGA TGT TC. Analysis for β-actin was done as described [24].
Flow cytometry
For analysis, single-cell suspensions from bone marrow, spleen, lymph node, or thymus from 4-, 6-, 8-, or 16-week-old mice were counted then stained with biotinylated, allophycocyanin (APC)-, fluorescein isothiocyanate (FITC)-, phycoerythrin (PE)-, or PerCP-conjugated monoclonal antibodies to B220 (RA3-6B2), BP-1 (6C3), CD43 (S7), HSA (M1/69), IgM (R6-60.2), CD21 (7G6), CD23 (B3P4), AA4.1 (493), and CD1d (1B1) (BD Bioscience, San Diego CA); and IgD (11/26)(Southern Biotechnology Inc, Birmingham, AL) for B lineage, or CD4-, CD8-, CD3-, CD44-, CD25-, or CD5-specific antibodies for T lineage analysis (BD/Pharmingen). Data for B lineage cells were generated using a B220 gate on the lymphocyte FSC, SSC gate. 2.4G2 monoclonal antibody (mAb; Pharmingen) was used to inhibit nonspecific Fc-mediated binding. Data were collected on a FACS Calibur and analyzed using FlowJo software (Tree Star Inc, Ashland, OR).
Bone marrow pro-B cells were isolated from femurs (4 weeks, 7 mice of each genotype) then sorted using a FACS Aria and DiVa software (BD Bioscience, San Diego CA) with a lymphocyte forward- and side-scatter gate, positive selection of B200+(APC)/CD43+(PE) cells, and collection of Fr A [BP-1 (FITC) and CD-24− (perCP)] or Fr B [BP-1 and CD-24+] cells.
In vitro growth of bone marrow B cells
Unsorted bone marrow cells from 4-week-old mice were cultured in Iscove's medium (Gibco-BRL) containing 2% fetal calf serum (FCS), 5 × 10⁻⁵M 2-mercaptoethanol, and penicillin-streptomycin, with or without conditioned medium containing 200 U/ml of mouse IL-7 for 4 days. IL-7 conditioned medium was obtained as described [24]. Each experiment used 2 × 10⁶ cells plated under the above conditions, and 3 mice of each genotype were analyzed separately. Sorted control or dlk-deficient Fr A or Fr B cells were cultured as above, with or without IL-7 on either normal stroma S10 (a gift from Kenneth Dorshkind) [28] or dlk-deficient stroma line S13. S13 was derived by culture and multiple passage of adherent cells from bone marrow of adult mDlk1−/− mice. Fr A cells were cultured for 7 days and Fr B cells for 5 days before analysis.
Immunohistochemistry
Spleens fixed in paraformaldehyde were embedded in paraffin. Sections (10–12 μm) were stained with Hematoxylin & Eosin and analyzed under a light microscope. Sections (10–12 μm) of frozen spleen embedded in OCT compound were prepared and fixed on glass slides with acetone for 5 min. Sections were then incubated with primary antibody, MAd-CAM-1 (2.5 μg/ml) (Pharmingen) for 45 min and subsequently with Alexa 488-labeled anti-rat antibodies (Molecular Probes, Eugene, OR). Finally, they were incubated with Texas Red-conjugated goat anti-mouse IgM and washed. Digital images were captured with a Princeton Instruments Micromax 1300YHS camera, under a Nikon Eclipse E800 microscope with a 20×/0.75 objective and CFI10X/22 eyepiece (Nikon, Tokyo, Japan) and analyzed using BioVision software. Spleen follicles from 3 wild type and 3 Dlk1−/− mice were analyzed on NIH Image analysis software. FO and MZ areas from 15 follicles were determined for comparison and statistical analysis.
Immunization
Wild-type and Dlk1−/− mice were immunized intraperitoneally with 100 μg/ml dinitrophenyl–keyhole limpet hemocyanin (DNP-KLH) or 50 μg/ml DNP-lipopolysaccharide (LPS) (Bio Search Tec. Inc, Novato, CA) in phosphate-buffered saline (PBS). Mice were boosted at day 21. Control mice were injected with PBS only. Mice were bled on day 7 or 28 to obtain serum for Ig analysis.
Serum Ig analysis
Ig was detected by inhibition enzyme-linked immunosorbant assay (ELISA). Buffer only or three-fold dilutions of test sera from control or dlk-deficient mice were incubated with 0.5 μg/ml of appropriate goat anti-mouse Ig subtype-specific antibodies labeled with alkaline phosphatase. This mixture was then added to plates precoated with the relevant Ig isotype. p-Nitro-phenyl phosphate disodium salt (Sigma, St. Louis, MO) substrate was used to detect the alkaline phosphatase activity. Absorbance was measured at 405 nm in a Titertek Multi Scan ELISA plate reader and presented as the titer at which a 50% signal inhibition was observed compared to buffer only. The technique does not compare levels of antibody among isotypes, but does reveal differences of isotype levels relative to each particular isotype tested.
To determine the DNP-specific response, serum was incubated on 96-well plates (Nunc, Rosklide, Denmark) coated with 10 μg/ml DNP-bovine serum albumin (BSA). Isotype specific alkaline phosphatase-labeled antibody (Southern Biotech) was added, and enzyme activity was detected using p-nitrophenyl phosphate substrate. Optical density (OD) values were plotted versus serum dilution to determine assay linearity. The titer at 1/120 dilution (linear range of assay for all samples) was used for analysis.
Statistical analysis
Significance of differences in values between samples was determined by two-tailed Student t-test.
Results
Characterization of Dlk1 gene-targeted mouse strain
The construct used to generate Dlk1−/− mice by deletion of the promoter and exons 1–3 is shown in Fig. 1A. Southern blot and PCR analysis showed the expected DNA configuration or genotypes of the mice (Fig. 1B,C). Dlk1−/− mice were viable and litter sizes were comparable to heterozygous or wild-type animals. Dlk1−/− mice displayed growth retardation (data not shown) similar to that observed by Moon et al. who generated a different Dlk1−/− strain with targeted removal of exons 2 and 3 [26].
FIG. 1.
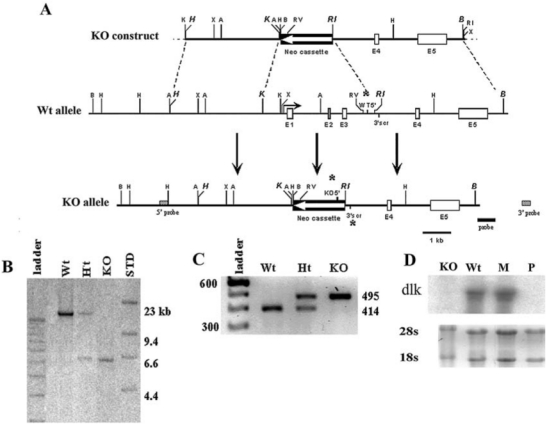
Derivation of Dlk1−/− mouse strain. (A) Dotted lines show the origin of the wild-type (Wt) germ-line fragments used to assemble the knockout (KO) construct. The scale is indicated with a bold black line 1 kbp in length. (B) Genomic analysis of Dlk1−/− mice. The knockout construct introduces a new Bam HI site, resulting in reduction of the 14.5-kbp germ-line band (Wt) to 6.5 kbp in the knockout allele (KO) and both bands in heterozygotes (Ht). (C) PCR genotyping yielded bands of 414 bp (lane Wt), 495 bp (lane KO), or both (lane Ht). (D) Dlk1 mRNA expression in neonatal liver (day 1 postpartum) was analyzed by northern blot. Liver RNA samples were isolated from wild-type (lane Wt), Dlk1−/− (lane KO), maternal heterozygote (lane M), and paternal heterozygote (lane P) mice. An exon 5-specific probe was used to identify the Dlk1 mRNA.
Because Dlk1 is an imprinted gene whose embryonic expression depends on an intact paternal allele [29], we examined RNA expression in livers of neonatal wild type, Dlk1−/−, and heterozygotes that received a single knockout allele from the male (paternal transmission) or the female (maternal transmission). As shown in Fig. 1D, 1.5-kb Dlk1 mRNA is expressed in liver of 1-day-old neonates of wild-type or maternally transmitted Dlk1+/− heterozygous mice. As expected, no Dlk1 mRNA was present in neonatal liver of the homozygous Dlk1−/− animals or in paternally transmitted Dlk1−/+ heterozygous animals.
B cell development changes in Dlk1−/− bone marrow
Because we had previously shown that dlk could affect early B lineage cells in vitro, we first examined the earliest stages of B lineage development in bone marrow of Dlk1−/− mice, pro-B cells. Three fractions of CD43, B220+ pro-B cells can be distinguished as Fr A, Fr B, and Fr C [30]. We found that the number of Fr A cells was significantly increased in Dlk1−/− mice compared to controls at 4 weeks of age (Fig. 2A). The number of Fr B cells was comparable at the three ages tested. The average number of Fr C cells was decreased in 6- and 8-week-old Dlk1−/− animals.
FIG. 2.
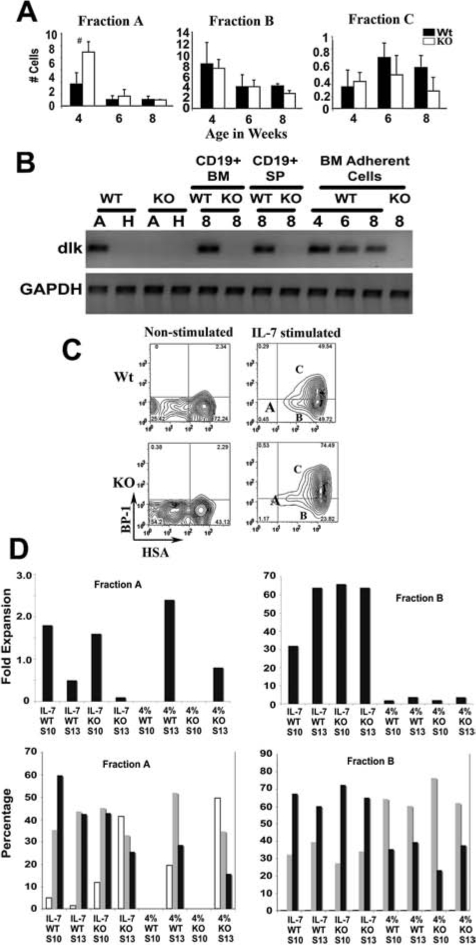
Alterations in progenitor B cell fractions of Dlk1−/− mice. (A) Bone marrow cells from femurs of 4-, 6-, or 8-week-old Dlk1−/− or wild-type control mice were analyzed by flow cytometry. The B220+, CD43+ progenitor B cell populations were resolved into three subsets (Fr A, B, and C) using BP-1-and CD24-specific antibodies. Numbers of cells in each fraction (×10−6) are shown for the indicated age. (Dark bars) Wt; (white bars) Dlk1−/− mice; (error bars) standard deviation; (#) p < 0.05. (B) RT-PCR analysis of Dlk1 expression was done using total RNA from heart (lane H, negative control), adrenal gland (lane A, positive control) from control (WT) or Dlk1−/− (KO), CD19+ cells from bone marrow (BM) and spleen (SP) of 8-week-old mice, or bone marrow adherent cells (BM) from 4-, 6-, and 8-week-old wild-type mice or 8-week-old Dlk1−/− mice. GAPDH served as control for RNA input and gel loading. (C) Bone marrow cells from 4-week-old mice (n = 3) were cultured for 4 days in medium with or without 200 units of IL-7; cells were then analyzed by flow cytometry. Representative contour plots from nonstimulated or IL-7-stimulated cultures from Dlk1−/− (KO) or wild-type controls (Wt) are shown. Fr A, B, and C subsets are marked in IL-7-stimulated contour plots. (D) Fr A or Fr B cells from control (WT) or dlk-deficient (KO) mice were seeded (source is indicated for each panel) on S10 (Dlk1+/+) or S13 (Dlk1−/− stroma in the absence (4%) or presence of IL-7. Fold expansion was determined by counting of total cells recovered from cultures at day 7 (Fr A) or day 5 (Fr B) and dividing by the number of cells seeded (1 × 10⁵/flask). The lower panels show the percentages of cells determined by flow cytometry in Fr A (white bars), Fr B (gray bars), and Fr C (black bars). Culture conditions are shown at the bottom of each graph. Flow cytometry was done as in C.
Bone marrow stroma is important for B lineage development. We observed that Dlk1 RNA is expressed in bone marrow adherent cells from wild-type mice at 4, 6, and 8 weeks of age, but not from Dlk1−/− mice (Fig. 2B). We also purified B lineage cells from bone marrow and spleen and saw that Dlk1 is expressed in these cells.
The abnormalities observed in bone marrow B lineage cells suggested several possibilities regarding formation and differentiation of pro-B cells in Dlk1−/− mice. Formation or proliferation of Fr A cells could be enhanced or transition to Fr B and Fr C could be suppressed. Pro-B cells are capable of differentiation from Fr A to Fr B then to Fr C in vitro using stromal cell cultures [4,30]. We used stromal cell cultures to investigate the influence of dlk on pro-B cell proliferation and differentiation. Total bone marrow cells from 4-week-old Dlk1−/− or wild-type control mice were cultured in complete medium with or without IL-7 (200 U/ml) for 4 days (Fig. 2C). We observed a confluent layer of endogenous stromal cells in all culture flasks. In agreement with our in vivo observation, there were more Fr A cells in nonstimulated cultures from Dlk1−/− mice compared to controls. In the absence of IL-7, slightly over 2% of Fr C cells remained by day 4 in both knockout and control cultures. In the presence of IL-7, the percentage of Fr C cells increased to 75% in Dlk1−/− cultures and to 50% in controls (Fig. 2B).
We next used more defined conditions by use of cultures initiated with sorted control or Dlk1−/− Fr A or Fr B cells seeded on Dlk1+/+ (S10) or Dlk1−/− (S13) stromal cell lines, in the presence or absence of IL-7 (Fig. 2D). Although equal numbers of B lineage cells were seeded for all conditions, Fr A cells proliferated substantially less than Fr B in the presence of IL-7. In the absence of IL-7, Fr A cell numbers increased only when dlk was absent on the stroma but Dlk+/+ B lineage cells were used. When dlk was absent on both stroma and B lineage cells, there was a slight decrease in cell number. However, when dlk was present on the stroma, no B lineage cells were recovered in the absence of IL-7.
In addition to proliferation, we examined differentiation in these cultures (Fig. 2D). When Fr A cells were seeded in the presence of IL-7, they differentiated to both Fr B and Fr C, but Fr C cells formed most efficiently when Dlk1+/+ stroma or Fr A cells were present. In the absence of dlk on both stroma and Fr A cells, there was inefficient differentiation and poor proliferation of Fr A cells.
When Fr A cells were seeded in the absence of IL-7, no B lineage cells survived when dlk was present on the stroma, regardless of the Dlk1 status of the pro-B cells. If Dlk1−/− stroma was used, there was differentiation. The best proliferation and most efficient differentiation to Fr C occurred when Dlk+/+ Fr A cells were used and dlk was absent on the stroma.
Fr B cells proliferated robustly in the presence of IL-7 and better when dlk was absent on stroma or B lineage cells or both. In the absence of IL-7, there was substantially less proliferation. Fr B cells predominantly exhibited differentiation to Fr C over proliferation in the presence of IL-7 and the use of Dlk1+/+ or Dlk1−/− Fr B or stroma seemed relatively unimportant. In the absence of IL-7, there was little proliferation and relatively less differentiation, regardless of the presence or absence of dlk.
We next analyzed bone marrow B cells based on B220, IgM, and CD43 expression because these identify the B cell differentiation stages that follow Fr C. CD43− B cells in bone marrow can be identified as progenitor/precursor B cells (Fr D, IgMneg, B220lo), newly formed B cells (Fr E, IgMpos, B220lo), and recirculating mature B cells (Fr F, IgMpos, B220hi) [4].
The numbers of Fr D and E cells were not significantly different in Dlk1−/− mice compared to their wild type controls in 4- and 8-week-old mice (Fig. 3). However, the number of Fr F cells was significantly reduced in 8-week-old Dlk1−/− mice (Fig. 3B).
FIG. 3.

Mature B cell numbers decrease in the bone marrow of Dlk1−/− mice. B220+ bone marrow B cells from 4- and 8-week-old Dlk1−/− (KO) and wild-type control (Wt) mice were subtyped into fractions D, E, and F based on B220 and IgM expression. (A) Representative dot plots from 4- and 8-week-old wild-type (Wt) and Dlk1−/− (KO) mice. Percentages of cells from each region are given in the plot. (B) Bar diagrams show cell numbers (×10−6) from the indicated fractions (n = 4). (Dark bars) wild type; (white bars) 4 Dlk1−/− white bars mice; (*) p < 0.001).
B cell development changes in Dlk1−/− spleen
Mature antibody secreting B cells from the spleen enter the circulation and home to lymph nodes and bone marrow [31]. Reduced numbers of mature B cells in the bone marrow of Dlk1−/− mice could reflect reduced generation of mature B cells in the spleen, changes in the bone marrow environment that do not effectively support recirculating mature B cells, or homing defects. To determine if there are changes in the spleen that could explain the lack of mature B cells in bone marrow, we next examined splenic B cell populations.
No obvious differences were observed in spleen based on the number and size of follicles in wild-type and Dlk1−/− mice at 8 weeks of age (Fig. 4A). To detect cellular differences, antibodies to IgM and MAd-CAM were used to localize B cells relative to the marginal and follicular areas. Antibodies to MAdCAM identify the endothelial cells present in the marginal sinus that form a border between the MZ and the FO [32], and IgM antibodies stain the FO and MZ B cells. MZ B cells fall outside of the MAdCAM-1+ cells. FO and MZ areas were measured on photomicrographs from 15 splenic follicles for comparison and statistical analysis. MZ areas were larger in Dlk1−/− mice, with an average 1.8-fold increase in pixel area compared to controls (* p < 0.005). In addition, the FO area had a slight but consistent decrease in the Dlk1−/− mice compared to wild-type mice.
FIG. 4.

Changes in marginal zone and transitional (Tr) B cells in Dlk1−/− spleen. (A) H & E-stained spleen sections from wild-type (Wt) and Dlk1−/− (KO) mice at 50× magnification (top panel) and spleen sections of nonimmunized wild-type (Wt) and Dlk1−/− (KO) mice stained with IgM (Texas Red) and MAdCAM-1 (Alexa Green 488) mAb at 200× magnification. (T) T cell zones; (FO) follicular areas; (MZ) marginal zone; (white bar) width of the MZ. (B) Dot plots show representative analysis of CD23 and CD21 expression on B220+ spleen cells from wild-type (Wt) or Dlk1−/− (KO) mice. Histograms for CD23 and CD21 expression on wild-type and Dlk1−/− B cells are shown below the dot plots. (US) Unstained control. Dot plots also show representative analysis of IgM and IgD expression. (C) Representative dot plots of B220+ AA4.1+ Tr B cells from wild-type (Wt) or Dlk1−/− (KO) spleen samples are shown. Cells within the indicated Tr region were analyzed for CD23 expression, as indicated by arrows. (D) Bar diagrams show cell numbers in the indicated B cell populations. (MZ) Marginal zone; (Tr) transitional; (Tr1) transitional type 1; (Tr2) transitional type 2. n = 3 for all groups, and symbols indicate significant differences. (#) p < 0.04; (*) p < 0.003).
The MZ contains several cell populations, including transitional and MZ B cells [33]. To test if the expanded MZ was due to increased transitional or MZ B cell numbers, fluorescence-activated cell sorting (FACS) analysis of these populations was carried out on splenic B220+ B cell populations using CD23 and CD21 to discriminate between transitional (CD23neg, CD21neg), marginal zone (CD23neg-low, CD21high), and follicular (CD23high, CD21intermediate) B cells.
The total number of B220+ B cells did not differ significantly between spleens of wild-type or Dlk1−/− mice at 8 weeks of age (Table 1).However, the number of MZ B cells in Dlk1−/− mice was consistently four-fold higher than controls (Fig. 4B, Table 1).This difference was observed in five different experiments and persisted in mice past 16 weeks of age (not shown).
Table 1.
Splenic B-Lineage Populations
| B220+ | Wt | 51.68 ± 8.5 |
| KO | 57.31 ± 13.4 | |
| FO | Wt | 46 ± 7.3 |
| KO | 30 ± 8.1 | |
| MZ | Wt | 1.3 ± 0.39 |
| KO | 5.5 ± 1.07 | |
| Tr | Wt | 1.39 ± 0.39 |
| KO | 5.6 ± 1.6 | |
| Tr1 | Wt | 0.7 ± 0.1 |
| KO | 4.2 ± 0.7 | |
| Tr2 | Wt | 0.7 ± 0.1 |
| KO | 0.8 ± 0.6 |
Numbers (× 10−6) of the indicated B220 gated B-lineage cells from spleen were determined as described in Materials and Methods using mice that were 8 weeks of age.
We observed equivalent increases in Tr B-cells of Dlk1−/− mice at 8 weeks (Fig. 4D, Table 1).Further subtyping of Tr B cells based on CD23 expression showed that the increases in Tr cells is exclusively due to increases in Tr1 cells in Dlk1−/− mice (Fig. 4C, D, Table 1).The numbers of Tr2 cells were not appreciably different.
In dlk-deficient mice, there were consistent decreases in the number of FO B cells (Table 1).Interestingly, the fluorescence intensity of CD23 expression on FO B cells appeared to be reduced in Dlk1−/− mice (Fig. 4B). We performed additional analysis of surface markers, including IgM and IgD and CD1d [34]. In agreement with the results described above, Dlk1−/− mice showed consistent increases in IgMhigh and IgDlow cells (Fig. 4B), a population that includes both MZ and Tr1 B cells. Also, Dlk1−/− mice had increased numbers of MZ B cells as indicated by high-level expression of CD1d (not shown).
T cell subsets are unchanged in Dlk1−/− mice
Since earlier reports suggested that exogenous dlk could influence T cell growth in vitro [22], we compared T cell populations in thymus, lymph node, and spleen of control and Dlk1−/− mice. No perturbations were observed in numbers or proportions of mature T cell subsets in spleen and lymph node, or in immature or mature T cell subsets in the thymus (not shown). These results were consistent with the lack of visual changes in the T cell zones of follicles (Fig. 4A).
Effects on Ig homeostasis and immune response
The observation that B cell development was altered in Dlk1-deficient mice suggested that targeted disruption of Dlk1 might also perturb B cell function. We first examined homoeostasis of serum Ig levels, a parameter that indicates normal B cell function [35]. Among the isotypes tested, IgG2b, IgA, and IgM remained relatively unaffected. In contrast, IgG1 and IgG3 were both increased over three-fold in Dlk1−/− mice, as compared to controls (Fig. 5A).
FIG. 5.

Effects of dlk deficiency on humoral immunity. (A) The bar diagram shows the titer at 50% inhibition for the indicated Ig isotypes analyzed from serum of nonimmunized wild-type (Wt, n = 3) or Dlk1−/− (KO, n = 4) mice. (Asterisks) Statistically significant differences; p < 0.001. (B) Mice (Wt, KO, n = 3) were immunized with T-independent antigen DNP-LPS, and serum was analyzed for the indicated DNP-specific antibody isotypes. (C) Mice were immunized with the T-dependent antigen DNP-KLH and serum was analyzed for the indicated DNP-specific antibodies. Results from primary (top panel) and secondary (bottom panel) immune responses are shown. (Asterisks) Statistically significant differences; (*) p < 0.01 and (**) p < 0.015.
Humoral immune responses to a T-dependent antigen (DNP-KLH) and to a T-independent antigen (DNP-LPS) were also examined in 8-week-old mice. We observed no significant differences in the DNP-specific IgM and IgG responses to the T-independent antigen DNP-LPS (Fig. 5B). In contrast, the T-dependent DNP-specific response following primary immunization with DNP-KLH showed a two-fold increase for IgM, IgG1, IgG2a/2c, IgG2b, and IgG3 as compared to control serum (Fig. 5C). This has been confirmed in two independent immunizations (data not shown).
Altogether, our results demonstrate that absence of dlk leads to altered patterns of B cell development in bone marrow and spleen and also leads to alterations in the humoral immune response.
Discussion
Our investigations show that Dlk1−/− mice display several abnormalities in B cell development and function. The most dramatic observations were changes in splenic B cell subsets of Dlk1−/− mice, including the increased numbers of Tr and MZ B cell populations. An especially intriguing observation was that the numbers of Tr2 B cells was the same in Dlk1−/− and control mice. This population also contains most of the recently identified MZ precursors (sIgMhi, CD21/35hi) as well as Tr3 cells (sIgMint, CD21/35int) [36]. If either Tr3 or MZ precursor populations had expanded to the same degree as the MZ B cell population (four-fold or more), we most likely would have detected this in our analysis of the Tr2 population. Because the Tr2 populations were the same in knockout and control mice, the expansion of the MZ B cell population in Dlk1−/− mice is not matched by a similar expansion of the MZ precursor population. The expansion of MZ B cells could be due to increased longevity or proliferation of MZ B cells. Alternatively, Dlk1−/− MZ precursors may be subject to more rapid kinetics of formation and differentiation than in wild-type mice. Accumulation of transitional B cells in the spleen of Dlk1−/− mice could be due to decreased negative selection, because this is the population of cells targeted for negative selection in spleen [37]. Future experiments will better characterize the Tr/MZ precursor populations to understand more fully the importance of dlk in splenic B cell development. Also, Dlk1−/− mice had a consistent > four-fold increase in a small B220+CD23−CD21int population of cells that needs further analysis because it has not been previously characterized and appears to be expanded due to lack of dlk.
dlk may influence the cell fate choice for MZ B cell development. The Notch2 signaling pathway regulates development of marginal zone B cells [11,38,39]. dlk is expressed on B cells in the spleen (Fig. 2B) and has been shown to act as a negative regulator of Notch signaling [40]. If dlk inhibits Notch2, lack of dlk could explain the expansion of MZ B cells in Dlk1−/− mice. Further work is in progress to determine whether dlk influences Notch2 signaling in B cells.
We also observed that young Dlk1−/− mice have increased numbers of Fr A cells (Fig. 2). Our observation that Dlk1 is expressed in both B lineage cells and stromal cells in the bone marrow suggests that dlk may play an important role in the cell–cell interactions that are crucial for early B cell development in bone marrow [30].
Several possibilities could explain the observation that lack of dlk results in increased numbers of Fr A cells in bone marrow. One possibility is increased proliferation of Fr A cells. Our observations (Fig. 2) and prior evidence indicate that Fr A cells are not highly proliferative [4,41]. Our results show that Fr A proliferates minimally in the presence of IL-7 and certainly not better when dlk is lacking, so our experiment does not support the possibility that Fr A cells are more proliferative in Dlk1−/− mice. However, our observation that normal Dlk1+/+ pro-B cells can proliferate slowly without IL-7 on stroma lacking dlk (Fig. 2D) agrees with our previous findings [24].
A second possibility is that the transition from Fr A to Fr B is suppressed in the absence of dlk. Indeed, we observed that the absence of dlk on both stroma and B lineage cells leads to poorer differentiation from Fr A in vitro both in the presence and absence of IL-7. It is possible that this effect allows for the accumulation of Fr A observed in vivo.
A third possibility is that lack of dlk results in more frequent production of common lymphoid progenitors or more frequent commitment to formation of Fr A cells. Our experiment did not directly address these scenarios, but we did not observe increases in T cell numbers in Dlk1−/− mice that might be expected due to more progenitors, or decreases if the existing progenitors more frequently are directed to the B cell lineage. It remains possible that dlk inhibits differentiation of hematopoietic stem cells (HSCs) and that its absence resulted in increased differentiation of HSCs into Fr A pro-B cells. dlk may play a similar role in human hematopoiesis because it has been established that dlk is expressed in certain fetal stromal cell lines and is necessary for proliferation of undifferentiated hematopoietic stem cells (HSCs) [20,42]. CD34+ hematopoietic stem cells from low-risk myelodysplastic syndrome (MDS) patients have increased expression of dlk in bone marrow [27], and the primary MDS condition results in defective differentiation and ineffective hematopoiesis [27,43].
The increased number of Fr A cells in 4-week-old Dlk1−/− mice decreased to normal levels by 6 weeks of age. Dlk1 RNA was found to be expressed in neonatal liver (Fig. 1D) and bone marrow stroma and B cells (Fig. 2B). These observations suggest that the influence of dlk on differentiation of stem cells into early B lineage progenitors is more important for embryonic and neonatal B cell differentiation.
Our preliminary in vitro differentiation studies suggested that the generation of Fr C cells is at least equivalent, if not better, in bone marrow cultures from 4-week-old Dlk1−/− mice compared to controls. When we used a less heterogeneous culture system, we observed that Fr B cells are quite proliferative and capable of generating Fr C cells in the presence of IL-7. In the absence of IL-7, Fr B cells did not proliferate well and differentiation to Fr C was inhibited. This might explain the trend toward less Fr C cells as the Dlk1−/− mice aged. It is possible that the young Dlk1−/− bone marrow microenvironment may not produce sufficient IL-7 to support differentiation of Fr C efficiently. The dramatic response of Dlk1−/− bone marrow cells to IL-7 stimulation in vitro shows that there is no B cell-intrinsic defect in IL-7 response in Dlk1−/− mice, supporting the idea that changes occur in the bone marrow microenvironment.
Interestingly, there was a decrease of the Fr F mature recirculating B cell population in bone marrow of 8-week-old Dlk1−/− mice, at an age where increases in Tr and MZ B-cells were observed. The reduced number of FO B cells and reduced memory response suggest the possibility that Fr F production is inhibited in Dlk1−/− mice. Another possibility is that homing or stromal support are decreased when dlk is lacking. It has been shown that survival of mature B/plasma cells in the bone marrow is dependent on stromal cells [44] and homing of plasma cells to the bone marrow is dependent upon cell–cell interactions between plasma cells and stromal cells [45]. Further studies are necessary to distinguish among these possibilities.
Our results show that lack of dlk not only affects bone marrow B cell differentiation but also perturbs peripheral B cell compartments, resulting in increased numbers of Tr and MZ B cells and decreases in FO B cell numbers. Studies in IL-7, E2A, and λ5 knockout mice have also shown that defective early B cell development often results in an expanded MZ as a compensatory mechanism to attain a complete natural antibody repertoire [46]. An interesting question is whether the peripheral B cell changes in Dlk1−/− mice are due to the alterations in early B cell development or peripheral influences on B cell development.
Changes in B cell development are reflected in the altered immunoglobulin levels in preimmune and immunized animals. Whereas FO B cells are important for the germinal center reaction and formation of long-term memory cells [47], MZ B cells act as a first line of defense [48] and mediate T-independent immune responses [49]. In preimmune animals at 8 weeks of age, there were elevated levels of IgG1 and IgG3, isotypes associated with MZ B cells (Fig. 5). At 8 weeks of age, MZ B cell numbers are increased compared to those of the wild-type control mice (Fig. 5) and could have led to the observed increases in these Ig isotypes in Dlk1−/− mice.
Our observation that the primary T-dependent antibody response (Fig. 5C) is increased in Dlk1−/− mice may indicate that both FO and MZ B cells could have contributed to it. It has been recently shown that MZ B cells are capable of mounting a T-dependent response [50]. The decrease in IgG1 and IgG2a/2c secondary responses are explained by several observations including the decreased number of FO B cells, the primary source of memory B cells. Also, the MZ B cells, most likely the source of the increased primary antibody, do not generally form memory cells [33] and might not participate in the secondary response and could favor the generation of antibody-forming cells (AFCs) over memory cells.
Recently, published observations show that dlk plays a role in B cell development in vivo. Sakajiri et al. [27] reported impaired in vitro pre-B cell growth as evidenced by a pre-B colony assay. In contrast, our observations suggest there are no defects in pre-B cell formation (Fr C and Fr D) and no defect in the in vitro response to IL-7 stimulation. However, the differences in those results could be due to differences in the targeting construct and technical details of assays. Our study used more molecular markers to characterize in vitro and in vivo B cell populations in Dlk1−/− mice.
Different stages of B cell development require cell–cell interactions for growth and differentiation. We have shown that mice lacking dlk have altered patterns in stromal-dependent stages of bone marrow B cell development. We also saw that splenic B cell populations are altered in Dlk1−/− mice and that the humoral immune response in dlk-deficient mice is altered. Altogether, these results show that dlk is an important molecule that regulates B cell development.
Acknowledgments
We thank Drs. Marjorie Shapiro and Stuart Rudikoff for critical reading of the manuscript. This paper does not present an official position of the FDA. Dr. Raghunandan's work was supported by CBER's Director's Targeted Research Award and FDA CBER intramural funding. Drs. Jia and Testoye's work was supported by the NCI-FDA Interagency Oncology Task Force.
References
- 1.Hardy RR. B-cell commitment: deciding on the players. Curr Opin Immunol. 2003;15:158–165. doi: 10.1016/s0952-7915(03)00012-8. [DOI] [PubMed] [Google Scholar]
- 2.Pietrangeli CE. Hayashi S. Kincade PW. Stromal cell lines which support lymphocyte growth: characterization, sensitivity to radiation and responsiveness to growth factors. Eur J Immunol. 1988;18:863–872. doi: 10.1002/eji.1830180606. [DOI] [PubMed] [Google Scholar]
- 3.Nishikawa S. Ogawa M. Kunisada T. Kodama H. B lymphopoiesis on stromal cell clone: stromal cell clones acting on different stages of B cell differentiation. Eur J Immunol. 1988;18:1767–1771. doi: 10.1002/eji.1830181117. [DOI] [PubMed] [Google Scholar]
- 4.Hardy R. Carmack C. Shinton S. Kemp J. Hayakawa K. Resolution and characterization of pro-B and pre-pro-B cell stages in normal mouse bone marrow. J Exp Med. 1991;173:1213–1225. doi: 10.1084/jem.173.5.1213. [DOI] [PMC free article] [PubMed] [Google Scholar]
- 5.Miyake K. Medina KL. Hayashi S. Ono S. Hamaoka T. Kincade PW. Monoclonal antibodies to Pgp-1/CD44 block lympho-hemopoiesis in long-term bone marrow cultures. J Exp Med. 1990;171:477–488. doi: 10.1084/jem.171.2.477. [DOI] [PMC free article] [PubMed] [Google Scholar]
- 6.Miyake K. Hasunuma Y. Yagita H. Kimoto M. Requirement for VLA-4 and VLA-5 integrins in lymphoma cells binding to and migration beneath stromal cells in culture. J Cell Biol. 1992;119:653–662. doi: 10.1083/jcb.119.3.653. [DOI] [PMC free article] [PubMed] [Google Scholar]
- 7.Patrick CW., Jr. Smith TW. McIntire LV. Juneja HS. Cellular interactions among marrow stromal and normal/neoplastic pre-B- and B-lymphoblastic cells. Leuk Lymphoma. 1996;22:205–219. doi: 10.3109/10428199609051751. [DOI] [PubMed] [Google Scholar]
- 8.Loder F. Mutschler B. Ray RJ. Paige CJ. Sideras P. Torres R. Lamers MC. Carsetti R. B cell development in the spleen takes place in discrete steps and is determined by the quality of B cell receptor-derived signals. J Exp Med. 1999;190:75–89. doi: 10.1084/jem.190.1.75. [DOI] [PMC free article] [PubMed] [Google Scholar]
- 9.Tarlinton D. Light A. Metcalf D. Harvey RP. Robb L. Architectural defects in the spleens of Nkx2-3-deficient mice are intrinsic and associated with defects in both B cell maturation and T cell-dependent immune responses. J Immunol. 2003;170:4002–4010. doi: 10.4049/jimmunol.170.8.4002. [DOI] [PubMed] [Google Scholar]
- 10.Mebius RE. Kraal G. Structure and function of the spleen. Nature Rev Immunol. 2005;5:606–616. doi: 10.1038/nri1669. [DOI] [PubMed] [Google Scholar]
- 11.Kuroda K. Han H. Tani S. Tanigaki K. Tun T. Furukawa T. Taniguchi Y. Kurooka H. Hamada Y. Toyokuni S. Honjo T. Regulation of marginal zone B cell development by MINT, a suppressor of Notch/RBP-J signaling pathway. Immunity. 2003;18:301–312. doi: 10.1016/s1074-7613(03)00029-3. [DOI] [PubMed] [Google Scholar]
- 12.Hozumi K. Negishi N. Suzuki D. Abe N. Sotomaru Y. Tamaoki N. Mailhos C. Ish-Horowicz D. Habu S. Owen MJ. Delta-like 1 is necessary for the generation of marginal zone B cells but not T cells in vivo. Nature Immunol. 2004;5:638–644. doi: 10.1038/ni1075. [DOI] [PubMed] [Google Scholar]
- 13.Gubina E. Ruiz-Hidalgo MJ. Baladron V. Laborda J. Assignment of dlk (Dlk1) to mouse chromosome band 12E-F1 by in situ hybridization. Cytogenet Cell Genet. 2000;88:322–323. doi: 10.1159/000015519. [DOI] [PubMed] [Google Scholar]
- 14.Laborda J. Sausville EA. Hoffman T. Notario V. dlk, a putative mammalian homeotic gene differentially expressed in small cell lung carcinoma and neuroendocrine tumor cell line. J Biol Chem. 1993;268:3817–3820. [PubMed] [Google Scholar]
- 15.Smas CM. Chen L. Sul HS. Cleavage of membrane-associated pref-1 generates a soluble inhibitor of adipocyte differentiation. Mol Cell Biol. 1997;17:977–988. doi: 10.1128/mcb.17.2.977. [DOI] [PMC free article] [PubMed] [Google Scholar]
- 16.Smas CM. Kachinskas D. Liu CM. Xie X. Dircks LK. Sul HS. Transcriptional control of the pref-1 gene in 3T3-L1 adipocyte differentiation. Sequence requirement for differentiation-dependent suppression. J Biol Chem. 1998;273:31751–31758. doi: 10.1074/jbc.273.48.31751. [DOI] [PubMed] [Google Scholar]
- 17.Garces C. Ruiz-Hidalgo MJ. Bonvini E. Goldstein J. Laborda J. Adipocyte differentiation is modulated by secreted delta-like (dlk) variants and requires the expression of membrane-associated dlk. Differentiation. 1999;64:103–114. doi: 10.1046/j.1432-0436.1999.6420103.x. [DOI] [PubMed] [Google Scholar]
- 18.Floridon C. Jensen CH. Thorsen P. Nielsen O. Sunde L. Westergaard JG. Thomsen SG. Teisner B. Does fetal antigen 1 (FA1) identify cells with regenerative, endocrine and neuroendocrine potentials?. A study of FA1 in embryonic, fetal, and placental tissue and in maternal circulation. Differentiation. 2000;66:49–59. doi: 10.1046/j.1432-0436.2000.066001049.x. [DOI] [PubMed] [Google Scholar]
- 19.Tanimizu N. Nishikawa M. Saito H. Tsujimura T. Miyajima A. Isolation of hepatoblasts based on the expression of Dlk/Pref-1. J Cell Sci. 2003;116:1775–1786. doi: 10.1242/jcs.00388. [DOI] [PubMed] [Google Scholar]
- 20.Moore KA. Pytowski B. Witte L. Hicklin D. Lemischka IR. Hematopoietic activity of a stromal cell transmembrane protein containing epidermal growth factor-like repeat motifs. Proc Natl Acad Sci USA. 1997;94:4011–4016. doi: 10.1073/pnas.94.8.4011. [DOI] [PMC free article] [PubMed] [Google Scholar]
- 21.Laborda J. The role of the epidermal growth factor-like protein dlk in cell differentiation. Histol Histopathol. 2000;15:119–129. doi: 10.14670/HH-15.119. [DOI] [PubMed] [Google Scholar]
- 22.Kaneta M. Osawa M. Sudo K. Nakauchi H. Farr AG. Takahama Y. A role for pref-1 and HES-1 in thymocyte development. J Immunol. 2000;164:256–264. doi: 10.4049/jimmunol.164.1.256. [DOI] [PubMed] [Google Scholar]
- 23.Ohno N. Izawa A. Hattori M. Kageyama R. Sudo T. dlk inhibits stem cell factor-induced colony formation of murine hematopoietic progenitors: Hes-1-independent effect. Stem Cells. 2001;19:71–79. doi: 10.1634/stemcells.19-1-71. [DOI] [PubMed] [Google Scholar]
- 24.Bauer SR. Ruiz-Hidalgo MJ. Rudikoff EK. Goldstein J. Laborda J. Modulated expression of the epidermal growth factor-like homeotic protein dlk influences stromal-cell-pre-B-cell interactions, stromal cell adipogenesis, and pre-B-cell interleukin-7 requirements. Mol Cell Biol. 1998;18:5247–5255. doi: 10.1128/mcb.18.9.5247. [DOI] [PMC free article] [PubMed] [Google Scholar]
- 25.Ruiz-Hidalgo MJ. Gubina E. Tull L. Baladron V. Laborda J. dlk modulates mitogen-activated protein kinase signaling to allow or prevent differentiation. Exp Cell Res. 2002;274:178–188. doi: 10.1006/excr.2001.5464. [DOI] [PubMed] [Google Scholar]
- 26.Moon YS. Smas CM. Lee K. Villena JA. Kim KH. Yun EJ. Sul HS. Mice lacking paternally expressed Pref-1/Dlk1 display growth retardation and accelerated adiposity. Mol Cell Biol. 2002;22:5585–5592. doi: 10.1128/MCB.22.15.5585-5592.2002. [DOI] [PMC free article] [PubMed] [Google Scholar]
- 27.Sakajiri S. O'Kelly J. Yin D. Miller CW. Hofmann WK. Oshimi K. Shih LY. Kim KH. Sul HS. Jensen CH. Teisner B. Kawamata N. Koeffler HP. Dlk1 in normal and abnormal hematopoiesis. Leukemia. 2005;19:1404–1410. doi: 10.1038/sj.leu.2403832. [DOI] [PubMed] [Google Scholar]
- 28.Collins LS. Dorshkind K. A stromal cell line from myeloid long-term bone marrow cultures can support myelopoiesis and B lymphopoiesis. J Immunol. 1987;138:1082–1087. [PubMed] [Google Scholar]
- 29.Takada S. Tevendale M. Baker J. Georgiades P. Campbell E. Freeman T. Johnson MH. Paulsen M. Ferguson-Smith AC. Delta-like and gtl2 are reciprocally expressed, differentially methylated linked imprinted genes on mouse chromosome 12. Curr Biol. 2000;10:1135–1138. doi: 10.1016/s0960-9822(00)00704-1. [DOI] [PubMed] [Google Scholar]
- 30.Hardy RR. Kishimoto T. Hayakawa K. Differentiation of B cell progenitors in vitro: generation of surface IgM+ B cells, including Ly-1 B cells, from Thy-1-asialoGM1+ cells in newborn liver. Eur J Immunol. 1987;17:1769–1774. doi: 10.1002/eji.1830171214. [DOI] [PubMed] [Google Scholar]
- 31.Cyster JG. Homing of antibody secreting cells. Immunol Rev. 2003;194:48–60. doi: 10.1034/j.1600-065x.2003.00041.x. [DOI] [PubMed] [Google Scholar]
- 32.Girkontaite I. Sakk V. Wagner M. Borggrefe T. Tedford K. Chun J. Fischer KD. The sphingosine-1-phosphate (S1P) lysophospholipid receptor S1P3 regulates MAdCAM-1+ endothelial cells in splenic marginal sinus organization. J Exp Med. 2004;200:1491–1501. doi: 10.1084/jem.20041483. [DOI] [PMC free article] [PubMed] [Google Scholar]
- 33.Pillai S. Cariappa A. Moran ST. Marginal zone B cells. Annu Rev Immunol. 2005;23:161–196. doi: 10.1146/annurev.immunol.23.021704.115728. [DOI] [PubMed] [Google Scholar]
- 34.Roark JH. Park SH. Jayawardena J. Kavita U. Shannon M. Bendelac A. CD1.1 expression by mouse antigen-presenting cells and marginal zone B cells. J Immunol. 1998;160:3121–3127. [PubMed] [Google Scholar]
- 35.Lopes-Carvalho T. Kearney JF. Development and selection of marginal zone B cells. Immunol Rev. 2004;197:192–205. doi: 10.1111/j.0105-2896.2004.0112.x. [DOI] [PubMed] [Google Scholar]
- 36.Srivastava B. Quinn WJ., 3rd Hazard K. Erikson J. Allman D. Characterization of marginal zone B cell precursors. J Exp Med. 2005;202:1225–1234. doi: 10.1084/jem.20051038. [DOI] [PMC free article] [PubMed] [Google Scholar]
- 37.Carsetti R. Kohler G. Lamers MC. Transitional B cells are the target of negative selection in the B cell compartment. J Exp Med. 1995;181:2129–2140. doi: 10.1084/jem.181.6.2129. [DOI] [PMC free article] [PubMed] [Google Scholar]
- 38.Saito T. Chiba S. Ichikawa M. Kunisato A. Asai T. Shimizu K. Yamaguchi T. Yamamoto G. Seo S. Kumano K. Nakagami-Yamaguchi E. Hamada Y. Aizawa S. Hirai H. Notch2 is preferentially expressed in mature B cells and indispensable for marginal zone B lineage development. Immunity. 2003;18:675–685. doi: 10.1016/s1074-7613(03)00111-0. [DOI] [PubMed] [Google Scholar]
- 39.Tanigaki K. Han H. Yamamoto N. Tashiro K. Ikegawa M. Kuroda K. Suzuki A. Nakano T. Honjo T. Notch-RBP-J signaling is involved in cell fate determination of marginal zone B cells. Nature Immunol. 2002;3:443–450. doi: 10.1038/ni793. [DOI] [PubMed] [Google Scholar]
- 40.Baladron V. Ruiz-Hidalgo MJ. Nueda ML. Diaz-Guerra MJ. Garcia-Ramirez JJ. Bonvini E. Gubina E. Laborda J. dlk acts as a negative regulator of Notch1 activation through interactions with specific EGF-like repeats. Exp Cell Res. 2005;303:343–359. doi: 10.1016/j.yexcr.2004.10.001. [DOI] [PubMed] [Google Scholar]
- 41.Lu L. Osmond DG. Apoptosis during B lymphopoiesis in mouse bone marrow. J Immunol. 1997;158:5136–5145. [PubMed] [Google Scholar]
- 42.Li L. Forman SJ. Bhatia R. Expression of DLK1 in hematopoietic cells results in inhibition of differentiation and proliferation. Oncogene. 2005;24:4472–4476. doi: 10.1038/sj.onc.1208637. [DOI] [PubMed] [Google Scholar]
- 43.Greenberg PL. Young NS. Gattermann N. Myelodysplastic syndromes. Hematology Am Soc Hematol Educ Program. 2002:136–161. doi: 10.1182/asheducation-2002.1.136. [DOI] [PubMed] [Google Scholar]
- 44.Minges Wols HA. Underhill GH. Kansas GS. Witte PL. The role of bone marrow-derived stromal cells in the maintenance of plasma cell longevity. J Immunol. 2002;169:4213–4221. doi: 10.4049/jimmunol.169.8.4213. [DOI] [PubMed] [Google Scholar]
- 45.Erickson LD. Lin LL. Duan B. Morel L. Noelle RJ. A genetic lesion that arrests plasma cell homing to the bone marrow. Proc Natl Acad Sci USA. 2003;100:12905–12910. doi: 10.1073/pnas.2131686100. [DOI] [PMC free article] [PubMed] [Google Scholar]
- 46.Martin F. Kearney JF. Marginal-zone B cells. Nature Rev Immunol. 2002;2:323–335. doi: 10.1038/nri799. [DOI] [PubMed] [Google Scholar]
- 47.Liu YJ. Arpin C. Germinal center development. Immunol Rev. 1997;156:111–126. doi: 10.1111/j.1600-065x.1997.tb00963.x. [DOI] [PubMed] [Google Scholar]
- 48.Oliver AM. Martin F. Kearney JF. IgMhighCD21high lymphocytes enriched in the splenic marginal zone generate effector cells more rapidly than the bulk of follicular B cells. J Immunol. 1999;162:7198–7207. [PubMed] [Google Scholar]
- 49.Gray D. McConnell I. Kumararatne DS. MacLennan IC. Humphrey JH. Bazin H. Marginal zone B cells express CR1 and CR2 receptors. Eur J Immunol. 1984;14:47–52. doi: 10.1002/eji.1830140109. [DOI] [PubMed] [Google Scholar]
- 50.Song H. Cerny J. Functional heterogeneity of marginal zone B cells revealed by their ability to generate both early antibody-forming cells and germinal centers with hypermutation and memory in response to a T-dependent antigen. J Exp Med. 2003;198:1923–1935. doi: 10.1084/jem.20031498. [DOI] [PMC free article] [PubMed] [Google Scholar]