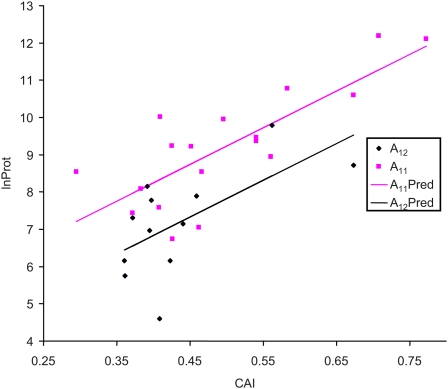
Figure 4 .
Visualization of the difference in protein abundance between A11 and A12 genes, when codon adaptation index (CAI) is use as a covariate to control for differences in translation elongation efficiency. A11Pred and A12Pred are fitted regression lines from an analysis of covariance, and lnProt is the log-transformed protein abundance from Ghaemmaghami et al. (2003). The difference in intercept is 1.4108 (P = 0.0015).

