Abstract
Background and Aims
Many physiological processes such as photosynthesis, respiration and transpiration can be strongly influenced by the diurnal patterns of within-tree water potential. Despite numerous experiments showing the effect of water potential on fruit-tree development and growth, there are very few models combining carbohydrate allocation with water transport. The aim of this work was to include a xylem circuit into the functional–structural L-PEACH model.
Methods
The xylem modelling was based on an electrical circuit analogy and the Hagen–Poisseuille law for hydraulic conductance. Sub-models for leaf transpiration, soil water potential and the soil–plant interface were also incorporated to provide the driving force and pathway for water flow. The model was assessed by comparing model outputs to field measurements and published knowledge.
Key Results
The model was able to simulate both the water uptake over a season and the effect of different irrigation treatments on tree development, growth and fruit yield.
Conclusions
This work opens the way to a new field of modelling where complex interactions between water transport, carbohydrate allocation and physiological functions can be simulated at the organ level and describe functioning and behaviour at the tree scale.
Keywords: Carbon allocation, water stress, xylem, functional–structural plant modelling, plant growth simulation, L-PEACH
INTRODUCTION
L-PEACH is a functional–structural model of tree growth based on carbon partitioning among individual organs in peach (Prunus persica) trees, where carbon partitioning is driven by competition among individual plant organs acting as semi-autonomous components interacting with each other and the environment. In this model the underlying mechanism for carbon transport treats the plant as a network of components and uses an analogy with an electrical circuit to compute the flow of carbohydrate between every component. This work was achieved with an upgraded version of the model, L-PEACH-h, that uses hourly simulation time-steps instead of daily time-steps as was the case for the daily simulation model L-PEACH, now named L-PEACH-d (Allen et al., 2005; Lopez et al., 2008, 2010).
L-PEACH-h models each organ and overall tree development in response to environment and management practices over multiple years. However, as with the majority of carbohydrate partitioning models, previous versions of L-PEACH did not take plant water relations into account while simulating physiological functioning or growth over time. Water availability is a key factor governing tree development that affects growth directly and indirectly through reduced organ growth and decreased production and transport of carbohydrate.
Many physiological processes such as photosynthesis, respiration and transpiration can be strongly influenced by environmental variables such as light, temperature, relative humidity, soil water availability, etc., that can vary dramatically during a day (Nobel, 1999). Thus, in order to simulate realistic and accurate interactions between environmental inputs and physiological function, it was decided that the next logical step in the development of L-PEACH-h was to include a xylem circuit so that the diurnal water potential of each organ could be simulated along with its physiological functioning and growth.
In plants, water moves from soil through roots, up through the xylem circuit of the stems and eventually evaporates from the leaves. Therefore, in addition to the xylem circuit, modelling water transport in a tree requires simulating both water uptake from the soil and leaf transpiration; i.e. modelling soil water availability and the soil–plant–atmosphere interactions (Slatyer, 1967; Thornley and Johnson, 1990).
A tree growth model based on carbon partitioning coupled with water transport offers a relevant framework for simulating water stress effects on tree growth, yield and fruit size. In this work, we present the implementation of water transport in the L-PEACH-h model and its coupling with carbohydrate partitioning and physiological functioning. The resulting model was evaluated by comparing simulation results with experimental data from orchard-grown peach trees.
MATERIALS AND METHODS
Model description
To model the water transport, the natural decomposition of the tree into phytomers was used and each organ was associated with a sub-circuit using the electrical analogy similar to the carbohydrate-allocation modelling already present in L-PEACH (Allen et al., 2005; Prusinkiewicz et al., 2007; Lopez et al., 2008). In the water-transport electrical-circuit analogy, the xylem vessels of each organ (internodes, leaves, fruits and root) are represented by conductances, and interfaces with the environment are represented as sources (soil interface) and sinks (atmosphere interface), as illustrated in Fig. 1.
Fig. 1.
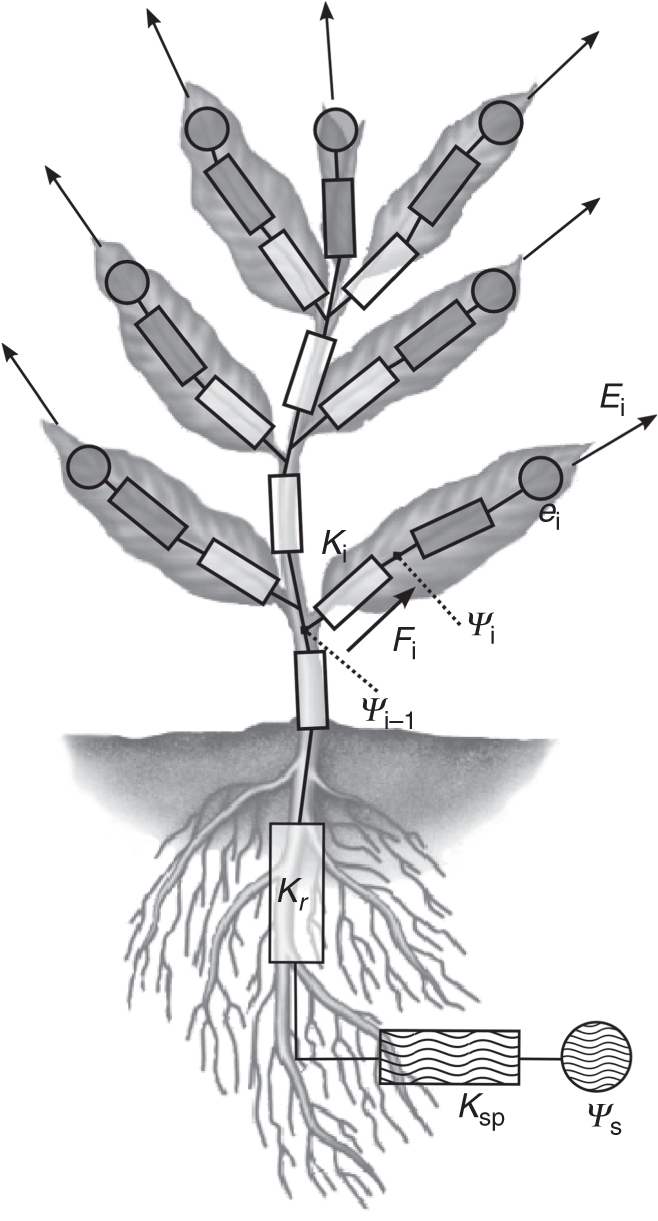
Representation of the modelled xylem circuit. The stem components are displayed in white, the soil–plant components are wavy striped and the leaf ones are in grey. Rectangles represent the conductances and circles represent sources and sinks at the interfaces with the environment. The arrows represent the transpiration that occurs from each leaf. See text for details.
In the actual model, the fruit sub-model does not include transpiration, and consequently does not affect water flow in the xylem. Conductance, transpiration and water availability are modelled as non-linear functions that change with time. Thus water potential at each point in the circuit is evaluated by means of the fold–unfold procedure described by Prusinkiewicz et al. (2007). This method uses Thévenin's theorem to allow a numerical resolution equivalent to the Newton–Rhapson method (Press et al., 1992).
Using estimated water potentials, the flow of water can be computed through every organ. The flow of water, Fi (cm3 s−1), through the ith element is:
| (1) |
where Ψ (MPa) is the water potential, K (cm3 MPa−1 s−1) is the conductance, i is the index of the organ of interest and i – 1 the index of the adjacent proximal organ (Fig. 1). This index convention will be used in the rest of this paper for purposes of clarity.
To model water transport in the tree, three necessary components were modelled: (1) leaf transpiration, (2) soil water availability and the soil plant interface and (3) the xylem circuit.
Leaf transpiration
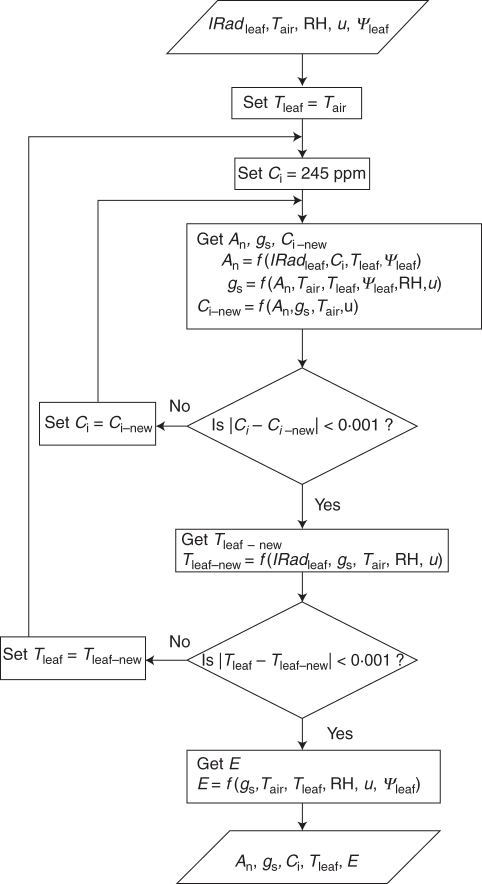
The leaf transpiration was computed by the leaf sub-model implemented in the L-PEACH-h version of the model. The leaf sub-model is a coupled model of instantaneous photosynthesis and transpiration based on Kim and Lieth (2003) and Collatz et al. (1991). The coupled model includes sub-models of photosynthesis (Farquhar et al., 1980), stomatal conductance (Ball et al., 1987) and an energy budget. The sub-models are interdependent and a nested iteration process was carried out to solve them. Initially an iteration process was employed until intercellular CO2 concentration was stable. Subsequently, by means of a second iteration process, a stable leaf temperature was computed. In particular, the stomatal conductance was estimated using the model proposed by Ball et al. (1987):
| (2) |
where gs (mol H2O m−2 s−1) is the stomatal conductance, b (mol H2O m−2 s−1) is the stomatal conductance at the light compensation point (An = 0), m (mol H2O mol−1 air) is an empirical constant, An (μmol CO2 m−2 s−1) is the net CO2 assimilation rate, hs (–) is the relative humidity at the leaf surface and Cs (μmol CO2 mol−1 air) is the CO2 concentration at the leaf surface. The two empirical parameters, b and m, were obtained for the ‘Cal Red’ peach cultivar from previous studies of Girona et al. (1993), and hs and Cs were obtained from the water vapour and CO2 budget between the leaf surface and the ambient air. The association of these sub-models allowed transpiration rate to be calculated as a function of leaf properties and environmental variables (intercepted radiation, air temperature, air relative humidity, wind speed and leaf water potential) as illustrated Fig. 2. In the present case, constant atmospheric pressure and ambient CO2 concentration were used. The transpiration rate of each leaf was then used to set the sink strength of the leaf sub-circuit as detailed in the section entitled ‘Xylem circuit’.
Fig. 2.
Schematic of the leaf sub-model flow. IRadleaf is the leaf-intercepted radiation, Tair and Tleaf are the air and leaf temperature, respectively, RH is the air relative humidity, u is the wind speed, Ψleaf is the leaf water potential, Ci is the internal CO2 concentration, An is the net CO2 assimilation rate, gs is the stomatal conductance and E is the leaf transpiration.
Water availability and soil–plant interface
Water availability and consequently soil water potential are directly related to the water used by the tree. Therefore these parameters could not be simple inputs to the model but had to be estimated at each step of the simulation. This was achieved by adding a soil sub-model connected to the root of the tree. The soil was modelled in a manner identical to the root – as an underground cylinder that grew with the root. The radius of the cylinder followed the radius of the canopy, whereas the depth depended on root weight and root density in the soil. This growing cylinder defined a volume of soil accessible to the root. Depending on the soil, a maximum soil relative water content, Θmax (m3 water m−3 soil), was defined. This parameter defined the maximum quantity of water per cubic metre of soil, and consequently the maximum amount of available water. At each step of the simulation, the water transpired by the leaves was removed from the soil changing the currently available water and the simulated relative water content, Θ (m3 water m−3 soil). The water depletion had two effects.
(1) It directly affected the soil water potential which was modelled as suggested by Thornley and Johnson (1990):
| (3) |
where Ψs (MPa) is the soil water potential and b (–) is a parameter characterizing the type of soil, ranging from sand to clay, from 2 to 18, respectively.
(2) The water depletion during the day is faster than water remobilization within the soil, generating a local lack of water around the root known as the soil–root air gap (Nobel, 1999). This air gap reduces the root ability to take up water and consequently induces a reduction of the root water potential. This effect was taken into account in the modeling of the soil–plant conductance at the root level. The soil-to-plant conductance, Ksp, was defined as the soil hydraulic conductivity in the root surroundings. It was assumed that Ksp decreased as the soil–root air gap increased with the daily depletion of water and returned to its initial value during the night when transpiration stopped. As a consequence, the relative water content was defined at dawn of each day, Θdawm, and the ratio Θ/Θdawn used as a modifier for the conductance, inducing diurnal patterns of decreased conductance. The soil hydraulic conductivity differed as a function of soil type and the air gap, hence the final expression for the soil–plant conductance was:
| (4) |
where Ksmax is the maximum value of the soil hydraulic conductivity when Θ = Θmax. Ksmax could range from 10−4 (kg m−3) for a clay soil to 10−3 (kg m−3) for a sandy soil (Thornley and Johnson 1990).
Irrigation events that reset the soil water content to its maximum level were programmed to simulate irrigation scheduling either at specified time intervals or at specific thresholds of soil water availability or plant water stress. Thus virtual irrigation experiments were conducted to simulate a variety of commercial irrigation practices.
Xylem circuit
The network of xylem vessels that transport water throughout the tree were represented as a network of conductances connected in series. The core of the network was composed of the conductances of the internodes (stems); the root at one end that provides the water, and the leaves at the other end that generate the driving force for water movement through the plant through transpiration. The fact that a large amount of water is present in the tree and that rehydration of plant tissues rather than leaf transpiration can act as an auxiliary driving force should be taken into account. One way of achieving this would be to include capacitance in the modelled xylem network. However, in this first step of coupling water with carbohydrate partitioning in L-PEACH-h, we chose to keep the xylem circuit as simple as possible in order to reduce parametrization and calibration issues.
Therefore, the xylem circuit can be divided into three zones as illustrated in Fig. 1: the stems, the leaves and the root zone.
Stems
The internode component for the xylem circuit was a conductance that accounted for the water transport capacity of each stem segment. The conductance value was estimated using Hagen–Poisseuille's law that defines the conductance for a xylem vessel (Tyree and Ewers 1991; Tombesi et al., 2010), Kv (cm3 MPa−1 h−1):
| (5) |
where r (cm) is the vessel radius, μ (MPa h−1) the viscosity of the solution travelling through the vessel and l (cm) the vessel length, i.e. the internode length. Since water transport in the xylem was being modelled, the viscosity was set to 1, i.e. water viscosity at 20 °C. The conductance of the internode, K, was finally estimated by multiplying the vessel conductance by the number of xylem vessels. The number of vessels was obtained from xylem area and vessel density reported by Tombesi et al. (2010):
| (6) |
where Ax (cm2) is the cross-section area of the xylem tissue, and Dv (number of vessels cm−2) is the xylem-vessel density.
Leaves
Transpiration occurring at the leaf level is the driving force that moves water through the xylem circuit. Transpiration was computed by the leaf sub-model as a function of environment, local carbohydrate availability and water potential, and acted as a sink in the xylem circuit. Therefore the leaf component for the xylem circuit was a conductance connected to a sink component (Fig. 1, grey components). The flow of water through the leaf was thus expressed as:
| (7) |
where ei (MPa) is the sink strength set to make sure that the flow through the leaf, Fi, is equal to the leaf transpiration, Ei, estimated by the leaf sub-model, hence:
| (8) |
For convenience the conductance of the leaf component was set to 1.
Roots
While there are multiple factors governing water movement through plant roots and a detailed model of root water transport would consider multiple root conductance parameters (Steudle and Peterson, 1998) we chose to use a simple model that only specifies one variable root conductance for water transport. We reasoned that under well-watered conditions, the conductance of the root component should be sufficient to allow enough flow of water to avoid inducing a substantial drop in stem water potential compared with the root. Thus the maximum value for root conductance was set to the conductance value of the first stem segment adjacent to the root. Functional values for root conductance when water availability was more limiting were estimated using in silico experiments to find values that yielded reasonable results. This conductance represented the root component in the xylem circuit, Kr. The soil–plant interface component for the xylem circuit was composed of a conductance, set to the soil–plant conductance, Ksp, previously defined, and of a source whose strength was the soil water potential Ψs. See Fig. 1 for an illustration of the xylem circuit organization.
Coupling the xylem circuit behaviour with carbohydrate assimilation and partitioning
Water potentials simulated by the xylem circuit were linked with the carbohydrate assimilation and transport circuit in three ways: through their influence on leaf net carbon assimilation, transpiration and individual organ growth.
It is widely known that leaf water potential can affect leaf CO2 assimilation directly by influencing carboxylation efficiency, or indirectly, by influencing stomatal conductance; thus also influencing transpiration (Schulze, 1986). Solari et al. (2006) reported that decreases in CO2 assimilation in response to mild water stress in peach are more a function of decreases in stomatal conductance than carboxylation efficiency. Empirical midday stem water potential, net CO2 assimilation and transpiration rate data from Solari et al. (2006) were used to calibrate hourly net CO2 assimilation and transpiration rate responses to stem water potential values generated by the modelled xylem circuit. To accommodate a higher range of water potential values necessary for modelling, logistic functions connecting water potential to net CO2 assimilation and transpiration were used to replace the linear relationships described in Solari et al. (2006). The logistic funtions were defined as user-defined common sigmoid function with the transition phase set to the [–2·4, –0·8] MPa range and were integrated in the leaf sub-model described above.
In the L-PEACH-h model, the potential growth rate of individual organs was determined by relative growth rate functions (RGR) (Warren-Wilson, 1967, 1972; Grossman and DeJong, 1995). As shown by Solari et al. (2006) and Solari and DeJong (2006), decreases in water potential directly affected the RGR of individual organs. Therefore an actual growth rate function (AGR) was defined for each type of organ as:
| (9) |
where f(Ψ) is a function that decreases with a reduction in stem water potential. Similarly to net CO2 assimilation and transpiration response, the function f(Ψ) was adapted from the linear relationship described in (Solari et al., 2006). For fruit and leaves, the value of water potential used for growth rate modification was the water potential value of the phytomer bearing an individual organ. The coupling with the carbohydrate sources (through net CO2 assimilation) and sinks (through growth) established the phloem–xylem interactions, whereas the coupling through transpiration constituted the feed-back loop necessary for auto-regulation of the xylem.
Model evaluation
The newly implemented xylem circuit in the L-PEACH-h model was evaluated in two ways: (1) the annual pattern of simulated tree water use was compared with actual field measurements of tree water use obtained by weighing lysimeter measurements; (2) virtual irrigation experiments were conducted by varying the frequency of irrigation to simulate the development of mild water stress during the growing season.
Lysimeter measurements of tree water use
Peach tree water uptake was measured in a field experiment that involved a 1·0 ha (120 m × 87 m) orchard that surrounded a weighing lysimeter located at the University of California Kearney Agricultural Center in the San Joaquin Valley of California (36 °48′N, 119 °30'W), as described in Ayars et al. (2003). The orchard surrounding the lysimeter was planted in 1988 to a late-season peach (Prunus persica ‘O'Henry’) with 1·8-m in-row and 4·9-m between-row tree spacing. Two trees were planted 1·8 m apart in the weighing lysimeter. The trees were trained to the Kearney Agricultural Center perpendicular ‘V’ orchard system (DeJong et al., 1994). The trees in the lysimeter were fully irrigated and used to determine tree water use over multiple years. The weighing lysimeter dimensions were 2 × 4 × 2 m deep. The lysimeter tank was weighed using a balance beam and load cell configuration with most of the weight being balanced with counter weights. From the third year onward, the lysimeter was weighed hourly to determine the evapotranspiration of the two trees.
Virtual experiments
The L-PEACH-h model allows the user to save the state of all organs, hence the entire tree at any moment during a simulation run. This saved tree can then be used as the starting point for subsequent simulations. To develop a modelled tree similar to the trees that were in the weighing lysimeter, peach tree growth was simulated for three consecutive years. During the development of this simulated tree, the tree was pruned and thinned similar to the trees that grew in the weighing lysimeter. The modelled tree was then saved at the end of the third year of simulated growth. Starting from this saved tree, we simulated the fourth year of growth under three different irrigation scheduling regimes: (1) irrigations occurred every 4 d simulating well-irrigated conditions; (2) irrigations were programmed every 14 d to represent traditional flood-irrigated orchard management practices; (3) a moderate drought situation was simulated by irrigating every 21 d. These three treatments will be referred as 4-d, 14-d and 21-d treatments, respectively. The weather data used for the fourth year of growth were collected in 1991 by the California Irrigation Management Information System (CIMIS) from an automated weather station located approx. 2 km from the lysimeter site. The 1991 year corresponded to the fourth year of growth of the lysimeter trees and was chosen so the comparison of water uptake, growth and yield behaviour was made on fully mature, productive peach trees.
RESULTS
Water transport
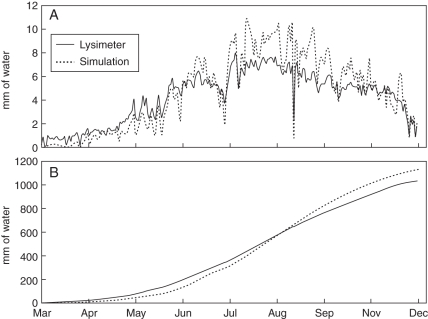
The modelling of water transport in the tree successfully reproduced tree water uptake over a year (Fig. 3A). The daily uptake of water simulated by the model slightly underestimated tree water uptake early in the season and overestimated it during mid-summer compared with lysimeter-measured values, but the simulated patterns of daily water uptake fit the patterns measured by the lysimeter measurements quite well. The total cumulative water used over the season was reasonably simulated, with a final water uptake overestimation of <10 % (Fig. 3B).
Fig. 3.
Comparison of measured seasonal water use of peach trees growing in a weighing lysimeter with simulated water use calculated with the L-PEACH-h model: (A) the pattern of daily water use; (B) cumulative water use over the season.
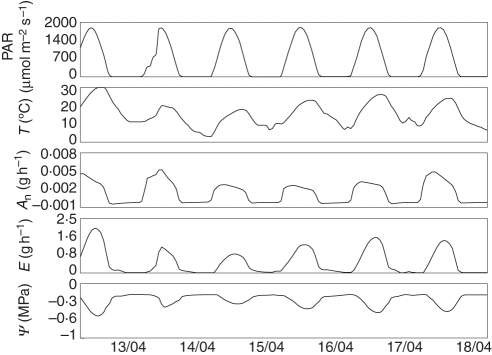
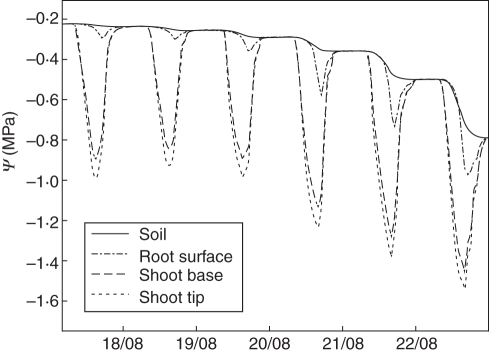
The model was also able to simulate diurnal patterns of physiological variables for each organ of the growing tree in response to environment and the local availability of resources. All environmental parameters and internal variables can be displayed for every organ on an hourly basis. Figure 4 shows examples of selected model outputs over a few days. Diurnal patterns were well defined and some direct relationships among variables were clear, e.g. temperature and leaf transpiration. Along with the diurnal pattern simulation, the model generated patterns of water potential gradients from the soil to the top of the tree over time (Fig. 5). The drying out process of the soil was depicted by a reduction in the soil water potential value as well as through the increasing diurnal pattern of the root surface water potential compared with soil water potential as the soil dried out. The gradients between the root surface and the scaffold base- and tip-simulated water potentials remained relatively stable over time even though the absolute water potential values decreased as the soil dried out.
Fig. 4.
Sample simulation outputs showing diurnal patterns of environment and physiological variables for one leaf over 6 d. The variables include (from top to bottom) photosynthetically active radiation, temperature, net CO2 assimilation rate, transpiration and stem water potential at the base of the leaf.
Fig. 5.
Sample of simulation outputs showing patterns of water potential at four locations (soil, root surface, at the base of a large shoot and at the tip of the same shoot) over 6 d as the soil begins to dry out. The difference between curves at any specific time indicates the gradient of water potential within the water transport model, from soil to the apex of a stem.
Coupling water relations with plant growth
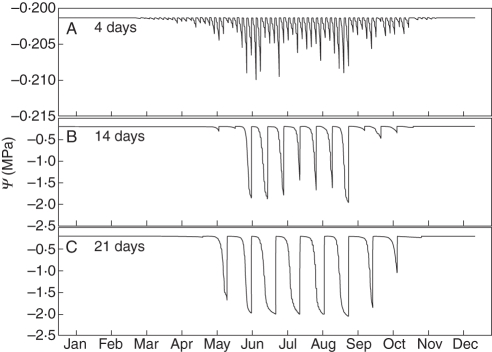
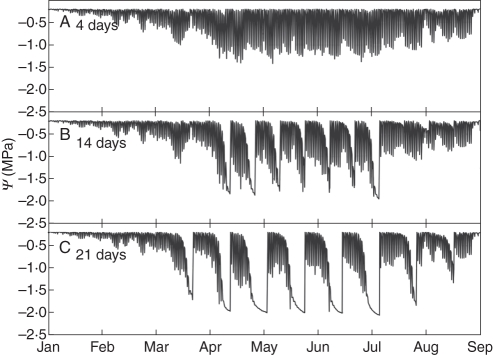
The results of the virtual irrigation experiment showed that the seasonal pattern of soil water potential of frequently watered trees directly reflected the pattern of water uptake by the tree over the season (Fig. 6A). A first peak of water use was apparent after the rapid vegetative growth period in May followed by the summer period when variations were mostly in response to weather patterns. A decline in water use occurred when days shortened and the tree began to go dormant. The different irrigation scheduling treatments greatly increased the range of simulated soil water potential values for the 14-d and 21-d treatments, respectively (Fig. 6B, C). The diurnal patterns observed under the well-irrigated conditions were still present but relatively negligible compared with the range of water potential values induced by the other irrigation schemes as underlined by the scale differences shown in Fig. 6. Water potential patterns similar to the soil were observed in the simulated stem water potentials at the base of a scaffold branch (Fig. 7). Under well-watered conditions (Fig. 7A) diurnal patterns of simulated stem water potential were almost solely a function of rates of canopy transpiration and the values never went below –1·5 MPa. Under the simulated 14-d and 21-d irrigation treatments, similar to the simulated soil water potential patterns, the range of simulated stem water potentials increased (Fig. 7B, C). However, the simulated values of water potential rarely went beyond –2 MPa, even during longer periods of stress in the 21-d treatment (Fig. 7C).
Fig. 6.
Simulated annual patterns of soil water potential for experimental runs with different irrigation scheduling treatments (irrigation to soil field capacity every 4, 14 and 21 d). Note: the scale on the y-axis was changed in (A) to allow visualization of diurnal patterns that were still present but negligible compared with the range in water potential in (B) and (C).
Fig. 7.
Simulated annual patterns of stem water potential at the basal leaf of a scaffold branch for trees subjected to the three different irrigation schedules shown in Fig. 6 (A, every 4 d; B, every 14 d; C, every 21 d). Changes in diurnal patterns are clearly visible as the soil dries out and correspond to the soil water potentials patterns in Fig. 6.
The patterns of decline in minimum daily stem water potential (Fig. 7B, C) clearly corresponded to the patterns of simulated soil water potential (Fig. 6B, C).
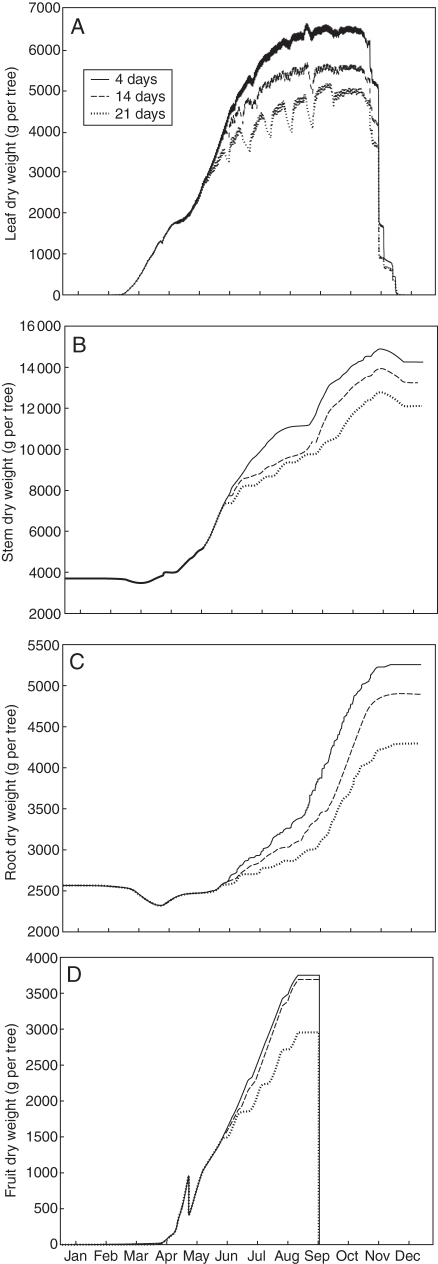
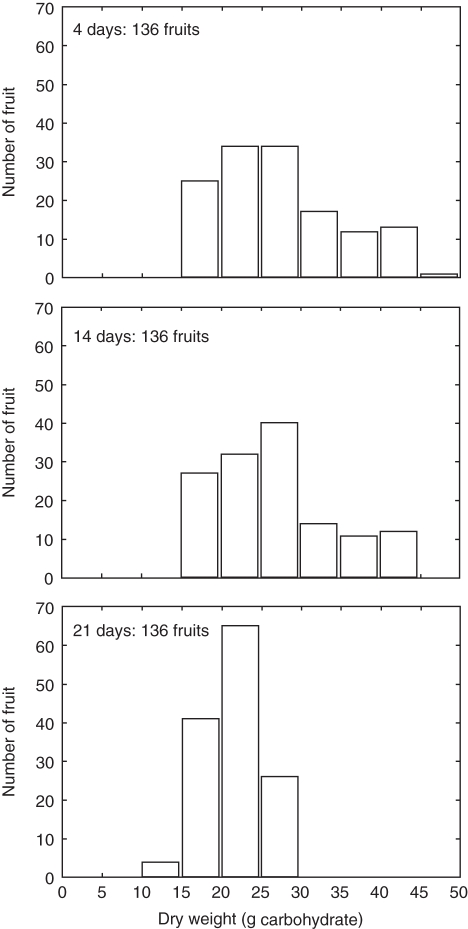
The effects of the simulated irrigation treatments on the collective growth of leaves, stems, root and fruit over the season are shown in Fig. 8. Differences between the different treatments became visible during May and early June when the first substantial drops in water potential occurred (Figs 6 and 7). The 14-d treatment had a more pronounced effect on leaf growth than on stems and root and nearly no effect on fruit growth. The 21-d treatment substantially affected all organs, including fruit, with a slightly stronger effect on the root. The oscillations in leaf dry weight, which accounted for both growth and storage, were in sync with the patterns of water potential for that treatment (Figs 6 and 7). The abrupt drop in fruit weight occurring just before May was due to a programmed fruit thinning event that simulated grower management of fruit load. The L-PEACH-h model simulated tree growth at the organ level as a function of local environment and physiological conditions. It was thus able to generate variability among organs. The simulated distribution of fruit dry weight for the different irrigation treatments is represented in Fig. 9 as a bar chart of fruit number per size (dry weight) class. Each treatment yielded the same number of fruit and similar to the cumulative dry weight, the differences in fruit distributions into different size classes between the 4-d and 14-d treatments were nearly negligible. The higher class of fruit sizes was slightly reduced to the benefit of the 25–30 g class. The changes in fruit distribution into different size classes induced by the 21-d irrigation treatment were more marked (Fig. 9), in accordance with the difference in mean fruit dry weight (Fig. 8). Fruit distribution was clearly shifted towards smaller sizes with a more normal distribution centred on the 20–25 g class.
Fig. 8.
Simulated cumulative dry-weight gains of leaves (A), stems (B), root (C) and fruit (D) for trees subjected to the three irrigation treatments shown in Fig. 6.
Fig. 9.
Simulated fruit size distributions on a 3-year-old peach tree subjected to the three different irrigation treatments shown in Fig. 5. Note: all simulations yielded the same number of fruit because the water stress occurred after fruit set but simulated fruit-size distributions changed as a function of irrigation treatment.
DISCUSSION
Simulated water uptake
Under well-watered conditions flow of water through a plant is governed by transpiration which is mainly a function of leaf canopy development, temperature and solar radiation (Slatyer, 1967). The new version of the L-PEACH-h model described in this work did a relatively good job of simulating daily and seasonal patterns of water use by 4-year-old peach trees growing in a field environment. The discrepancies observed between the lysimeter measurements and the simulations (Fig. 3) could have resulted from the fact that an isolated tree was simulated, whereas the field measurements were from trees within an orchard. The temperatures and, most certainly, the amount of received light in the orchard could have been less than measured at the nearby CIMIS station located in an open field. For purposes of computational simplicity the current light model used in the L-PEACH-h model estimated light extinction using a layered turbid medium approach (Monsi and Saeki, 1953; Ross, 1981) and only vertically directed light was considered. Therefore the model did not have the capacity to simulate the effect of shading caused by adjacent trees and was very sensitive to sudden increases in the diffuse to global radiation ratio. Thus some of the overestimation during the summer months may have been a function of the use of this rather simple light model. This hypothesis is supported by the fact that the simulated water uptake switched from overestimation to underestimation during heavy overcast days like 28 June or 12 August (Fig. 3A). These results emphasize the need for a light modelling approach that takes diffuse and direct light as well as the effect of neighbourhood into account.
Upgrading the light model used in L-PEACH-d is the next step we plan to make in the development of the model because it will improve multiple aspects of the model such as the simulation of water uptake, the light distribution within the tree and, consequently, net CO2 assimilation and carbohydrate partitioning. However, detailed light models are computationally costly and recent approaches specifically designed to address this issue (Chelle and Andrieu, 1998; Soler et al., 2003; Da Silva et al., 2008) will be investigated to find the most computationally efficient method that is compatible with the objectives of the L-PEACH-h model.
The model consistently underestimated water uptake early in the simulated growing season. This was probably at least partially due to the fact that the model did not account for soil evaporation. Soil evaporation can generally be considered a minor component in determining orchard water use when the soil is mostly shaded in the summer but may be more significant early in the season when the canopy is not fully developed (Johnson et al., 2004). Thus it is not surprising that measured water use tended to be slightly greater than simulated water use early and very late in the season when leaf cover was low.
Assessing the impact of key environmental parameters such as light and temperature on multiple physiological processes is very complicated and associated field experiments are difficult to carry out for extended periods of time. The L-PEACH-h model is ideally suited for addressing this complexity by its ability to simulate and visualize interactions among multiple variables at each step of a simulation run as illustrated in Fig. 4. In the case illustrated, the daily traces of model outputs clearly show that net CO2 assimilation, as well as the transpiration of peach leaves, depend not only on light, but also on temperature as reported by Girona et al. (1993). For simplicity in Fig. 4, this point was illustrated by graphing only five parameters over a few days but it would have been possible to plot hourly outputs of >20 parameters over multiple years; and many of the parameters would be impossible to actually monitor in the field over more than a few minutes.
The relatively accurate modelling of daily water uptake not only tends to validate the xylem circuit modelling approach and the influence of environmental variables on water use, but also indicates that the global growth of the tree was reasonable, with the caveat that an overestimation of leaves may have been responsible for the overestimation of water uptake during the summer months. Unfortunately, there were no detailed data available regarding the actual leaf area or canopy size of the trees that were growing in the lysimeter in 1991. However, unpublished data from an experiment, in which five 3-year-old peach trees that were grown under well-watered conditions at the University of California Kearney Agricultural Center were dug up in September, provided some data that could be used for partial validation. The measured dry matter of leaves, stems and roots of these trees were 6030 ± 280, 12840 ± 651 g and 3867 ± 173 tree−1, respectively. These measured data are in good accordance with the model outputs of the 3-year-old simulated tree under the 4-d treatment produced by the L-PEACH-h model (Fig. 8).
Simulated water potentials
The development of plant internal water deficit was theorized several decades ago by Slatyer (1967) as follows: ‘As transpiration proceeds it progressively reduces soil water content and soil water potential. Since there must be a gradient of decreasing potential through the water pathway from soil to atmosphere to provide the driving force to water flow, there is also a concomitant decline in the plant water potential and plant water content, and consequently an internal water deficit develops and increases in magnitude. At dawn on any day when internal gradients within the plant and soil have been more or less eliminated by the overnight equilibration period, it can be expected that the soil and plant water potential are similar even though their actual values decline each day. ( $hellip; ) In addition to this decline in plant water potential, which is an inevitable result of progressive drying of the soil profile, there is also a diurnal rhythm in plant water potential, superimposed on the general level, and caused by the relative rates of transpiration.’ This excerpt nicely describes the patterns of simulated soil, root and stem water potential illustrated in Fig. 5 that virtually match the schematic illustration of Slatyer (1967). In addition, the progressive differences between the soil water potential and the root surface water potential in Fig. 5 also illustrate the increasing effect of the soil–root air gap effect as discussed by Nobel (1999).
Simulated seasonal variations of stem water potential during periods of water stress (Fig. 7) were also in good accordance with results from field experiments as reported by Girona et al. (1993) where midday stem water potential ranged from –1·0 to –1·7 MPa and from –1·0 to –1·9 MPa for well watered and drought conditions, respectively. Lopez et al. (2006, 2007), reported similar ranges : [–0·65 ± 0·05; –1·15 ± 0·05] MPa for full irrigation and [–0·65 ± 0·05; –2·25 ± 0·15] MPa under water deficit conditions. The primary discrepancies observed between the present simulated and their observed patterns were the fact that observed water potentials did not immediately return to minimal values after irrigations as in the simulated results. This was to be expected since the L-PEACH-h model did not explicitly model water movement in the soil and when re-watering occurred, simulated soil water potential automatically returned to field capacity, whereas in the field experiments there was a lag in the recovery of soil water potential and irrigations were not always effective in bringing the soil up to field capacity.
Stem water potentials exhibited the same pattern as soil water potential except that diurnal patterns caused by transpiration were apparent (Fig. 7). The model was programmed to reduce leaf transpiration when its associated stem water potential approached a defined threshold. This tended to stabilize the minimum water potential as suggested by the dramatic decline of stomatal conductance associated with the decrease in water potential observed by Girona et al. (1993) and Johnson et al. (2004). The coupling between water transport and the leaf sub-models responsible for this feedback process behaved as expected as neither soil nor stem water potentials went substantially below –2 MPa, even during prolonged drought periods (Figs 6 and 7), in accordance with values reported by Girona et al. (1993) and Lopez et al. (2006, 2007).
Simulated water-stress effects on growth
Beyond simulating the dynamics of soil and plant water potentials, this work was designed to simulate tree responses to the different irrigation treatments. The model simulated gradual growth reductions as a function of induced water-stress for all organs (Fig. 8). Field experiments at the tree level for different irrigation treatments that yielded total dry weight per organ type data were unavailable in the literature for comparison with the present model outputs. However, Berman and DeJong (1997) reported a reduction of stem total daily growth of about 66 % between control and water-stress treatment on a summer day when the difference in midday water potential was 0·4 MPa. Under similar conditions, the L-PEACH-h model simulated reduction of stem total daily growth between the 4-d and 21-d treatments of 50 % (data not shown). The reduction of cumulative dry weight of leaves and stems resulted from both fewer numbers of organs and smaller (less dry mass) organs as a consequence of the AGR function. The visible increase in stem weight in late August resulted from increased available resources due to the programmed harvest of fruits (Fig. 8B, D). The decrease in simulated canopy leaf dry weight during periods of low water potential reflect mobilization of leaf storage reserves when CO2 assimilation was inhibited by low water potentials (Huber et al., 1984) (Fig. 8A). In addition to reductions caused by low water potentials, root growth was limited by reductions in shoot growth and carbohydrate availability. The combination of these effects resulted in the increased dry-weight reduction simulated for the 21-d treatment. Experiments to provide a more complete data set for quantifying water-stress effects on the growth of specific organs of peach trees are under-way and data from these experiments will be used for future validation of the model.
The small difference in simulated cumulative fruit dry weight between the 4-d and 14-d treatments (Fig. 8D) was similar to experimental results reported by Bryla et al. (2005). This demonstrates that while the 14-d treatment, corresponding to the traditional flood irrigation for peaches in California, was expected to have some effects on vegetative growth, it had little effect on fruit dry weight accumulation (Berman and DeJong, 1996; Johnson et al., 2004). The L-PEACH-h model accurately simulated this behaviour. This derives from the fact that fruit are the strongest carbohydrate sinks on the tree during the last half of the fruit growth period. However, it should be emphasized that Fig. 8 illustrates simulated fruit dry-weight results and that fruit dry-weight growth is much less sensitive to water stress than fresh-weight growth (Berman and DeJong, 1996; Girona et al., 2006). Field research has shown that substantial water stress decreases mean fruit fresh and dry weight (Berman and DeJong, 1996; Lopez et al., 2006, 2007), and Bryla et al. (2005) showed that the fruit size distributions were shifted to smaller fruit sizes when irrigations were less frequent. Both behaviours were reproduced by the model. While relatively similar, the higher fruit size classes were more represented in 4-d than in the 14-d simulated irrigation-treatment results (Fig. 9) leading to slightly higher mean fruit sizes (Fig. 8). These effects on mean fruit size were accentuated in the results of the simulated 21-d irrigation treatment. The simulation of fruit-size distribution, as well as the variability in growth of other individual organs was only possible because of the capacity of the L-PEACH-h model to simulate processes at the organ scale as a function of local environment and resource availability, which is a unique feature of this model.
Model limitation and potentialities
This research demonstrates that the L-PEACH-h model simulates water transport and water potential gradients through the tree in a manner consistent with published theory and experimental results. However, the model has some limitations that will need to be addressed in the future. Among them is the very simple approach of light modelling as discussed previously. Another major limitation of L-PEACH-h is the extreme simplification of the root system, and thus its soil interface, compared with the complex modelling of the canopy. Consequently, modelling a root system linking architecture with carbohydrate allocation and physiological process, similar to the above-ground part, is likely to be required prior to any further development of the model involving soil, root and water-transport interactions. More detailed root models are available (Steudle and Peterson, 1998; Thaler and Pagès, 1998; Pagès et al., 2000) but are usually complex and would further increase the model complexity. The same considerations as for a light-model upgrade would be required for further under-ground development of the model. The water-transport modelling would also benefit from the integration of an advanced leaf model that more precisely simulates internal biochemical processes and stomatal behaviour, leading to a more rigorous approach to linking leaf water potential with net CO2 assimilation and transpiration (Müller et al., 2005).
Although water is an essential parameter for tree growth and for nutrient and carbohydrate transport, it has been incorporated into very few functional–structural plant growth models (Daudet, 2002; Hölttä et al., 2006; Lacointe and Minchin, 2008; De Schepper and Steppe, 2010). To the authors' knowledge, no model has attempted to incorporate this in the architectural and temporal detail of L-PEACH-h.
The addition of water relations opens the way to numerous possibilities of further model development spanning from a full implementation of the Münch hypothesis to regulate nutrient and sugar transport in the tree (Münch, 1927), to the integration of specific sub-models like C3 leaf (Müller et al., 2005) or fruit quality (Genard and Huguet, 1996). Although the model was designed and parameterized for peach trees, the underlying concepts are generic and could be adapted very easily to other species.
With the addition of the modelling of water transport, the L-PEACH-h model has reached a development state involving systems biology and can be used to understand the intricate and complex relationships between the physiological processes and the environmental factors that govern fruit tree growth and development and also to identify gaps in current knowledge that should be investigated. Additionally, the 3-D graphical representations associated with the model through L-studio (Prusinkiewicz, 2004) that allows easy tree manipulation and variable state visualization makes L-PEACH-h a highly educational tool for students as well as for growers.
ACKNOWLEDGEMENTS
This research was partially supported by the California Tree Fruit Agreement, the California Almond Board and the Department of Plant Sciences at the University of California, Davis.
LITERATURE CITED
- Allen MT, Prusinkiewicz P, DeJong TM. Using L-systems for modeling source–sink interactions, architecture and physiology of growing trees: the L-PEACH model. New Phytologist. 2005;166:869–880. doi: 10.1111/j.1469-8137.2005.01348.x. [DOI] [PubMed] [Google Scholar]
- Ayars JE, Johnson RS, Phene CJ, Trout TJ, Clark DA, Mead RM. Water use by drip-irrigated late-season peaches. Irrigation Science. 2003;22:187–194. [Google Scholar]
- Ball J, Woodrow LE, Beny JA. A model predicting stomatal conductance and its contribution to the control of photosynthesis under different environmental conditions. Progress in Photosynthesis Research. 1987;4:221–224. [Google Scholar]
- Berman ME, DeJong TM. Water stress and crop load effects on fruit fresh and dry weights in peach (Prunus persica) Tree Physiology. 1996;16:859–864. doi: 10.1093/treephys/16.10.859. [DOI] [PubMed] [Google Scholar]
- Berman ME, DeJong TM. Crop load and water stress effects on daily stem growth in peach (Prunus persica) Tree Physiology. 1997;17:467–472. doi: 10.1093/treephys/17.7.467. [DOI] [PubMed] [Google Scholar]
- Bryla DR, Dickson E, Shenk R, Johnson RS, Crisosto CH, Trout TJ. Influence of irrigation method and scheduling on patterns of soil and tree water status and its relation to yield and fruit quality in peach. HortScience. 2005;40:2118–2124. [Google Scholar]
- Chelle M, Andrieu B. The nested radiosity model for the distribution of light within plant canopies. Ecological Modelling. 1998;111:75–91. [Google Scholar]
- Collatz G, Ball J, Grivet C, Berry J. Physiological and environmental regulation of stomatal conductance, photosynthesis and transpiration: a model that includes a laminar boundary layer. Agricultural and Forest Meteorology. 1991;54:107–136. [Google Scholar]
- Da Silva D, Boudon F, Godin C, Sinoquet H. Multiscale framework for modeling and analyzing light interception by trees. Multiscale Modeling and Simulation. 2008;7:910–933. [Google Scholar]
- Daudet F. Generalized Münch coupling between sugar and water fluxes for modelling carbon allocation as affected by water status. Journal of Theoretical Biology. 2002;214:481–498. doi: 10.1006/jtbi.2001.2473. [DOI] [PubMed] [Google Scholar]
- DeJong TM, Day KR, Doyle JF, Johnson RS. The Kearney Agricultural Center perpendicular ‘V’ (KAC-V) orchard system for peaches and nectarines. HortTechnology. 1994;4:362–367. [Google Scholar]
- De Schepper V, Steppe K. Development and verification of a water and sugar transport model using measured stem diameter variations. Journal of Experimental Botany. 2010;61:2083–2099. doi: 10.1093/jxb/erq018. [DOI] [PubMed] [Google Scholar]
- Farquhar GD, von Caemmerer S, Berry JA. A biochemical model of photosynthetic CO2 assimilation in leaves of C3 species. Planta. 1980;149:78–90. doi: 10.1007/BF00386231. [DOI] [PubMed] [Google Scholar]
- Genard M, Huguet JG. Modeling the response of peach fruit growth to water stress. Tree Physiology. 1996;16:407–415. doi: 10.1093/treephys/16.4.407. [DOI] [PubMed] [Google Scholar]
- Girona J, Mata M, Goldhamer DA, Johnson RS, DeJong TM. Patterns of soil and tree water status and leaf functioning during regulated deficit irrigation scheduling in peach. Journal of the American Society for Horticultural Science. 1993;118:580–586. [Google Scholar]
- Girona J, Marsal J, Lopez G. Establishment of stem water potential thresholds for the response of ‘O'Henry’ peach fruit growth to water stress during stage III of fruit development. Acta Horticulturae. 2006;713:197–201. [Google Scholar]
- Grossman YL, DeJong TM. Maximum fruit growth potential following resource limitation during peach growth. Annals of Botany. 1995;75:561–567. [Google Scholar]
- Hölttä T, Vesala T, Sevanto S, Perämäki M, Nikinmaa E. Modeling xylem and phloem water flows in trees according to cohesion theory and Münch hypothesis. Trees – Structure and Function. 2006;20:67–78. [Google Scholar]
- Huber SC, Rogers HH, Mowry FL. Effects of water stress on photosynthesis and carbon partitioning in soybean (Glycine max [L.] Merr.) plants grown in the field at different CO2 levels. Plant Physiology. 1984;76:244–249. doi: 10.1104/pp.76.1.244. [DOI] [PMC free article] [PubMed] [Google Scholar]
- Johnson SR, Ayars J, Hsiao T. Improving a model for predicting peach tree evapotranspiration. Acta Horticulturae. 2004;664:341–346. [Google Scholar]
- Kim S, Lieth JH. A coupled model of photosynthesis, stomatal conductance and transpiration for a rose leaf (Rosa hybrida L.) Annals of Botany. 2003;91:771–781. doi: 10.1093/aob/mcg080. [DOI] [PMC free article] [PubMed] [Google Scholar]
- Lacointe A, Minchin PEH. Modelling phloem and xylem transport within a complex architecture. Functional Plant Biology. 2008;35:772–780. doi: 10.1071/FP08085. [DOI] [PubMed] [Google Scholar]
- Lopez G, Mata M, Arbones A, Solans JR, Girona J, Marsal J. Mitigation of effects of extreme drought during stage III of peach fruit development by summer pruning and fruit thinning. Tree Physiology. 2006;26:469–477. doi: 10.1093/treephys/26.4.469. [DOI] [PubMed] [Google Scholar]
- Lopez G, Girona J, Del Campo J, Marsal J. Effects of relative source–sink position within peach trees on fruit growth under water stress conditions. The Journal of Horticultural Science & Biotechnology. 2007;82:140–148. [Google Scholar]
- Lopez G, Favreau R, Smith C, Costes E, Prusinkiewicz P, DeJong T. Integrating simulation of architectural development and source–sink behaviour of peach trees by incorporating Markov chains and physiological organ function submodels into L-PEACH. Functional Plant Biology. 2008;35:761–771. doi: 10.1071/FP08039. [DOI] [PubMed] [Google Scholar]
- Lopez G, Favreau R, Smith C, DeJong T. L-PEACH: a computer-based model to understand how peach trees grow. HortTechnology. 2010;20:983–990. [Google Scholar]
- Monsi M, Saeki T. Uber den Lichtfaktor in den Pflanzengesellschaften und seine Bedeutung fur die Stoffproduktion. Japanese Journal of Botany. 1953;14:22–52. [Google Scholar]
- Müller J, Wernecke P, Diepenbrock W. LEAFC3-N: a nitrogen-sensitive extension of the CO2 and H2O gas exchange model LEAFC3 parameterised and tested for winter wheat (Triticum aestivum L.) Ecological Modelling. 2005;183:183–210. [Google Scholar]
- Münch E. Dynamike der Saftstromungen. Berichte der deutschen botanischen Gesellschaft. 1927;44:69–71. [Google Scholar]
- Nobel PS. Physicochemical and environmental plant physiology. Amsterdam: Elsevier Academic Press; 1999. [Google Scholar]
- Pagès L, Doussan C, Vercambre G. An introduction to below-ground environment and resource acquisition, with special reference to trees: simulation models should include plant structure and function. Annals of Forest Science. 2000;57:513–520. [Google Scholar]
- Press WH, Teukolsky SA, Vetterling WT, Flannery BP. Numerical recipes in C. Cambridge: Cambridge University Press; 1992. [Google Scholar]
- Prusinkiewicz P. Art and science for life: designing and growing virtual plants with L-system. Acta Horticulturae. 2004;630:15–28. [Google Scholar]
- Prusinkiewicz P, Allen M, Escobar-Gutiérrez A, DeJong TM. Numerical methods for transport-resistance source–sink allocation models. In: Vos J, de Visser LFM, Struick PC, Evers JB, editors. Functional-–structural plant modeling in crop production. Dordrecht: Springer; 2007. pp. 123–137. [Google Scholar]
- Ross J. The radiation regime and the architecture of plant stands. The Hague: Dr W. Junk Publishers; 1981. [Google Scholar]
- Schulze ED. Carbon dioxide and water vapor exchange in response to drought in the atmosphere and in the soil. Annual Review of Plant Physiology. 1986;37:247–274. [Google Scholar]
- Slatyer R. Plant–water relationships. New York, NY: Academic Press; 1967. [Google Scholar]
- Solari LI, DeJong TM. The effect of root pressurization on water relations, shoot growth, and leaf gas exchange of peach (Prunus persica) trees on rootstocks with differing growth potential and hydraulic conductance. Journal of Experimental Botany. 2006;57:1981–1989. doi: 10.1093/jxb/erj145. [DOI] [PubMed] [Google Scholar]
- Solari LI, Johnson S, DeJong TM. Relationship of water status to vegetative growth and leaf gas exchange of peach (Prunus persica) trees on different rootstocks. Tree Physiology. 2006;26:1333–1341. doi: 10.1093/treephys/26.10.1333. [DOI] [PubMed] [Google Scholar]
- Soler C, Sillion F, Blaise F, de Reffye P. An efficient instantiation algorithm for simulating radiant energy transfer in plant models. ACM Transactions on Graphics. 2003;22:204–233. [Google Scholar]
- Steudle E, Peterson CA. How does water get through roots? Journal of Experimental Botany. 1998;49:775–788. [Google Scholar]
- Thaler P, Pagès L. Modelling the influence of assimilate availability on root growth and architecture. Plant and Soil. 1998;201:307–320. [Google Scholar]
- Thornley JHM, Johnson IR. Plant and crop modelling: a mathematical approach to plant and crop physiology. Caldwell, NJ: The Blackburn Press; 1990. [Google Scholar]
- Tombesi S, Johnson RS, Day KR, DeJong TM. Relationships between xylem vessel characteristics, calculated axial hydraulic conductance and size-controlling capacity of peach rootstocks. Annals of Botany. 2010;105:327–331. doi: 10.1093/aob/mcp281. [DOI] [PMC free article] [PubMed] [Google Scholar]
- Tyree MT, Ewers FW. The hydraulic architecture of trees and other woody plants. New Phytologist. 1991;119:345–360. [Google Scholar]
- Warren-Wilson J. Ecological data on dry matter production by plants and plant communities. In: Bradley KM, Denmead OT, editors. The Collection and processing of field data. New York: Interscience Publishers; 1967. pp. 77–123. CSIRO Symposium. [Google Scholar]
- Warren-Wilson J. Control of crop processes. In: Rees AR, Cockshull KE, Hand DW, Hurd RG, editors. Control of crop processes. New York: Academic Press; 1972. pp. 7–30. [Google Scholar]


