
Figure 1.
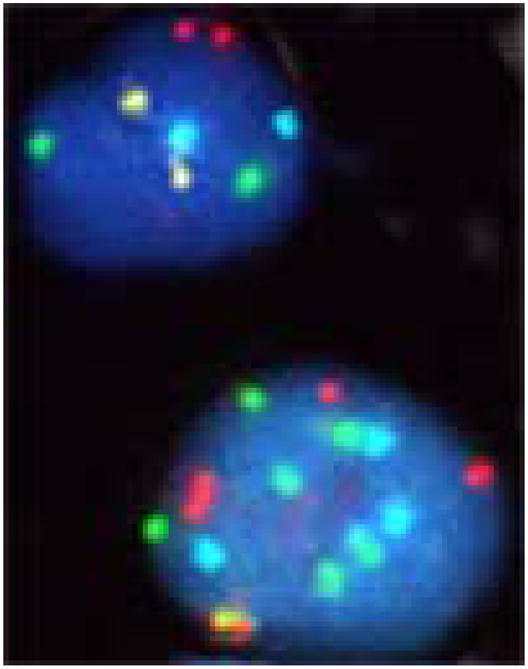
FISH assessment of cells isolated by immunomagnetic capture. A comparison between a normal cell (upper) and a cancer cell (lower) is shown, with a significant increase in copy number in the cancer cell from a patient in this series positive for CTCs. Probes: Chromosome Enumeration Probe (CEP) 3 in SpectrumRed, CEP7 in SpectrumGreen, CEP 17 in SpectrumAqua and Locus Specific Identifier in SpectrumGold.