Abstract
Introduction
[18F]Mefway is a serotonin 5-HT1A PET radiotracer with high specificity and favorable in vivo imaging properties. The chemical structure of 18F]mefway permits 18F labeling in either the cis- or trans- positions at the 4-cyclohexyl site. We have previously reported on the in vivo kinetics of trans-[18F]mefway in the nonhuman primate. In this work we compare in vivo binding of cis-[18F]mefway and trans-[18F]mefway to evaluate the properties of cis-[18F]mefway for 5-HT1A PET imaging.
Methods
The cis- and trans- [18F]mefway tracers were synthesized via nucleophilic substitution with their respective tosylate precursors. Two monkeys (1m, 1f) were given bolus injections of both cis- and trans- labeled [18F]mefway in separate experiments. Dynamic scans were acquired for 90 minutes with a microPET P4 scanner. Time activity curves were extracted in the areas of the mesial temporal cortex (MTC), anterior cingulate gyrus (aCG), insular cortex (IC), raphe nuclei (RN), and cerebellum (CB). The in vivo behavior of the radiotracers were compared based upon the nondisplaceable binding potential (BPND) using the CB as a reference region.
Results
Averaged over the 2 subjects, BPND values were MTC: 7.7, 0.58; aCG: 4.95, 0.32; IC: 3.27, 0.2; and RN: 3.05, 0.13 for trans-[18F]mefway and cis-[18F]mefway, respectively.
Conclusion
The cis- labeled [18F]mefway tracer has low specific binding throughout the 5-HT1A regions of brain compared to trans-[18F]mefway suggesting that the target to background binding of cis-[18F]mefway may limit its use for in vivo assessment of 5-HT1A binding.
Keywords: 5-HT1A, PET, serotonin, mefway
Introduction
PET imaging has been used extensively for studying the role of the serotonin1A (5-HT1A) system in developmental and disease processes. The most commonly used radiotracer for PET assay of 5-HT1A binding is [11C]WAY-100635, which has high target to background binding for investigating cortical and midbrain 5-HT1A binding[1] [2]. N-{2-[4-(2-methoxyphenyl)piperazinyl]ethyl}-N-(2-pyridyl)-N-(4-[F-18]-fluoromethylcyclohexane)carboxamide ([18F]mefway) was developed to fulfill the need for an 18F radiolabeled PET tracer for in vivo assay of serotonin 5-HT1A binding, providing improved counting statistics when compared to 11C radiolabeled tracers (11C: t1/2 = 20.3 min; 18F = 109.8 min)[3]. Based on studies in nonhuman primates, [18F]mefway displayed very similar in vivo behavior to [11C]WAY-100635 [4]. 18F]Mefway can be radiolabeled as two different isomeric forms at the 4-cyclohexyl position, representing cis-[18F]mefway and trans-[18F]mefway, which are shown in Figure 1. The varying binding affinity of isomeric forms of another closely related PET radioligand, 4-[18F]FCWAY, has been investigated [5]. The conformation of trans- and cis- [18F]FCWAY displayed a dramatic difference in 5-HT1A binding with reported IC50 values of 1.7nM and 21nM, respectively. In vivo PET measures revealed similar blood metabolic profiles, but hippocampus to cerebellum ratios were 19.3 and 3.6 for trans- and cis- [18F]FCWAY respectively [6]. Preliminary in vitro measures have also been made for [18F]mefway, which have indicated that the cis- isomer has lower affinity for the 5-HT1A receptor than the trans- isomer [7]. The goal of this work was to investigate the in vivo behavior of cis-[18F]mefway and assess its potential as a moderate affinity 5-HT1A radiotracer for yielding shortened equilibration times (~30 minutes) and sufficiently high target to background binding (>1.5) for PET imaging applications. This was accomplished by comparing the in vivo kinetics of cis-[18F]mefway and trans-[18F]mefway in rhesus monkeys.
Figure 1.
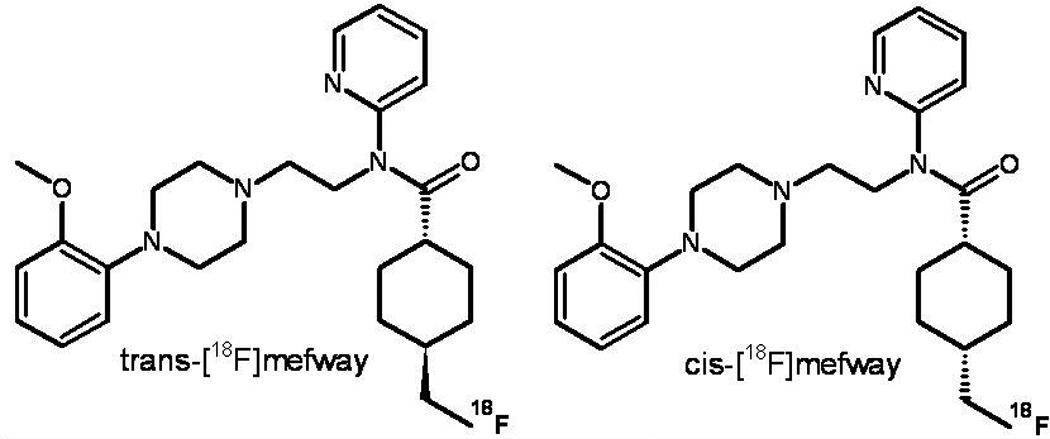
Molecular structure of trans- and cis-[18F]mefway.
Methods
Separation of cis- and trans- tosyl mefway precursor
The tosylate precursor (N-{2-[4-(2-methoxyphenyl)piperazinyl]ethyl}-N-(2-pyridyl)-N-(4-tosyloxymethylcyclohexane)carboxamide) for the radiochemical synthesis of [18F]mefway and mefway reference standard were purchased as a mixture of geometric isomers from a commercial vendor (Huayi Isotopes Co.). The isomeric separation of the tosyl mefway precursor was performed using HPLC methods. Reverse phase HPLC utilized a C18 Econosil 10 µm 250 × 10 mm column (Alltech) and mobile phase consisting of 60% acetonitrile, 40% water, and 0.1% triethylamine (by volume) at a flow rate of 2.5 mL/min. The two isomeric peaks eluted from the column at 19 and 23 minutes for the trans- and cis- tosylate mefway, respectively. The cis- and trans- tosylates were isolated from the corresponding HPLC fractions using liquid-liquid extraction. The acetonitrile was first removed from the individual eluted samples using rotoevaporation. The remaining portion was then added to 15–20 mL of methylene chloride in a separatory funnel and mixed. Once adequate separation was achieved, the liquid layer volumes were separated into two different flasks. The portion containing the methylene chloride and precursor was then further dried with magnesium sulfate and filtered. The methylene chloride was then evaporated by rotoevaporation. The product was further dried by azeotropic distillation with anhydrous acetonitrile. After separation, analytic HPLC was performed on the samples to ascertain isomeric purity. Separation was not performed on the mefway standard.
Analytic validation
Isomeric purity of the separated forms was measured using HPLC and mass spectroscopy methods. Analytic HPLC was performed using a mobile phase consisting of 45% acetonitrile and 55% 0.1M aqueous ammonium formate at a flow rate of 2.5 mL/min. The analytic column was a C18 Prodigy 5 µm 4.6 × 250 mm ODS 3 100Å (Phenomenex). The cis- and trans- mass peaks were quantitatively assayed with a uv/vis absorption detector (Waters Model 2489) at 254 nm.
Mass spectrometry (MS) was conducted on the original commercially purchased compounds (mefway standard and tosyl precursor) and on the tosylate precursor following separation. The MS was acquired using an Agilent ESI-TOF mass spectrometer in positive ion electrospray mode. Liquid chromatography mass spectrometry (LCMS) was performed on a ThermoFinnigan LTQ mass spectrometer with an Eksigent 2DnanoLC pump. The pump was setup in gradient mode with two solvents. Solvent A consisted of 0.1% formic acid in water and solvent B consisted of 50% acetonitrile, 50% ethanol, and 0.1% formic acid. The flow rate through the column was 300 nL/min consisting of initially 2% solvent B, and increasing solvent B from 2% to 90% from 2–20 minutes, then holding solvent B at 90% for 3 minutes. The column was a C18 Magic 5 µm 100 × 0.1 mm 300Å (Michrom) and a C8 Zorbax 5 µm 300SB 300 Å (Agilent) loading trap. The MS consisted of positive nanoESI spray at 3000 V using full MS scan in the range of 200 to 1000 m/z. LCMS was performed on isolated samples of trans-tosylate mefway, cis-tosylate mefway and the cis-, trans-mefway standard.
Radiochemical Synthesis
The 18F radiolabel was produced by a 16-MeV GE PETtrace cyclotron. The radiochemical synthesis was performed similar to our previously published methods [4]. In brief, 18F in an aqueous solution of potassium carbonate and Kryptofix 222 solution was dried using azeotropic distillation performed in a chemistry process control unit. Once dry, 1 mg of precursor (either trans- or cis-) dissolved in 500 µL of anhydrous acetonitrile was added to the 18F solution then heated at 95°C for 10 minutes. The mixture was then dissolved in 3 mL of methanol and passed through a preconditioned alumina cartridge. The eluted methanol was then dried and dissolved in 1.5 mL of HPLC mobile phase and injected onto HPLC. HPLC consisted of a C18 Econosil 10 µm 250 ×10 mm column (Alltech) and mobile phase consisting of 50% acetonitrile, 50% water, and 0.1% triethylamine (by volume) at a flow rate of 5 mL/min. Trans-[18F]mefway eluted from the column at 11.0 minutes and cis-[18F]mefway eluted from the column at 12.2 minutes. The eluted product was then mixed with 50 mL of sterile water and passed through a preconditioned C18 sep-pak (Waters). The sep-pak was then rinsed with 10 mL of 20% ethanol in water. The product was eluted from the sep-pak with 1 mL of anhydrous ethanol for injection, USP, through a 0.22 μm sterile filter and sequentially flushed with 9 mL of saline into a sterile empty vial. The radiosynthesis was completed in 1.5 hours, yielding specific activities of 111–130 GBq/mCi (3–3.5 Ci/µmol) and batch yields of 1.48–2.96 GBq (40–80 mCi).
Subjects
PET scans with both cis- and trans-[18F]mefway were performed on each of two Macaca mulattas (rhesus)(one male, one female; 14 kg, 7.7 kg). The ages of the subjects were 12.3 and 13.6 years and both radiotracers were scanned within two weeks of each other. Subjects were pre-anesthetized for the scanning procedures with ketamine (15 mg/kg IM) and maintained with 0.75% – 1.5% isoflurane. To reduce secretions during the scan, subjects were given atropine sulfate (0.27 mg IM). Body temperature, breathing rate, heart rate, and SpO2 levels were monitored and recorded throughout the course of the scan. Radiotracer was administered through the saphenous vein and venous plasma samples were acquired on the opposite limb. Upon completion of the PET scan, the subjects were removed from anesthesia and, when swallowing reflex returned, were placed back in the cage and continually monitored until fully alert. All experimental procedures were in accordance with the University of Wisconsin Institutional Animal Care and Use Committee.
Data Acquisition
The PET scans were acquired on a microPET P4 scanner which has an axial field of view of 7.8 cm, a transaxial field of view of 19 cm, and an in-plane spatial resolution of 1.8 mm [8]. Subject’s heads were placed in a stereotaxic head holder to assure consistency in orientation between the scans. After placement of subjects in the scanner, a 518 s transmission scan was performed using a 57Co point source. Data collection was initiated with the bolus injection of radiotracer of 120 ± 4.4 MBq (3.24 ± 0.12 mCi) and continued for a total acquisition time of 90 minutes. Venous blood samples were acquired for the cis-[18F]mefway studies beginning at 30 minutes, with 0.5 mL withdrawn at 10 minute intervals. The whole blood samples were assayed for radioactivity and then centrifuged for the extraction of plasma. Lipophilic species were extracted from the plasma by liquid-liquid extraction with ethyl acetate using methods described in our previous work [4]. Thin layer chromatography (TLC) was performed using aluminum backed silica gel plates with a mobile phase of 50% methanol and 50% solution of 10% ammonium acetate in water. The plates were then dried and exposed on an autoradiographic phosphor plate to determine the presence of radiolabeled lipophilic species.
Data Analysis
Raw list mode emission data for each individual scan were binned into temporal frames of 4 × 1 minute, 3 × 2 minutes, and 16 × 5 minutes. Corrections for scanner deadtime and random coincidence events were performed. The sinograms were reconstructed using filtered back projection with a 0.5 cm−1 ramp filter and corrections were applied for attenuation, scatter, radioactive decay, and scanner normalization. Reconstructed voxel dimensions were 1.90 × 1.90 × 1.21 mm3 with a total matrix size of 128 × 128 × 63 voxels. Dynamic PET images for each subject were realigned into common space by using a rigid body transformation matrix calculated by SPM5 software (http://www.nitrc.org/projects/spm/) based upon the first six minutes of integrated data from each study. Time activity curves (TACs) were extracted by drawing circular regions of interest (ROIs) in the areas of the brain including the mesial temporal cortex (MTC), anterior cingulate gyrus (aCG), insula cortex (IC), raphe nuclei (RN) and cerebellum (CB).
A multilinear Logan reference region method was used to obtain an index of specific binding in the specified regions of the brain using the cerebellum as a reference region and a period of linearization t* of 40 minutes [9]. A value of 0.27 min−1 was used for k̄2 in all of the distribution volume ratio (DVR) estimates. DVR was converted to nondisplaceable binding potential (BPND = DVR − 1) which is the equilibrium ratio of specifically bound to nondisplaceable radioligand in tissue [10]. For visual comparison, parametric BPND images were generated at the voxel level using the same multilinear logan method as used above.
Results
Analytic identification of cis- and trans- tosyl mefway and mefway
Shown in figure 2 are the chromatographic spectra of the mefway standard. The MS spectrum reveals the presence of only a single mass peak of 455 daltons, along with the corresponding peaks containing fractions of 13C. The HPLC chromatogram illustrates the presence of two absorption peaks, corresponding to the trans- and cis- mefway forms, indicating the presence of an 84:16 mixture of trans- to cis- mefway.
Figure 2.

MS spectrum (left) and HPLC chromatogram (right) of the isomeric mixture of reference mefway standard. The magnified view of MS displays the main peak along with corresponding 13C peaks.
The analytic spectra for the isomerically separated tosyl mefway precursors are shown in Figure 3. LCMS performed on the isolated samples of trans-tosylate mefway and cis-tosylate mefway resulted in masses of 607 daltons for both tosylate mefway samples indicating there is no mass difference between the two samples. Also seen are mass fragments at approximately 420 daltons indicating a breakdown of compound during processing with identical fragments seen in both samples. Prior to the HPLC separation, the tosyl mefway contained a 64:36 mixture of trans- to cis- tosyl mefway. Following separation, the HPLC chromatograms in figure 3 reveal a greater than 99% isomeric purity for the isolated trans-tosyl mefway and greater than 98% for the isolated cis-tosyl mefway. The radiochemical labeling of 18F to the individual cis- and trans-mefway precursors resulted in isomeric radiochemical purities of 99.0% for trans-[18F]mefway and 98.4% for cis-[18F]mefway.
Figure 3.
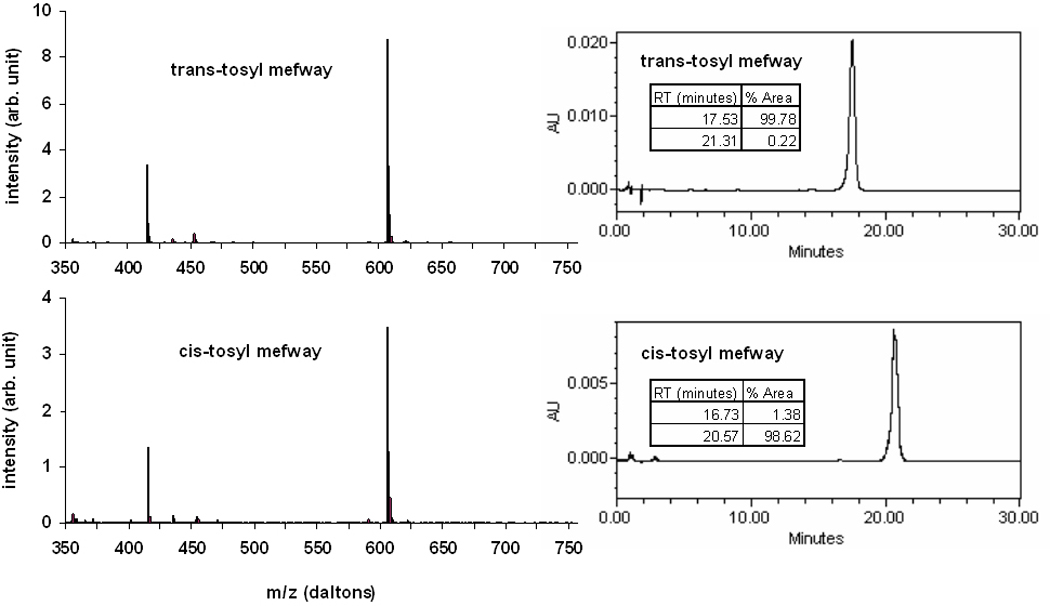
Isomeric validation of tosyl mefway. The left column shows the LCMS spectra for trans-(top) and cis-(bottom) tosyl mefway. The right column shows the corresponding HPLC chromatograms of the individual separated trans- and cis- tosyl mefway isomers.
Blood data
Venous blood draws were performed on the cis-[18F]mefway studies during the period of 30–90 minutes post-injection. The presence of parent compound, based upon the component in the ethyl acetate fraction, could be described by a single exponential function, with an average decay constant of 0.016 min−1 (0.014, 0.018 min−1). This is in close agreement with similar measures made on separate, same age subjects using trans-[18F]mefway, yielding a washout constant of 0.016 min−1 (0.017, 0.013, 0.018 min−1). The TLC performed on the ethyl acetate fraction showed only one radioactive peak which was consistent with the cis- [18F]mefway standard.
PET data
Cerebellar time-activity curves for cis- and trans- [18F]mefway are shown in Figure 4. The CB time course of the two isomers show close consistency. Following the passage of the bolus activity, there is a fast and a slow component in the clearance of the tracer from the CB. At time greater than 30 minutes, the clearance rates for each tracer were 0.012 min−1 (0.011, 0.014 min−1) for trans-[18F]mefway and 0.012min−1 (0.012, 0.013 min−1) for cis- [18F]mefway. Also shown in figure 4 are early (first 5 minutes) and late (≥45 minutes) integrated PET images in the region of the CB for both cis- and trans-[18F]mefway studies in one of the subjects. Significant binding of only the trans-[18F]mefway in the vermis of the cerebellum can be seen in the late image.
Figure 4.
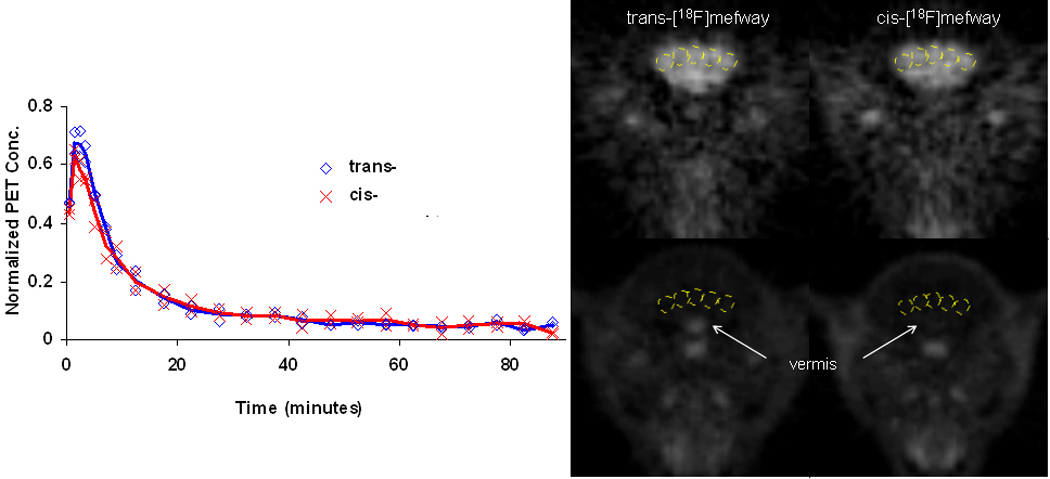
PET CB time course. Left CB time activity curves for trans-[18F]mefway ( ) and cis-[18F]mefway (
 ) averaged over the two studies in units of (kBq/cc/i.d. × kg)*100. Right CB regions of interest displayed on the early (0 – 5 minutes) (top row) and late (45 – 90 minutes) (bottom) PET images. The subject was injected with 118 MBq and 120 MBq of trans- and cis- [18F]mefway, respectively, and was pre-anesthetized for the scanning procedures with ketamine (15 mg/kg IM) and maintained with 0.75% – 1.5% isoflurane.
Consistent with our previous studies, elevated uptake of trans-[18F]mefway was detected across the cortical and midbrain regions. In comparison, only small amounts of uptake could be detected with cis-[18F]mefway. Figure 5 illustrates comparative time activity curves for cis- and trans- [18F]mefway in the MTC and IC. Also shown are target-to-CB ratio plots for the two radiotracers. A plateau of the curve is not reached in the MTC with trans-[18F]mefway, whereas cis- reaches a plateau of roughly 1.9 averaged across each monkey at approximately 10 minutes. An earlier plateau is reached in the IC with trans-[18F]mefway at a ratio of 6.7 after 60 minutes compared to 1.3 at 5 minutes for cis-[18F]mefway. Table 1 shows trans- and cis-[18F]mefway BPND estimates for the regions of the MTC, aCG, IC and RN, along with the ratio of BPND for the two radiotracers. Parametric BPND images of trans- and cis- [18F]mefway are shown in Figure 6 highlighting specific binding in the MTC. Elevated binding is evident with cis-[18F]mefway in this region, but at considerably lower levels than trans-[18F]mefway. Logan plots in the MTC of trans- and cis- [18F]mefway in one subject are shown in Figure 7.
Figure 5.
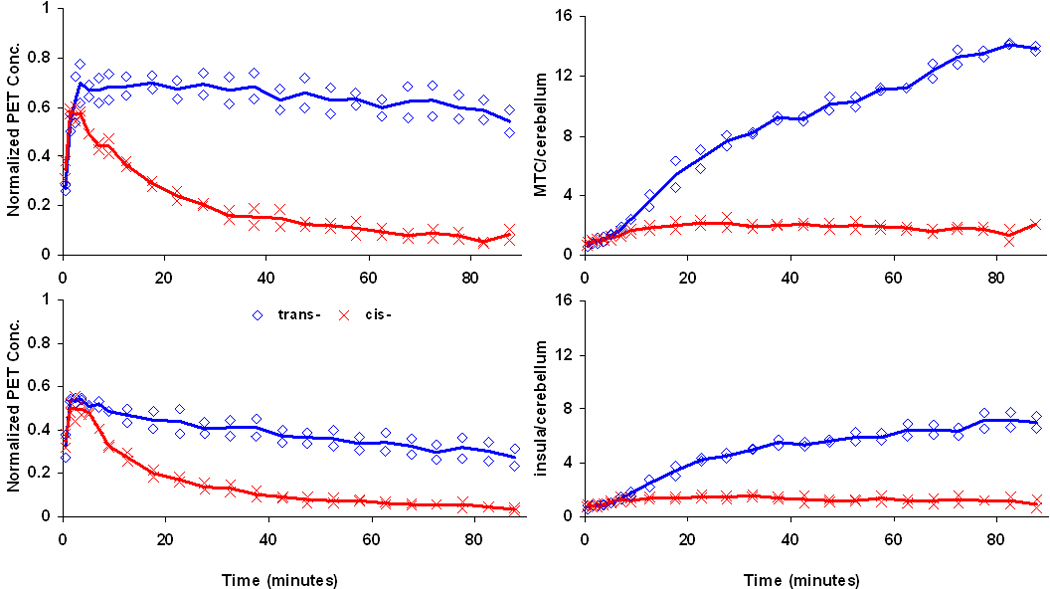
Left Time activity curves in the MTC (top) and IC (bottom) for trans-[18F]mefway ( ) and cis-[18F]mefway (
 ). The lines represent the average of the two subjects and are normalized to (kBq/cc/i.d. × kg)*100. Right Target to CB time course for the MTC (top) and IC (bottom). The CB data was modeled as a 2-exponential function for times greater than 5 minutes.
Table 1.
BPND estimates in the regions with specific 5-HT1A binding.
| Region | [F-18]mefway | M1 | M2 | Mean | Ratio |
|---|---|---|---|---|---|
| MTC | trans- | 8.14 | 7.25 | 7.70 | 13.2 |
| cis- | 0.46 | 0.71 | 0.58 | ||
| aCG | trans- | 5.13 | 4.77 | 4.95 | 15.5 |
| cis- | 0.22 | 0.42 | 0.32 | ||
| IC | trans- | 3.65 | 2.89 | 3.27 | 15.9 |
| cis- | 0.10 | 0.31 | 0.21 | ||
| RN | trans- | 2.88 | 3.23 | 3.05 | 23.7 |
| cis- | 0.07 | 0.19 | 0.13 |
Figure 6.
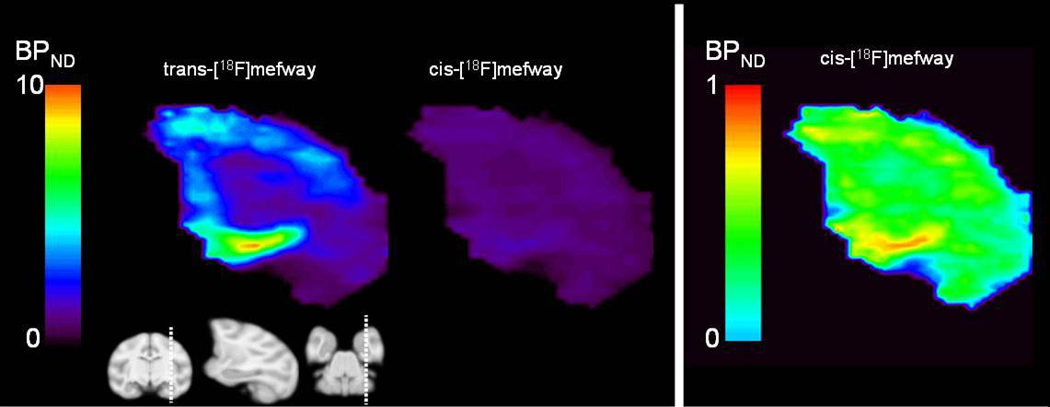
Left BPND PET images of trans-[18F]mefway and cis-[18F]mefway highlighting binding in the MTC in subject M2. The MRI illustrates the sagittal slice of the PET image. Right BPND image of cis-[18F]mefway with the threshold adjusted to enhance visualization of binding in the MTC. The subject was injected with 118 MBq and 120 MBq of trans- and cis- [18F]mefway, respectively, and was pre-anesthetized for the scanning procedures with ketamine (15 mg/kg IM) and maintained with 0.75% – 1.5% isoflurane.
Figure 7.
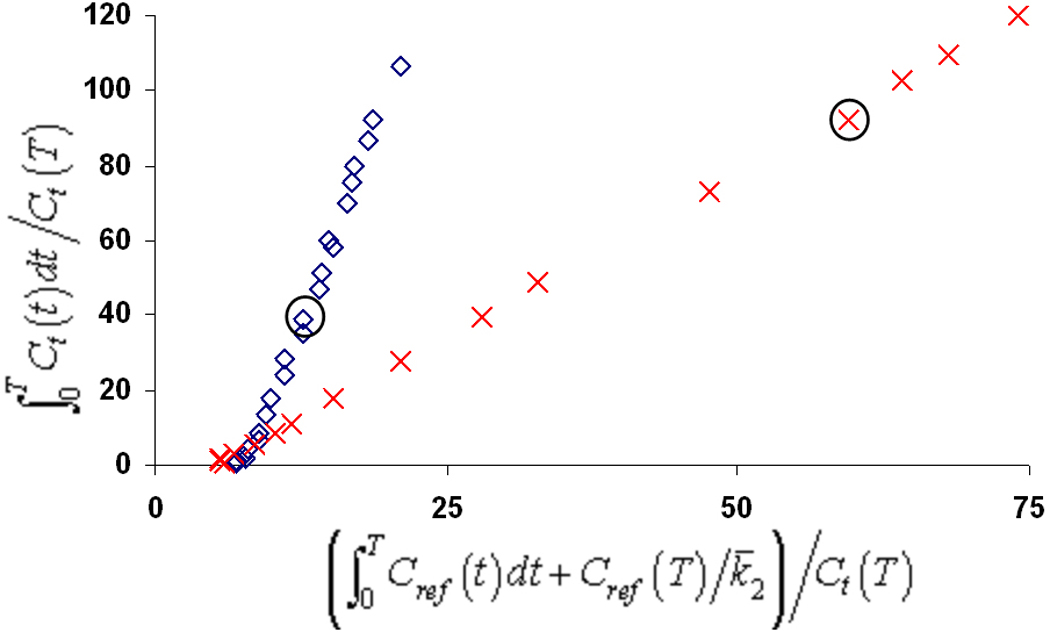
Logan DVR plots in the MTC for trans-[18F]mefway ( ) and cis-[18F]mefway (
 ) in one subject. The circles around the two points represent the 40 minute time points. To enhance the visualization of the trans-[18F]mefway plot, only the first 55 minutes of data was shown for cis-[18F]mefway to allow a scaling of the axis.
Discussion
Validation studies of trans-[18F]mefway in the nonhuman primate have demonstrated its high specificity for the 5-HT1A receptor site and favorable PET imaging properties, providing the neuroimaging community a valuable 18F labeled alternative to [11C]WAY100635 [3][4]. The reported BPND values were 7.4 ± 0.6 in the 5-HT1A receptor-rich region of the hippocampus (included in the MTC) and elevated specific binding in many of the temporal and frontal cortical regions in the brain. To provide a stable estimate of specific binding in the receptor rich regions of the brain, it was reported that approximately 90 minutes of dynamic PET data acquisition would be required to avoid flow dependent variations in BPND measurement. The motivation for exploring the use of cis-[18F]mefway as a biomarker for 5-HT1A binding was driven by the desire for a radiotracer with “faster” kinetics, permitting a shorter scanning session and making it a candidate ligand for measuring endogenous 5-HT competition. For example, under certain conditions a larger (i.e. faster) ligand-receptor dissociation constant (koff) may result in an earlier time of equilibration, and in turn, a shorter scanning period. The purpose of this investigation was to examine if cis-[18F]mefway would yield more rapid equilibration and retain a sufficiently large BPND value for PET research applications.
An isomeric mixture of cis- and trans- tosylate precursor was used as the starting material for these studies. The chromatographic separation of the cis- and trans-tosylate precursors provided high purity starting materials (> 98%) for radiochemistry of both radioligands. Following the radiochemical syntheses, only small amount of radiolabeled isomeric impurities could be detected, the formulated trans-[18F]mefway contained 1.0% cis-[18F]mefway and the formulated cis-[18F]mefway contained 1.6% trans-[18F]mefway. The effects of these impurities on interpreting our results are discussed below.
Venous blood samples were acquired for only the cis-[18F]mefway studies to provide an indication of the plasma concentration and the possible presence of radiolabeled metabolites. The clearance rate of radioligand from the venous plasma was found to be in close agreement with the measured clearance from previous trans-[18F]mefway studies (using venous samples) in separate subjects of similar age. TLC analysis performed on the cis-[18F]mefway ethyl acetate extractions revealed only one radioactive peak, which corresponded to the parent compound. Ma and colleagues reported extensive blood analysis on the cis- and trans- isomers of 3-[18F]FCWAY[11]. Using cynomolgus monkey hepatocytes, it was found the profile of radiolabeled metabolites were uniform between the isomeric compounds. Although similar studies would be required to fully characterize the metabolic profiles of cis- and trans-[18F]mefway, these preliminary data suggest the presence of radiolabeled metabolism will be comparable between them.
The PET data demonstrate close agreement in the transport of compounds across the blood-brain barrier. As seen in figure 4, the time course of cis-[18F]mefway and trans-[18F]mefway in the cerebellum are almost indistinguishable. Assuming only negligible cerebellar 5-HT1A binding and the similar time course of the radiotracers in the plasma, we can approximate equivalent nondisplaceble volumes of distribution (VND) for cis-[18F]mefway and trans-[18F]mefway. In the 5-HT1A receptor-rich regions of the brain, the time required for a plateau of the target to cerebellum ratio, i.e., psuedoequilibrium, was approximately 10 minutes in the highest binding region of the mesial temporal cortex, suggesting shorter PET scanning sessions could be used for cis-[18F]mefway assay of 5-HT1A binding. However, the level of specific binding was dramatically reduced compared to the trans-[18F]mefway measures and not detectable in low binding regions such as the cerebellar vermis (shown in figure 4). The ratio of cis- and trans-[18F]mefway BPND values was approximately 15 when averaged across the cortical regions reported in Table 1. These differences in specific binding of cis- and trans-compounds follow those reported for cis- and trans- 4-[18F]FCWAY and cis- and trans- 3-[18F]FCWAY, with ratios in hippocampal specific binding between isomers of 5 (trans-/cis-), and 3 (trans-/cis-), respectively, based upon biodistribution studies at 30 minutes in rats[12]. By assuming that both cis- and trans-[18F]mefway compounds target the identical receptor pool and have equal nonspecific binding in the brain, we can attribute this difference to the apparent (in vivo) equilibrium dissociation constant, KD. Measures of apparent KD have not been made for cis- or trans-[18F]mefway. Comparative studies in nonhuman primates suggest the apparent KD of trans-[18F]mefway is of the same order as [11C]WAY100635, which is approximately 1 nM based on data reported by Farde et al. [13], which would scale to an estimate of 10–20 nM for cis-[18F]mefway [4].
Given the low levels of specific binding of the cis-[18F]mefway studies, we cannot discount the presence of the 1.6% trans-[18F]mefway contamination on the estimated BPND. Scaling the BPND from the trans-[18F]mefway studies would result in a BPND contribution of 7.7*(1.6%) = 0.12 in the MTC due to the this compound in the cis-[18F]mefway studies. Thus, this radiochemical impurity in the cis-[18F]mefway studies may contribute to a fractional component of the binding measure (0.12/0.58 = 21% in MTC), however, it cannot discount the presence of measurable cis-[18F]mefway specific binding. There is also the possibility that a metabolite of trans- or cis- [18F]mefway, trans- or cis- [18F]fluoromethylcyclohexanecarboxylic acid, may confound the estimate of BPND. Carson et al. closely examined the effect of the analogous [18F]FCWAY metabolite, [18F]fluorocyclohexanecarboxylic acid on measures of binding in the rhesus monkey[14]. Direct injection of [18F]fluorocyclohexanecarboxylic acid revealed a rapid defluorination and subsequent accumulation of the 18F radiolabel in the bone, which was found to bias the measure of uptake in the neighboring tissue. The experiments reported herein were not sensitive to detecting low levels of uptake in the bone and made no attempt to account for their potential presence.
Conclusion
The in vivo behavior of cis-[18F]mefway was compared with trans-[18F]mefway in nonhuman primates to investigate its potential as a PET marker of 5-HT1A receptors. While the time required for PET 5-HT1A binding assay is short for cis-[18F]mefway compared to trans-[18F]mefway, the low target to cerebellar ratios severely limit its use in brain regions outside the MTC. It is possible that cis-[18F]mefway could have utility for measuring endogenous 5-HT competition in the MTC, however, additional validation and further metabolite analysis studies are required for such an application.
Acknowledgments
The authors would like to thank the following for their contributions to this research: Jonathan Engle and Professor R. Jerry Nickles for assistance with isotope production; Elizabeth Ahlers, Maxim Slesarev and Julie Larson for data acquisition and processing; the staff at the Harlow Center for Biological Psychology at the University of Wisconsin (RR000167) for nonhuman primate handling. This work was supported by NIH grants AA017706, MH086014, AG030524, AA12277 and T32CA009206.
Footnotes
Publisher's Disclaimer: This is a PDF file of an unedited manuscript that has been accepted for publication. As a service to our customers we are providing this early version of the manuscript. The manuscript will undergo copyediting, typesetting, and review of the resulting proof before it is published in its final citable form. Please note that during the production process errors may be discovered which could affect the content, and all legal disclaimers that apply to the journal pertain.
Contributor Information
Dustin Wooten, Departments of Medical Physics, Kinesiology, Waisman Laboratory for Brain Imaging and Behavior, University of Wisconsin-Madison.
Ansel Hillmer, Departments of Medical Physics, Kinesiology, Waisman Laboratory for Brain Imaging and Behavior, University of Wisconsin-Madison.
Dhanabalan Murali, Departments of Medical Physics, Kinesiology, Waisman Laboratory for Brain Imaging and Behavior, University of Wisconsin-Madison.
Todd Barnhart, Departments of Medical Physics, Kinesiology, Waisman Laboratory for Brain Imaging and Behavior, University of Wisconsin-Madison.
Mary L. Schneider, Departments of Medical Physics, Kinesiology, Waisman Laboratory for Brain Imaging and Behavior, University of Wisconsin-Madison
Jogeshwar Mukherjee, Preclinical Imaging Center, Department of Psychiatry and Human Behavior, University of California-Irvine.
Bradley T. Christian, Departments of Medical Physics, Kinesiology, Waisman Laboratory for Brain Imaging and Behavior, University of Wisconsin-Madison
References
- 1.Pike VW, Halldin C, Wikström H, Marchais S, McCarron JA, Sandell J, et al. Radioligands for the study of brain 5-HT1A receptors in vivo–development of some new analogues of WAY. Nucl. Med. Biol. 2000;vol. 27:449–455. doi: 10.1016/s0969-8051(00)00110-4. [DOI] [PubMed] [Google Scholar]
- 2.Rabiner EA, Messa C, Sargent PA, Husted-Kjaer K, Montgomery A, Lawrence AD, et al. A Database of [11C]WAY-100635 Binding to 5-HT1A receptors in normal male volunteers: normative data and relationship to methodological, demographic, physiological, and behavioral variables. NeuroImage. 2002;vol. 15:620–632. doi: 10.1006/nimg.2001.0984. [DOI] [PubMed] [Google Scholar]
- 3.Saigal N, Pichika R, Easwaramoothy B, Collins D, Christian BT, Shi B, et al. Synthesis and biologic evaluation of a novel serotonin 5-HT1A receptor radioligand, 18F-labeled mefway, in rodents and imaging by PET in a nonhuman primate. J. Nucl. Med. 2006 Oct.vol. 47(no. 10):1697–1706. [PubMed] [Google Scholar]
- 4.Wooten D, Moraino J, Hillmer A, Engle J, DeJesus OT, Murali D, et al. In vivo kinetics of [18F]MEFWAY: A comparison with [11C]WAY100635 and [18F]MPPF in the nonhuman primate. Synapse. 2011 doi: 10.1002/syn.20878. In Press, online version: ( http://onlinelibrary.wiley.com/doi/10.1002/syn.20878/full). [DOI] [PMC free article] [PubMed] [Google Scholar]
- 5.Lang L, Jagoda E, Schmall B, Sassaman M, Ma Y, Eckelman WC. Fluoro analogs of WAY-100635 with varying pharmacokinetics properties. Nucl. Med. Biol. 2000;vol. 27:457–462. doi: 10.1016/s0969-8051(00)00111-6. [DOI] [PubMed] [Google Scholar]
- 6.Lang L, Jagoda E, Schmall B, Sassaman M, Magata Y, Eckelman WC. Comparison of 18F labeled cis and trans 4-fluorocyclohexane derivatives of WAY 100635. J. Nucl. Med. 1999;vol. 40:37P–38P. [Google Scholar]
- 7.Saigal N, Pichika R, Easwaramoorthy B, Mukherjee J. Serotonin competition with the new 5-HT1A receptor PET radiotracer: [18F]-mefway. J. Nucl. Med. 2006;vol. 47:281P. [PubMed] [Google Scholar]
- 8.Tai YC, Chatziioanno A, Siegel S, Young J, Newport D, Goble RN, et al. Performance evaluation of the microPET P4: a PET system dedicated to animal imaging. Phys. Med. Biol. 2001;vol. 46:1845–1862. doi: 10.1088/0031-9155/46/7/308. [DOI] [PubMed] [Google Scholar]
- 9.Logan J, Fowler JS, Volkow ND, Wang GJ, Ding YS, Alexoff DL. Distribution volume ratios without blood sampling from graphical analysis of PET data. J. Cereb. Blood Flow Metab. 1996;vol. 16(no. 5):834–840. doi: 10.1097/00004647-199609000-00008. [DOI] [PubMed] [Google Scholar]
- 10.Innis RB, Cunningham VJ, Delforge J, Fujita M, Gjedde A, Gunn RN, et al. Consensus nomenclature for in vivo imaging of reversibly binding radioligands. J Cereb Blood Flow Metab. 2007;vol. 27:1533–1539. doi: 10.1038/sj.jcbfm.9600493. [DOI] [PubMed] [Google Scholar]
- 11.Ma Y, Lang L, Kiesewetter D, Jagoda E, Eckelman WC. Species differences in metabolites of PET ligands: serotonergic 5-HT1A receptor antagonists 3-trans-FCWAY and 3-cis-FCWAY. Nucl. Med. Biol. 2006;vol. 33:1013–1019. doi: 10.1016/j.nucmedbio.2006.09.006. [DOI] [PubMed] [Google Scholar]
- 12.Lang L, Jagoda E, Ma Y, Sassaman MB, Eckelman WC. Synthesis and in vivo biodistribution of F-18 labeled 3-cis-,3-trans-, 4-cis-, and 4-trans-Fluorocyclohexane derivatives of WAY 100635. Bioorg. Med. Chem. 2006;vol. 14:3737–3748. doi: 10.1016/j.bmc.2006.01.064. [DOI] [PubMed] [Google Scholar]
- 13.Farde L, Ginovart N, Ito H, Lundkvist C, Pike VW, McCarron JA, et al. PET-characterization of [carbonyl-11C]WAY-100635 binding to 5-HT1A receptors in the primate brain. Psychopharmacol. 1997;vol. 133:196–202. doi: 10.1007/s002130050391. [DOI] [PubMed] [Google Scholar]
- 14.Carson RE, Lang L, Watabe H, Der MG, Adams HR, Jagoda E, et al. PET Evaluation of [18F]FCWAY, an Analog of the 5-HT1A Receptor Antagonist, WAY-100635. Nucl. Med. & Biol. 2000;vol. 27:493–497. doi: 10.1016/s0969-8051(00)00118-9. [DOI] [PubMed] [Google Scholar]


