

Abstract
An acute injection of brain-derived neurotrophic factor (BDNF) in the hypothalamic ventromedial nucleus (VMN) decreases body weight by reducing feeding and increasing energy expenditure (EE) in animals on standard laboratory chow. Animals have divergent responses to high fat diet (HFD) exposure, with some developing obesity and others remaining lean. In the current study we tested the hypothesis that BDNF in the VMN reduces HFD-induced obesity. Seventy-two 10-week old rats were allowed HFD ad libitum for 8 weeks and then prepared with bilateral VMN cannulae. Animals were then divided into tertiles based on their fat mass rank: high, intermediate and low (H, I, & L). Each group was further divided into 2 subgroups: BDNF (1 μg) or control (artificial cerebrospinal fluid, aCSF); then injected every other day for 20 days according to subgroup. Energy intake, body weight and body composition were measured. Other metabolic indices were measured before and after treatment. In parallel, another 12 rats were fed control diet (CD), VMN-cannulated and injected with aCSF. HFD exposure induced obesity in the H group, with a significant increase in energy intake, body weight, fat mass, liver size and serum glucose, insulin and leptin. BDNF significantly reduced body weight and fat mass in all phenotypes; while it reduced energy intake only in the I group. However, BDNF increased EE, spontaneous physical activity and fat oxidation in the H group, suggesting that BDNF-induced EE elevation contributed to reduction of body weight and fat mass. Chronic VMN BDNF reduced insulin elevation and/or reversed hyperleptinemia. These data suggest that the VMN is an important site of action for BDNF reduction of HFD-induced obesity.
Keywords: energy intake, energy expenditure, spontaneous physical activity, fat mass
Introduction
Brain derived neurotrophic factor (BDNF) plays an important role in regulating energy balance. BDNF heterozygous mutant mice (Pelleymounter et al., 1995), (Kernie et al., 2000) and animals with disruption of the regulatory locus of the BDNF gene (Sha et al., 2007) exhibit hyperphagia, increased body weight and adiposity. Human patients with mutations in the BDNF gene (Gray et al., 2006, Han et al., 2008), and the BDNF receptor (TrkB) signal transduction pathway (Gray et al., 2007) also exhibit obesity. Intracerebroventricular (ICV) injection of BDNF reduces energy intake and body weight (Pelleymounter et al., 1995), and reverses the hyperphagic and obese phenotype of BDNF heterozygous mutant mice (Kernie et al., 2000). Our recent studies have identified the paraventricular nucleus (PVN) and ventromedial nucleus of hypothalamus (VMN) as important sites where acute BDNF significantly decreased body weight gain by reducing feeding (Wang et al., 2007b) (Wang et al., 2007c) and increasing energy expenditure (EE) (Wang et al., 2007a, Wang et al., 2010a). In this study we choose the VMN as one of the most sensitive sites to determine if BDNF in VMN could protect against high fat diet (HFD) induced obesity.
The VMN is a brain area important to the regulation of energy metabolism. Several neuropeptides acting in the VMN have been reported to regulate energy balance, including neuropeptide Y (Jolicoeur et al., 1995), ghrelin (Solomon et al., 2006), leptin (Jacob et al., 1997, Bagnasco et al., 2003, Ambati et al., 2009), glucagon-like peptide 1(Schick et al., 2003), CCK (Takaki et al., 1990), insulin (Strubbe and Mein, 1977), urocortin (Ohata et al., 2000) and CRH receptors (Hashimoto et al., 2004). Both mRNA and protein for BDNF and its receptor TrkB have also been identified in the VMN (Wetmore et al., 1990, Conner et al., 1997, Yan et al., 1997, Kernie et al., 2000). Several peptides have been found to control the expression and activity of BDNF in the VMN. BDNF may be a downstream effector of melanocortins as its expression in the VMN is increased by melanocortins (Xu et al., 2003). Leptin induces BDNF mRNA and protein expression in the dorsomedial VMN (Komori et al., 2006). Steroidogenic factor-1 (SF-1), which co-localizes with BDNF in VMN neurons, activates BDNF promoters (Tran et al., 2006), and SF-1 deficiency results in low VMN BDNF levels (Tran et al., 2006) as well as obesity (Zhao et al., 2004). Selective deletion of BDNF in the VMN results in hyperphagia and obesity (Unger et al., 2007), while viral vector gene delivery of BDNF reduces feeding and adiposity in animal models (Cao et al., 2009). Our previous study of VMN BDNF (Wang et al., 2007c, Wang et al., 2010a) also suggests the VMN to be an important site of BDNF action.
Over-consuming calories, as with a calorie dense high fat diet (HFD), may contribute to the current obesity epidemic (Dreon et al., 1988). Laboratory animals fed a HFD become obese (Ghibaudi et al., 2002),(Gao et al., 2002) and have high levels of blood glucose, insulin and leptin (Gao et al., 2002, Ghibaudi et al., 2002), similar to that described in BDNF mutant mice (Sha et al., 2007). Low levels of blood BDNF in obese patients have been reported in several studies (El-Gharbawy et al., 2006) (Araya et al., 2008) (Geroldi et al., 2006), and a HFD may decrease BDNF protein levels in the central nervous system (Wu et al., 2003, Wu et al., 2006). These data suggest that reduced BDNF may be associated with adverse metabolic consequences.
Susceptibility for diet-induced obesity differs greatly among populations. Our recent work (Wang et al., 2010b) and that of others (Levin et al., 1986, Levin et al., 1989) (Gao et al., 2002, Ghibaudi et al., 2002) indicate a large variation in body weight and fat mass gain in Sprague Dawley (SD) rats after exposure to a HFD. The animals that become obese are defined as diet-induced obese (DIO), while those with a very small change in body weight and fat mass are defined as obesity (diet) resistant (DR). DIO and DR rats differ metabolically and physiologically. Compared to DR rats, DIO animals show increased hypothalamic mRNA for NPY and AgRP (Gao et al., 2002), reduced leptin receptor (Clegg et al., 2005) and binding of labeled leptin (Irani et al., 2007), decreased sensitivity to leptin (Levin and Dunn-Meynell, 2002) and urocortin 2 (a member of CRH family) (Cottone et al., 2007), significantly increased number of inhibitory inputs in the POMC neurons and reduced POMC cells synapses (Horvath et al., 2010), lower baseline and orexin A-induced spontaneous physical activity (SPA), and lower mRNA for orexin 2 receptor (Teske et al., 2006).
In the current study, we hypothesized that administration of BDNF in the VMN would reduce HFD-induced obesity by reducing energy intake and increasing EE. We also tested the hypothesis that DIO and DR animals may respond differentially to BDNF treatment. To test these hypotheses, we first induced obesity in SD rats by feeding them a HFD for 11 weeks, and then divided the animals into 3 groups based on their fat mass (high, intermediate and low). Next, we chronically administered BDNF or a vehicle of artificial cerebrospinal fluid (aCSF) into the VMN of 2 subgroups of each phenotype and measured energy intake, EE, body weight, and body composition. Serum metabolic indices were measured before and after the drug intervention; and at the end of the study, visceral fat mass and liver mass were also determined. The data show that BDNF in the VMN reduces HFD-induced obesity and related metabolic and physiologic effects, and that DIO rats did not show greater response to BDNF than other phenotype animals.
METHODS
Animals
Eighty-four male SD rats (Charles River, Wilmington, MA) weighing 225–250 g were housed individually in cages with a 12 h light/12 h dark photo-cycle (lights on at 07:00) in a room at 21–22 °C. Teklad lab chow and water were allowed ad libitum; energy intake and body weight were measured 3 times a week, and body composition was measured with an EchoMRI-700 (Houston, TX) immediately upon arrival, and before starting the new diet. The protocol was approved by the Veterans Affairs Medical Center and University of Minnesota Institutional Animal Care and Use Committee. An overview of the study design is shown in Fig. 1.
Figure 1.

Flow chart of the study design as described in the Method section. Since 3 rats on the high fat diet died after cannulation surgery and one rat on control diet died during the phase of pre-intervention, in real study there were 10 rats in LC, 11 rats in L-BDNF, and 11 rats in the control diet group.
Dietary regimes
Twelve days after arriving in the animal care facility, the rats were ranked by fat mass. Every fourth-ranked rat in each consecutive 7 rankings was assigned to the control diet (CD, D12450B from Research Diets, New Brunswick, NJ; Table 1, N= 12) and the other 72 rats were assigned to the HFD (45% of fat, D12451 from Research Diets, New Brunswick, NJ, Table 1). Table 2 shows almost identical body weight, body composition and energy intake of both groups prior to receiving the new diets. All animals remained on the assigned diet until the terminal experiment. During the feeding period, energy intake and body weight were measured 3 times per week and body composition was measured twice per week. These data are presented in the Results section. One animal in the CD group died of illness, and his data were eliminated. At the end of week 8, blood was drawn from the tails of all animals.
Table 1.
Comparison between control diet and high fat diet
| Control diet (D12450B) | High fat diet (D12451) | |||
|---|---|---|---|---|
| g% | Kcal% | g% | Kcal% | |
| Protein | 19.2 | 20 | 24 | 20 |
| Carbohydrate | 67.3 | 70 | 41 | 35 |
| Fat | 4.3 | 10 | 24 | 45 |
| Kcal/kg | 3.85 | 4.73 | ||
Table 2.
Body measurement and energy intake in the prospective control diet and high-fat diet groups prior to the new dietary regimes.
| Control diet group* (mean ± SE) | High fat diet group (mean ± SE) | |
|---|---|---|
| Body weight (g) | 332.7 ± 5.1 | 330.2 ± 2.0 |
| 14-day Body weight change (g) | 130.5 ± 4.9 | 129.4 ± 1.8 |
| 14-day food intake (Kcal) | 1298.8 ± 22.7 | 1320.0 ± 9.7 |
| Body fat (g) | 37.2 ± 1.6 | 35.9 ± 0.5 |
| 14-day body fat change (g) | 12.3 ± 0.8 | 11.9 ± 0.3 |
| Relative body fat (%) | 11.2 ± 0.4 | 10.9 ± 0.1 |
| Lean mass (g) | 256.9 ± 4.0 | 256.9 ± 1.4 |
| Relative lean mass (%) | 77.2 ± 0.4 | 78.2 ± 0.5 |
After ranking fat mass among the 84 rats, we assigned animals with ranking number 4, 11, 18, 25, 32, 39, 46, 53, 60, 67, 74, and 81 to the control diet (CD) group; the rest of the rats were assigned to the high fat diet (HFD) group.
Cannulation and Verification of Placement
At the beginning of week 9 of the CD/HFD, all animals were bilaterally cannulated in the VMN. The rats were first anesthetized with intramuscular injections of Xylazine at 3.5 mg/kg and Ketamine at 20 mg/kg and were fitted with a 28-gauge stainless steel guide cannula placed just above the VMN bilaterally. Stereotaxic coordinates were determined from the rat brain atlas of Paxinos and Watson (Paxinos and Watson, 1998) and are as follows: 0.6 mm lateral and 2.6 mm posterior to bregma, and 8.4 mm below the skull surface. The injector extended 1 mm further than the end of the guide cannula. The animals were given at least one week to recover following surgery. During this period, the animals were handled daily and received sham injections to reduce possible stress during the formal injections.
At the end of study, the rats were decapitated and whole brain tissue was taken for histological examination. The brain tissue was sectioned with a cryostat at a thickness of 40 μm and mounted on gelatin-coated slides. All slides were stained with 0.1% thionin and treated with ethanol (from 10% to 100%) and Clearing Agent (Electron Microscopy Sciences, Hatfield, PA). After the slides were air dried, injection placement was determined microscopically at 10x, using the brain atlas of Paxinos and Watson (Paxinos and Watson, 1998) as a reference. A cannula was deemed correct if the histological examination indicated that the injection was within a 0.25 mm radius from the targeted site. Data from animals with misplaced cannulae were excluded from the data analysis. In this study, sixteen animals were excluded from the statistical analysis due to incorrect cannula placement. We also compared the misplaced aCSF-treated rats with misplaced BDNF-treated rats in each phenotype, and there were no statistical differences in energy intake, change of body weight and fat mass between the two treatments in each phenotype.
Body composition
An EchoMRI-700 (Houston, TX) was used to measure fat mass, lean mass, free water and total water. Each animal was weighed and then placed into one of the plastic holders based on their body weight with limited restraint. Then the holder was placed in the EchoMRI machine for scanning. Each scan took 1–2 minutes. The fat mass and lean mass measured with the MRI is consistent with those chemically analyzed, with an almost 1:1 correlation (Nixon et al., 2010).
Assignment of HFD-fed rats into 3 groups
Our recent experience and other publications (Gao et al., 2002, Ghibaudi et al., 2002) indicate a large variation in feeding and body weight gain among SD rats on a HFD. After 11 weeks on the HFD, we found a similar pattern among the 69 rats on HFD (three rats died of cannulation surgery): a range of 66 – 216 g of fat mass and a range of 479 – 777 g of body weight.
After the animals recovered from cannulation (at the end of week 11), the HFD rats were ranked based on their fat mass, with the top 24 assigned to the high fat mass (H) group, the middle 24 assigned to the intermediate fat mass (I) group and the bottom 21 assigned to the low fat mass (L) group. The rationale for distributing the rats among groups according to fat mass (vs. body weight) is derived from the idea that fat mass is more metabolically critical than body weight in disorders related to obesity. In support of this rationale, fat mass changes after exposure to HFD were more robust than body weight changes. As indicated in the Results section, a statistically significant body weight increase (as compared with the CD group (Fig. 2a)) occurred after 4 weeks of the HFD, while a significant fat mass increase occurred only on day 3 of the HFD (Fig. 2b).
Figure 2.
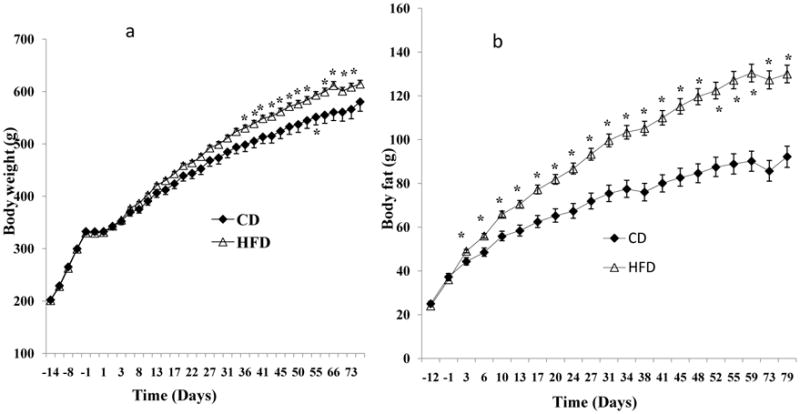
Comparisons between animals fed the high fat diet (HFD) and animals fed the control diet (CD) for 11 weeks. a: The HFD group had a significant increase in body weight after about 4-weeks of the HFD compared to the CD rats. b: The HFD group increased their fat mass by day 3, and they had more than 40% increase in fat mass of the CD rats.
Within each group, the rats were further divided into 2 subgroups (12 rats/subgroup for H and I groups, and 10~11 rats/subgroup for L group) with even body weight and fat mass distribution. Table 3 shows no statistical differences in body measurements between any 2 corresponding subgroups. One subgroup was assigned the aCSF treatment and the other was assigned the BDNF treatment (1.0 μg). These divisions then formed 6 subgroups as follows: H-aCSF (HC), H-BDNF, I-aCSF (IC), I-BDNF, L-aCSF (LC) and L-BDNF. For the CD group, all rats were assigned to aCSF treatment and defined as CD-C.
Table 3.
Body measurements from animals on control diet or high fat diet prior to the drug intervention.
| High fat diet* | Control diet | ||||||
|---|---|---|---|---|---|---|---|
| H# | I# | L# | |||||
| aCSF | BDNF | aCSF | BDNF | aCSF | BDNF | aCSF | |
| Body weight (g) | 651.0 ± 11.1 | 660.1 ± 16.5 | 595.7 ± 15.9 | 600.3 ± 14.3 | 568.7 ± 14.3 | 565.0 ± 14.5 | 566.0 ± 18.1 |
| Body fat (g) | 164.9 ± 6.0 | 167.3 ± 6.4 | 120.2 ± 2.1 | 120.4 ± 2.3 | 91.1 ± 4.2 | 90.8 ± 4.4 | 85.6 ± 4.9 |
| Lean mass (g) | 412.7 ± 9.0 | 416.1 ± 10.2 | 403.3 ± 12.6 | 408.1 ± 11.2 | 404.7 ± 11.1 | 402.5 ± 10.2 | 407.0 ± 13.0 |
| Relative fat mass (%)Δ | 25.4± 0.9 | 25.3 ± 0.6 | 20.3 ± 0.5 | 20.1 ± 0.4 | 16.0 ± 0.7 | 16.0 ± 0.6 | 15.1 ± 0.7 |
| Relative lean mass (%)¥ | 63.4 ± 0.7 | 67.6 ± 0.4 | 65.0 ± 0.4 | 67.9 ± 0.4 | 71.1 ± 0.7 | 71.3 ± 0.6 | 71.9 ± 0.6 |
: Rats ranked in the top 24, intermediate 24 and lowest 21 based on body fat were assigned to high (H), intermediate (I), and low (L) body fat groups, respectively.
Animals in each group were further subdivided into two subgroups (12 rats/subgroup for H and L group, and 10–11 rats/subgroup for L group; aCSF or BDNF, 1 μg) with body fat level evenly distributed among subgroups. There were no significant differences between aCSF and BDNF subgroups in H, I and L groups. H: high body fat; I: intermediate body fat; L: low body fat. There is no significant difference in any measurements between aCSF and BDNF subgroups in H, I and L groups. H: high body fat; I: intermediate body fat; L: low body fat. There is no significant difference in any measurements between aCSF and BDNF subgroups in H, I and L groups.
Relative fat mass= fat mass/body weight × 100%;
Relative lean mass = lean mass/body weight × 100%.
Drugs
BDNF was kindly provided by Regeneron Pharmaceuticals Inc. (Tarrytown, NY), and stored at −80°C in 10 mg/ml of 150 mM NaCl, 10 mM NaHPO3 buffer and 0.004% Tween-20 until use. Just before use, the BDNF was diluted with aCSF. The dose of 1 μg was selected based on a pilot experiment showing that 1 μg of BDNF reduced feeding, fat mass and body weight in rats fed with a HFD. Our previous studies indicate that BDNF in the VMN in the dose range of 0.5–3 μg does not induce taste aversion (Wang et al., 2007b), suggesting that BDNF-inhibited feeding is not due to BDNF-induced malaise at this dose.
Injections
A volume of 0.5 μl was injected slowly over 30 sec, with the injector left in place at least 15 sec to ensure extrusion from the tip and to minimize distribution of the drug up the cannula tract. In total, animals received 10 injections and the injection sites were examined by light microscopy for tissue damage. Our previous observations indicate that repeated injection of BDNF does not induce gliosis (Wang et al., 2007a).
Experimental protocols
1) Feeding experiment
Starting at week 12, all animals were injected with aCSF or BDNF at 12:30 – 14:30 every other day for a total of 10 injections. Body weight and body composition were measured every other day in correspondence with the day of injection, while food intake was measured daily.
2) EE experiment
Each animal from the H group was tested once for EE using indirect calorimetry. Only one phenotype was chosen because of limited equipment resources, and this particular phenotype was chosen because they potentially developed DIO. Three animals from both the HC and H-BDNF subgroups were randomly tested in each experimental day. Detailed procedures for this are as described in a previous study (Wang et al., 2007a). In brief, twenty-four-h EE was measured using a customized, high-precision, single-chamber indirect calorimeter (Columbus Instruments; Columbus, OH). Before each measurement, the calorimeter was calibrated using a primary gas standard. Each rat was allowed to acclimate in a 58 L, 41.9 × 41.9 × 33 cm square chamber in the testing area for 3 days prior to testing. Between 09:30 h and 10:30 h on the testing day, the animals were injected with 1.0 μg BDNF or aCSF and then remained in the chamber for an additional 24 h. The timing of the gas measurements was as follows: reference air was allowed to “settle” for 120 sec, and then measured for 60 sec. This was followed by a period in which cage air was allowed to settle for 120 sec, and then measured for 15 sec in each epoch for 220 epochs. This measurement protocol was repeated every 60 min. The indirect calorimetry measured O2 consumption, CO2 production and heat production. Heat production was calculated based on the following equation: EE = (3.815 + 1.232 × RER) × VO2). O2 consumption and heat production were normalized according to metabolic body weight (kg0.75).
During EE measures, the levels of spontaneous physical activity (SPA, horizontal and vertical movement) were recorded using customized, high-precision racks of infrared activity sensors (Med Associates, St. Albans, VT) placed around the indirect calorimeter. Three 16-beam infrared arrays with two arrays in the “X” direction and one elevated “X” array measured ambulation and vertical movement. An activity unit was recorded and time stamped each time a beam was interrupted, and therefore, movement was simultaneously detected in all three axes (Teske and Kotz, 2009). We measured several types of activity: distance traveled, ambulatory movement, time spent in ambulation, vertical (rearing or standing on two limbs) and stereotypic movement (small movements, including grooming/feeding), and ambulatory episodes (the number of times movement was initiated). The total SPA counts (tSPA) and the time spent in SPA (TimeSPA) were calculated as the sum of ambulatory and vertical beam breaks and sum of time spent in both activities, respectively. If there were zero SPA counts during a 15 sec epoch, the status in this period was defined as resting; otherwise, the status was defined as SPA. EE during resting (rEE), EE during SPA (aEE) and total EE (tEE, sum of rEE and aEE) within each hour and 24-h period as well as the duration of resting (min) in each hour and 24-h period were calculated. The 24-h mean resting metabolic rate (mRMR) was defined as 24-h total rEE divided by total resting time (min). All of the above metabolic measurements and calculations (except SPA) were normalized according to metabolic body weight (kg0.75). The respiratory exchange ratio (RER) was measured during the entire period.
The work performed in ambulation was also measured to determine whether excess body weight might impair movement and affect work performed We use the formula W = K m V T cosθ (Cavagna et al., 1963, Chuang et al., 2001, Carter et al., 2003) in calculating the work of ambulating in rodents. Here K is the work coefficient in kcal/kg/km; m is body mass (kg); V is the ambulatory velocity; T is the ambulatory period; and θ is the angle of the incline. The angle of the incline is zero on level ambulating. K is nearly constant when ambulatory speed for HC and H-BDNF rats is statistically not different (27.58 ± 0.87 cm/s for H-BDNF and 27.24 ± 0.22 cm/s for HC, P = 0.724). Thus, the work of ambulating on a horizontal level equals the product of distance ambulated (m) and body weight (kg).
3) Terminal experiment
The terminal experiment was performed 44–48 h after the last injection. Food was removed at 7:30–8:00 am, and energy intake, body weight and body composition were measured before sacrifice. Between 10:30 am and 12:30 pm the animals were decapitated in a rotating treatment order to reduce the effect of time on the endpoint measures. Perirenal white adipose tissue (pWAT), epididymal white adipose tissue (eWAT) and the liver were collected and weighed. Brain tissue was taken to determine cannula placement.
4) Serum metabolic measurements
Blood was collected at two time points for the metabolic analyses of serum glucose, insulin, and leptin. At the beginning of week 9, 1–2 ml of blood was collected through tail snips from animals that were anesthetized with isoflurane. During the terminal study, blood samples were collected and stored in vials for 30 min, centrifuged for 15 min at 1000x g, and the serum was aliquoted and stored in −80 C. All metabolic indices were measured with either polyclonal or monoclonal antibodies that utilize enzymatic reactions to produce a color response proportional to the amount of protein in the sample. Using the QuantiChrom Glucose Assay Kit (Hayward, CA), our test showed a very high correlation between the standard glucose concentrations and absorbance at OD620 nm (R2 = 0.9978). Serum insulin and leptin had correlations of R2 = 0.9999 and R2 = 0.9991, respectively, at OD450 nm using EIA kits from Alpco Diagnostics (Salem, NH). All assays were performed according to the protocols provided by the manufacturers, and these assay kits were used in scientific publications (Montez et al., 2005), (Gandhi et al., 2005), (Kevorkova et al., 2007). By analyzing samples before and after treatment, we were able to determine if BDNF prevents or reverses elevation of these metabolic indices.
6) Liver histology
Several lobes of the liver were removed from each animal and placed into liquid nitrogen and then into a −80 °C freezer. A small portion of these tissue samples was cut and embedded with pre-cooled O.C.T. Compound (Torrance, CA) for cryostat sectioning at 40 microns. The sections were mounted on Fisher’s SuperFrost Plus slides. The sections were postfixed with a 10% formalin solution for 2–3 minutes, rinsed 3 times with PBS while shaking for 5 minutes, and stained with Hematoxylin and Eosin (H&E) as described (Wang et al., 2010b). Another set of slides were stained in Oil Red O, after post-fixing, using the following protocol: rinse with 60% isopropanol, stain with Oil Red O for 15 minutes, rinse again with 60% isopropanol, lightly stain nuclei with a few dips in Hematoxylin, rinse with water and mount a cover slip.
7) Statistical Analyses
For data collected during the first 11 weeks (pre-BDNF treatment), one-factor (diet) ANOVA was used to compare daily data between the HFD and CD group. Two-factor (treatment and phenotype) ANOVA was used in rats on the HFD during the intervention period and the terminal experiment for the analysis of energy intake, changes of body weight, fat mass, lean mass, pWAT, eWAT, and liver. The 2-factor ANOVA does not reveal detail difference between treatments within the H, I, or L groups if a main effect of treatment, phenotype, or interaction is identified. In this case, a t-test was used to compare effectiveness of BDNF within each phenotype group. For multiple comparisons within treatment group (such as H-, I- and L-BDNF group) the Benjamini- Hochberg (B-H) procedure (Benjamini, 1995) for controlling the false positive rate was applied (David Thissen, 2002). Three-factor (phenotype, treatment and time as pre- and post-intervention) were applied in rats on HFD for analyses of serum metabolic indices. Since post-hoc analyses of 3-factor ANOVA does not reveal a detail difference between treatments within the H, I, or L groups and between the 2 time points (pre- and post-intervention), a t-test is applied to compare BDNF with aCSF within each phenotype group at the same time point; and a paired t-test was used to make a comparison between the two time points within same animals.. For multiple comparisons among HC, IC, and LC, or H-BDNF, I-BDNF and L-BDNF, the B-H procedure was applied. For comparing metabolic indices among different phenotypes at pre-intervention, we first combined HC and H-BDNF as the H rats, and so on for the I and L groups, and then used the B-H procedure for the analysis. For EE and SPA, one-factor (treatment) ANOVA was applied to determine the differences between HC and H-BDNF. One-factor (diet) ANOVA was used to compare the aCSF-treated HFD rats with the CD-C rats to determine differences between the two diets. Data were analyzed using the StatView 5.0 program (Cary, NC) and were expressed as mean ± S.E.M. During the intervention, 2 animals with correct cannulation were sick (one from HC, and one from LC) and 1 died (from IC at the beginning of intervention) due to a possible infection; the data for these animals were excluded. Sixteen animals were excluded from the statistical analyses due to misplaced cannula: two from CD-C, three from HC, H-BDNF and IC groups, one from I-BDNF, and two from LC and L-BDNF. The sample size for each subgroup at the end of the study was nine for CD-C, eight for HC, nine for H-BDNF, eight for IC, 11 for I-BDNF, seven for LC, and nine for L-BDNF, respectively.
Results
1. HFD exposure, pre-BDNF intervention
1) Energy intake
HFD exposure significantly increased cumulative energy intake beginning on day 1 (P ≤ 0.016) and the HFD group had a more than 10% increase in energy intake of CD group by the end of 11 weeks (8810 ± 100 kcal for HFD vs. 7997 ± 185 kcal for CD). Within the HFD group, energy intake in the H group (9574.2 ± 118.4 Kcal) was significantly higher than that in the I group (8640.4 ± 118.5 Kcal, P < 0.0001) and the L group (8123.2 ± 116.7 Kcal g, P < 0.0001); and energy intake in the I rats was significantly higher than that in the L group (P = 0.0033, data not shown).
2) Body weight
In contrast to the rapid increase in energy intake after the start of the diets, it took 34 days for the HFD group to show a significant increase in body weight compared to the CD group (Fig. 2a). By the end of this period, the HFD group showed a significant 5.8% increase in body weight compared to the CD group. Within the HFD group, body weight in the H rats (655.6 ± 9.8 g) was significantly higher than that in the I rats (598 ± 10.5 g, P = 0.0001) and the L rats (566.8 ± 10.0 g, P < 0.0001, data not shown).
3) Body fat mass
In contrast to body weight, HFD-fed rats had significantly increased fat mass beginning on day 3 of diet exposure and continuing throughout the experimental period (Fig. 2b) compared to CD group; at the end, they had gained more than 41% of the fat mass of the CD rats. Within HFD group, fat mass in the H rats (166.1 ± 4.3 g) was significantly higher than that in the I rats (120.3 ± 1.5 g, P < 0.0001) and the L rats (90.9 ± 3.0 g, P < 0.0001); and fat mass in the I rats was significantly higher than that in the L rats (P < 0.0001, data not shown).
4) Lean mass
Despite that HFD-fed rats had more body weight (average 42.0 g) and fat mass (average 41.7 g) than CD rats after 11 weeks of the dietary regimes, both groups had similar lean mass (average 408.1 g for HFD vs. 407.0 g for CD) which persisted throughout the time course. Within HFD group, lean mass in the H group (414.4 ± 6.7 g) was similar to that in the I (405.7 ± 8.3 g) and the L rats (403.5 ± 7.3 g, data not shown).
5) Metabolic indices
Serum glucose, insulin and leptin were measured before the intervention. Compared to the CD, rats on HFD had significantly higher levels of glucose (123.3 ± 3.5 mg/dl for HFD vs. 104.2 ± 5.2 mg/dl for CD, P = 0.0381) and leptin (2.349 ± 0.128 pg/ml for HFD vs. 1.549 ± 0.189 pg/ml for CD, P = 0.01763). There was no significant difference in insulin between the two groups (5.55 ± 0.42 ng/ml for HFD vs. 4.27 ± 0.73 ng/ml for CD, P = 0.239).
2. BDNF intervention
1) Energy intake
Two-factor ANOVA indicated a significant main effect of treatment (P ≤ 0.0189) and phenotype (P = 0.0216) for the duration of the intervention. Post hoc t-tests indicated that in HFD-fed animals, BDNF in the I and L rats had significantly lower energy intake (Fig. 3b and 3c) during intervention compared with control rats in the same groups. However, no significant difference was found between HC and H-BDNF (Fig. 3a). Cumulatively, BDNF significantly reduced energy intake in the I group (Fig 3d). There were no significant differences in total energy intake in the H and L groups (Fig. 3d). Post-hoc tests for phenotype indicated that H-BDNF animals had a significantly higher energy intake than the L-BDNF (P = 0.00913). There were no differences between the HC, IC and LC groups. Energy intake in the CD-C was significantly lower than that in the HC and IC groups (Fig. 3d), but was similar to the LC rats.
Figure 3.

Time course of energy intake (energy intake) during BDNF intervention. Two-factor ANOVA indicated a significant main effect of treatment (P ≤ 0.0189) and phenotype (P = 0.0216). I- and L-BDNF rats had significantly lower energy intake (P ≤ 0.014533, b; and P ≤ 0.04722, c) compared with IC and LC subgroups. There was no significant difference between HC and H-BDNF energy intake (a). Cumulatively, BDNF significantly reduced energy intake in I group (P = 0.014533, d), but not in H and L groups (d). Post hoc tests for phenotype were used to compare the total energy intake among BDNF- or aCSF-treated animals. H-BDNF animals had a significantly higher energy intake than L-BDNF (P = 0.00913); and there were no differences among HC, IC and LC groups. CD-C rats had energy intake similar to LC (c and d), but significantly less than HC (P = 0.0077) and IC rats (P = 0.0086).
H: high fat mass group; I: intermediate fat mass group; L: low fat mass group; HC: H subgroup treated with aCSF; H-BDNF: H subgroup treated with BDNF; IC: I subgroup treated with aCSF; I-BDNF: I subgroup treated with BDNF; LC: L subgroup treated with aCSF; L-BDNF: L subgroup treated with BDNF; CD: control diet; CD-C: CD group treated with aCSF. *: P < 0.05, comparison between BDNF and aCSF treatment in the H, I and L group.
2) Body weight
Two-factor ANOVA for time course of body weight indicated a significant main effect of treatment (P ≤ 0.05) and phenotype (P < 0.0001) from day two and through the end of study. Post hoc t-tests indicate that H-, I- and L-BDNF rats had significantly lower body weight (Fig. 4a) than HC, IC and LC rats. Two-factor ANOVA for total body weight change indicated a significant main effect of treatment (P < 0.0001). BDNF significantly decreased total body weight in the H, I and L subgroups (Fig. 4b). The B-H procedure indicated that H-BDNF rats lost significantly less body weight compared to L-BDNF rats. By the end of the experiment, H-, I- and L-BDNF rats reduced their body weight to 91.0, 84.2, and 87.0% of HC, IC and LC animals, respectively (Fig. 4c). There was no significant difference in body weight change among HC, IC and LC groups. Total body weight change in the CD-C animals was not different from that in the HC, IC or LC rats (Fig. 4a and b).
Figure 4.

Body weight during BDNF intervention.
Two-factor ANOVA indicated a significant main effect of treatment (P ≤ 0.05) and phenotype (P < 0.0001). In HFD-fed animals, BDNF significantly decreased body weight in the H (P ≤ 0.05, a), I (P ≤ 0.009143, a) and L subgroups (P ≤ 0.033249, a), compared to HC, IC and LC rats. Two-factor ANOVA for total body weight change indicated a significant main effect of treatment (P < 0.0001) but not phenotype (P < 0.0684). BDNF significantly decreased body weight in the H (P = 0.02832), I (P < 0.0001) and L (P = 0.00072) subgroups compared to HC, IC and LC rats (b). The B-H procedure indicated that H-BDNF rats lost significantly less body weight compared to L-BDNF rats (P = 0.00592). Comparisons among the HC, IC and LC groups showed no significant differences in body weight change. Total body weight change in CD-C animals did not differ from HC, IC or LC rats.
H: high fat mass group; I: intermediate fat mass group; L: low fat mass group; HC: H subgroup treated with aCSF; H-BDNF: H subgroup treated with BDNF; IC: I subgroup treated with aCSF; I-BDNF: I subgroup treated with BDNF; LC: L subgroup treated with aCSF; L-BDNF: L subgroup treated with BDNF; CD: control diet; CD-C: CD group treated with aCSF. *: P < 0.05, comparison between BDNF and aCSF treatment in H (blue), I (brown) and L (pink) group. #: P < 0.05, comparison between CD-C and LC.
3) Body fat
Two-factor ANOVA for fat mass indicated a significant main effect of treatment (P ≤ 0.0362) and phenotype (P < 0.0001). Further t-tests showed that BDNF in the H-, I- and L- rats significantly decreased fat mass (Fig. 5a), compared to the control rats in each respective group. Two-factor ANOVA for total fat mass change indicated a significant main effect of treatment (P < 0.0001). BDNF significantly decreased total fat mass in all groups (Fig. 5b). There were no significant differences among H-, I-, and L-BDNF rats. By the end of the experiment, BDNF had reduced fat mass to 77.1%, 66.1% and 57.4% in the H, I and L subgroups, respectively (Fig. 5c). Regression analysis indicated no association between initial fat mass and fat loss. The time course of fat mass for CD-C rats was comparable to the LC rats (Fig. 5a). There were no significant differences in total fat mass change among CD-C, HC, IC and LC rats (Fig. 5b).
Figure 5.

Fat mass during BDNF intervention. Two-factor ANOVA the time course of fat mass indicated a significant main effect treatment (P ≤ 0.0362) and phenotype (P < 0.0001). Further t-tests showed that BDNF significantly decreased fat mass in the H (P ≤ 0.019614, a), I (P ≤ 0.044036, a) and L subgroups (P ≤ 0.044863, a), compared to HC, IC and LC rats. Two-factor ANOVA for total fat mass change indicated a significant main effect of treatment (P < 0.0001). BDNF significantly decreased total fat mass (b) in the H (P = 0.01156), I (P = 0.00767) and L (P = 0.000365) subgroups. There were no significant differences among H-, I-, and L-BDNF rats. BDNF-induced percentages for fat mass reduction are shown in c. There was no significant difference in fat mass change among CD-C, HC, IC and LC rats (P = 0.4001, b).
H: high fat mass group; I: intermediate fat mass group; L: low fat mass group; HC: H subgroup treated with aCSF; H-BDNF: H subgroup treated with BDNF; IC: I subgroup treated with aCSF; I-BDNF: I subgroup treated with BDNF; LC: L subgroup treated with aCSF; L-BDNF: L subgroup treated with BDNF; CD: control diet; CD-C: CD group treated with aCSF. *: P < 0.05, comparison between BDNF and aCSF treatment in H (blue), I (brown) and L (pink) group.
4) Lean mass
Two-factor ANOVA for the time course of lean mass indicated significant main effects of treatment (P ≤ 0.0199) and phenotype (P ≤ 0.0456). Further t-tests revealed that BDNF significantly reduced lean mass in the I (Fig. 6a), but not the H and L groups. BDNF significantly reduced total lean mass (Fig. 6b) in the I and L subgroups, but not in the H subgroup. Among the BDNF treated rats, the H-BDNF rats (Fig. 6a) lost significantly less lean mass than the I- and L-BDNF-treated rats. Regression analyses indicate that the total lean mass change was significantly associated with initial fat mass (fat mass at pre-intervention, R2= 0.313, P = 0.0016), initial relative fat mass (R2 = 0.361, P = 0.0006) and initial fat mass:lean mass ratio (R2 = 0.388, P = 0.0003, Fig. 6c), but not with initial body weight (R2 = 0.028, P = 0.3858, data not shown). There were no significant differences in lean mass between the control groups (CD-C, HC, IC, and LC) at any time point (Fig. 6b).
Figure 6.

Lean mass during BDNF intervention. Two-factor ANOVA for the time course of lean mass indicated significant main effect of treatment (P ≤ 0.0199) and phenotype (P ≤ 0.0456). Further t-tests revealed that BDNF significantly reduced lean mass in I (P ≤ 0.05, a), but not in the H and L groups. BDNF reduced total lean mass (b) in H (P = 0.29535), I (P = 0. 001007) and L (P = 0.00998) subgroups. Among the BDNF treated rats, H-BDNF rats (a) lost significantly less lean mass than I- (P = 0.00383) and L-BDNF rats (P = 0.00028). Total lean mass change was significantly associated with initial fat mass-lean mass ratio (R2 = 0.388, P = 0.0003, c). There was no significant difference in lean mass among the CD-C, HC, IC, and LC at any time point. Total lean mass change in the CD-C animals was comparable with HC, IC and LC rats, with no significant difference between groups (P = 0.0864).
H: high fat mass group; I: intermediate fat mass group; L: low fat mass group; HC: H subgroup treated with aCSF; H-BDNF: H subgroup treated with BDNF; IC: I subgroup treated with aCSF; I-BDNF: I subgroup treated with BDNF; LC: L subgroup treated with aCSF; L-BDNF: L subgroup treated with BDNF; CD: control diet; CD-C: CD group treated with aCSF. *: P < 0.05, comparison between BDNF and aCSF treatment in H (blue), I (brown) and L (pink) group. #: P < 0.05, comparison between H-BDNF and I-BDNF or L-BDNF.
5) Energy expenditure and spontaneous physical activity
EE measures were performed in the H group. As shown in Fig. 7a, BDNF significantly increased hourly tEE at the indicated time points (P ≤ 0.04475). Compared to HC, BDNF significantly increased heat production in the light phase, dark phase and at 24-h post injection, respectively (Inset a of Fig. 7). BDNF generally reduced the respiratory exchange ratio (RER) during the entire 24 h period, with a significant decrease at 9 h post injection (Inset b of Fig. 7). Although BDNF significantly increased rEE (EE during resting) at 20 ~ 24 h post injection (P ≤ 0.046), it did not affect rEE in the light phase, dark phase and at 24 h post injection (Table 4). In contrast to rEE, BDNF significantly increased hourly aEE (EE during SPA) at indicated time points, and subsequently significantly increased aEE in the light phase, dark phase and 24 h post injection (Table 4). There was no significant difference in mean resting metabolic rate (mRMR, 0.0804 ± 0.005 Kcal/kg0.75/min for BDNF vs. 0.0740 ± 0.004 Kcal/kg0.75/min for aCSF, P = 0.3160).
Figure 7.

Time course of total energy expenditure (tEE) after BDNF injected into the VMN of HC and H-BDNF subgroups. BDNF significantly increased hourly tEE at indicated time points (P ≤ 0.04475, a). Compared to HC, BDNF significantly increased heat production in the light phase (P = 0.00265), dark phase (P = 0.0079) and at 24-h post injection (P = 0.0038), respectively (Inset a). BDNF generally reduced the respiratory exchange ratio (RER) during the entire 24 h period, with a significant decrease at 9 h post injection (inset b).
Table 4.
Hourly energy expenditure for spontaneous physical activity (aEE) and resting (rEE), total spontaneous physical activity (tSPA) and time spent on SPA (TimeSPA) in 24-h post intervention.
| Hour after injection | aEE (Kcal/kg0.75) | rEE (Kcal/kg0.75) | Total SPA (Counts) | Time spent on SPA (min) | ||||||||
|---|---|---|---|---|---|---|---|---|---|---|---|---|
| aCSF | BDNF | P | aCSF | BDNF | P | aCSF | BDNF | P | aCSF | BDNF | P | |
| 1 | 0.67 ± 0.16 | 1.68 ± 0.43 | 0.089 | 3.69 ± 0.13 | 3.37 ± 0.42 | 0.558 | 640 ± 148 | 5556 ± 2924 | 0.1921 | 2.39 ± 0.52 | 5.92 ± 2.55 | 0.286 |
| 2 | 0.15 ± 0.04 | 1.53 ± 0.41 | 0.015 | 3.93 ± 0.17 | 3.74 ± 0.42 | 0.741 | 110 ± 50 | 3533 ± 2128 | 0.2104 | 0.31 ± 0.13 | 9.18 ± 4.80 | 0.154 |
| 3 | 0.48 ± 0.12 | 1.65 ± 0.38 | 0.031 | 3.79 ± 0.17 | 3.70 ± 0.44 | 0.884 | 560 ± 134 | 3372 ± 1744 | 0.2106 | 1.91 ± 0.54 | 8.73 ± 4.13 | 0.203 |
| 4 | 0.70 ± 0.14 | 1.70 ± 0.34 | 0.040 | 3.95 ±0.25 | 3.63 ± 0.38 | 0.569 | 786 ± 170 | 2551± 999 | 0.1761 | 2.59 ± 0.71 | 7.99 ± 2.87 | 0.157 |
| 5 | 0.88 ± 0.09 | 1.20± 0.21 | 0.269 | 3.85 ± 0.23 | 4.10 ± 0.24 | 0.540 | 1028 ± 231 | 1378 ± 260 | 0.4116 | 3.06 ± 0.49 | 3.93 ± 0.66 | 0.393 |
| 6 | 0.65 ± 0.09 | 1.30 ± 0.23 | 0.046 | 4.03 ± 0.21 | 4.12 ± 0.21 | 0.815 | 526 ± 134 | 1820 ± 516 | 0.0658 | 1.78 ± 0.43 | 4.73 ± 1.08 | 0.055 |
| 7 | 1.31± 0.21 | 2.21 ± 0.41 | 0.13 | 3.97 ±0.27 | 3.71 ± 0.41 | 0.672 | 1107 ± 227 | 4278 ± 1551 | 0.1202 | 3.69 ± 0.69 | 11.19 ± 3.37 | 0.096 |
| 8 | 0.93 ± 0.19 | 2.38 ± 0.41 | 0.018 | 4.21 ± 0.29 | 3.72 ± 0.40 | 0.428 | 751 ± 223 | 4206 ± 1789 | 0.1395 | 2.76 ± 0.73 | 10.80 ± 3.58 | 0.093 |
| 9 | 1.54 ± 0.21 | 2.52 ± 0.50 | 0.157 | 3.97 ± 0.24 | 3.88 ± 0.41 | 0.874 | 1267 ± 269 | 3574 ± 1327 | 0.1851 | 4.81 ± 0.76 | 10.13 ± 3.08 | 0.192 |
| 10 | 1.32 ± 0.21 | 3.25 ± 0.41 | 0.004 | 4.24 ± 0.16 | 3.66 ± 0.33 | 0.213 | 1107± 279 | 4079 ± 1138 | 0.0560 | 4.40 ± 1.11 | 11.39 ± 2.61 | 0.061 |
| 11 | 2.06 ± 0.38 | 3.67± 0.25 | 0.009 | 3.70 ± 0.21 | 3.24 ± 0.27 | 0.282 | 4369 ± 2612 | 4388 ± 268 | 0.9950 | 7.72 ± 2.93 | 13.10 ± 1.35 | 0.173 |
| 12 | 1.90 ± 0.24 | 3.26 ± 0.34 | 0.017 | 3.92 ± 0.29 | 3.57 ± 0.27 | 0.473 | 1602 ± 211 | 3815 ± 588 | 0.0109 | 5.91 ± 0.84 | 11.88 ± 1.72 | 0.021 |
| 13 | 1.50 ± 0.33 | 3.23 ± 0.32 | 0.007 | 4.03 ± 0.20 | 3.45 ± 0.38 | 0.275 | 1105 ± 282 | 3684 ± 441 | 0.0010 | 4.54 ± 1.31 | 10.39 ± 1.01 | 0.009 |
| 14 | 1.28 ± 0.13 | 2.73 ± 0.28 | 0.001 | 3.99 ± 0.22 | 3.72 ± 0.41 | 0.641 | 1132 ± 114 | 2987 ± 552 | 0.0170 | 4.23 ± 0.46 | 9.05 ± 1.24 | 0.009 |
| 15 | 1.30 ± 0.23 | 2.97 ± 0.36 | 0.006 | 4.09 ± 0.14 | 3.68 ± 0.21 | 0.195 | 1126 ± 196 | 3418 ± 436 | 0.0013 | 4.45 ± 1.00 | 10.31 ± 1.33 | 0.010 |
| 16 | 1.23 ± 0.25 | 2.72 ± 0.24 | 0.002 | 4.15 ± 0.14 | 3.83 ± 0.08 | 0.118 | 1295 ± 306 | 3238 ± 243 | 0.0008 | 4.66 ± 1.11 | 10.78 ± 0.86 | 0.002 |
| 17 | 1.65 ± 0.29 | 3.14 ± 0.18 | 0.002 | 3.71 ± 0.10 | 3.72 ± 0.18 | 0.969 | 1850 ± 420 | 5129 ± 1016 | 0.0271 | 6.27 ± 1.47 | 13.77 ± 1.95 | 0.022 |
| 18 | 1.51 ± 0.24 | 2.70 ± 0.22 | 0.007 | 3.62 ± 0.09 | 3.75 ± 0.16 | 0.553 | 1425 ± 304 | 4388 ± 519 | 0.0010 | 4.86 ± 1.02 | 12.41 ± 1.30 | 0.002 |
| 19 | 1.08 ± 0.23 | 2.23 ± 0.19 | 0.004 | 3.46 ± 0.14 | 3.61 ± 0.19 | 0.622 | 365 ± 137 | 1607 ± 495 | 0.0666 | 1.21 ± 0.42 | 4.65 ± 1.26 | 0.050 |
| 20 | 0.12 ± 0.02 | 0.64 ± 0.11 | 0.002 | 3.55 ± 0.14 | 4.40 ± 0.17 | 0.007 | 64 ± 10 | 1158 ± 278 | 0.0060 | 0.28 ± 0.05 | 3.45 ± 0.77 | 0.004 |
| 21 | 0.36 ± 0.14 | 0.86 ± 0.06 | 0.063 | 3.58 ± 0.19 | 4.22 ± 0.16 | 0.046 | 357 ± 116 | 1161 ± 309 | 0.0643 | 1.35 ± 0.42 | 3.22 ± 0.77 | 0.100 |
| 22 | 0.33 ± 0.08 | 1.26 ± 0.21 | 0.004 | 3.52 ± 0.10 | 4.09 ± 0.10 | 0.004 | 420 ± 136 | 1242 ± 225 | 0.0205 | 1.56 ± 0.56 | 3.86 ± 0.67 | 0.043 |
| 23 | 0.62 ± 0.14 | 1.18 ± 0.25 | 0.122 | 3.41 ± 0.13 | 4.04 ± 0.12 | 0.008 | 558 ± 159 | 1055 ± 248 | 0.1821 | 1.76 ± 0.49 | 3.38 ± 0.84 | 0.187 |
| 24 | 0.32 ± 0.13 | 0.94 ± 0.19 | 0.041 | 3.45 ± 0.13 | 4.12 ± 0.17 | 0.020 | 392 ± 136 | 1299 ± 346 | 0.0634 | 1.36 ± 0.46 | 3.79 ± 1.03 | 0.096 |
| Light phase | 6.59 ± 0.33 | 16.14±1.78 | 0.001 | 44.71 ± 1.92 | 47.24 ± 2.77 | 0.542 | 8740 ± 1624 | 28404 ± 8956 | 0.0987 | 22.05 ± 1.36 | 67.08 ± 13.61 | 0.0166 |
| Dark Phase | 17.28 ± 1.98 | 34.79 ± 2.02 | 0.001 | 47.09 ± 1.89 | 43.82 ± 2.86 | 0.441 | 20219 ± 4691 | 44511 ± 5666 | 0.0147 | 55.83 ± 9.33 | 130.74 ± 11.33 | 0.0005 |
| Total 24 hrs | 23.87 ± 1.90 | 50.93 ± 3.22 | 0.001 | 91.80 ± 3.71 | 91.06 ± 5.55 | 0.928 | 23938 ± 4326 | 72915 ± 14415 | 0.0178 | 77.87 ± 9.56 | 198.01 ± 24.73 | 0.0021 |
BDNF significantly increased hourly aEE at indicated time points, which led to increased aEE in the light phase, dark phase and 24 h post injection. Although BDNF significantly increased rEE at 20 ~ 24 h after injection (P ≤0.046), it did not significantly increase rEE in the light phase, dark phase and at 24 h post injection. BDNF significantly increased tSPA and time spent on SPA (TimeSPA) at indicated time points, and consequently increased the both in the light phase, dark phase and 24-h post injection.
aEE: energy expenditure for spontaneous physical activity; rEE; energy expenditure for resting; tSPA: total spontaneous physical activity (counts); and TimeSPA: time spent on SPA (min).
BDNF increased total SPA (tSPA, sum counts from ambulatory and vertical movements) and time spent on SPA (TimeSPA) in the indicated time points (Table 4), and subsequently increased tSPA and TimeSPA during light phase, dark phase and 24-h post injection. As shown in Table 5, BDNF significantly increased all of the following: distance traveled, ambulatory, vertical and stereotypic counts; time spent ambulating and in vertical movement; and ambulatory episodes. BDNF also significantly increased the work of ambulating.
Table 5.
Breakdown of twenty-four hour total spontaneous physical activity (tSPA) in the high body fat mass group.
| SPA components | HC | H-BDNF | P-Values |
|---|---|---|---|
| Distance traveled (m) | 536.3 ± 125.5 | 1,654.2 ± 409.1 | 0.0256 |
| Ambulatory Counts | 22,601.4 ± 5,176.5 | 70,788.3 ± 16,575.0 | 0.0188 |
| Time for ambulance (min) | 43.7 ± 6.6 | 130.9 ± 21.9 | 0.0065 |
| Ambulatory Episodes | 1,168.1 ± 74.4 | 2,375.8 ± 275.9 | 0.0012 |
| Vertical Counts | 1,337 ± 162.6 | 2,126.7 ± 213.3 | 0.0113 |
| Stereotypical Counts | 39,483.1 ± 1984.4 | 47,237. 7 ± 1,512.9 | 0.0066 |
| Total SPA counts | 23,938.4 ± 5,298.2 | 72,915. 6 ± 16,645.7 | 0.0178 |
| Total time spent on SPA (min) | 77.87 ± 9.56 | 198.01 ± 24.73 | 0.0021 |
| Work of ambulating (Kg/m)* | 345.1 ± 85.7 | 960.0 ± 234.4 | 0.0331 |
: Work of ambulating is product of body mass (kg) and distance traveled (m). Please refer to the Methods.
3. Terminal experiment
All animals were sacrificed 44–48 h after the last injection and their liver, pWAT and eWAT were collected and weighed. Two-factor ANOVA indicated significant main effects of treatment (P < 0.0001 and P < 0.0001) and phenotype (P < 0.0001 and P < 0.0001) on pWAT and eWAT, respectively. Further t-tests indicated that BDNF reduced pWAT and eWAT in the H, I and L subgroups (Table 6). HC and IC groups had significantly higher pWAT and eWAT than that in the LC group. Among the aCSF-treated rats, the CD-C animals had significantly lower pWAT and eWAT than that in HC and IC rats, but had no difference relative to LC rats.
Table 6.
Perirenal and epididymal white adipose tissue and liver mass.
| High fat diet | Control diet | ||||||
|---|---|---|---|---|---|---|---|
| H | I | L | |||||
| aCSF | BDNF | aCSF | BDNF | aCSF | BDNF | aCSF | |
| pWAT (g) | 29.0 ± 2.4 | 21.4 ± 1.7 * | 22.8 ± 1.4# | 14.3 ± 1.4* | 15.5 ± 1.3#,¥ | 7.5 ± 1.3 * | 14.2 ± 1.6 #,¥ |
| eWAT (g) | 15.6 ± 0.9 | 12.4 ± 0.8 * | 14.3 ± 1.4 | 9.8 ± 0.8 * | 10.1 ± 0.5#,¥ | 6.2 ± 0.8 * | 9.1 ± 1.0 #,¥ |
| Liver (g) | 18.2 ± 0.9 | 17.1 ± 1.3 | 17.0 ± 0.8 | 14.8 ± 0.7 * | 14.1 ± 0.8#,¥ | 12.0 ± 0.8 | 17.7 ± 1.0Δ |
Two-factor ANOVA indicated significant main effects of treatment (P < 0.0001 for both) and phenotype (P < 0.0001 for bothe) on pWAT and eWAT, respectively. BDNF reduced pWAT and eWAT in H (P = 0.0237 and 0.0223), I (P = 0.00062 and 0.0068), and L subgroups (P = 0.0018 and 0.0028), respectively. HC (P = 0.000348 and 0.000158) and IC (P= 0.00135 and 0.00843) groups had significantly higher pWAT and eWAT than LC group. CD-C rats had significantly lower pWAT and eWAT than that in HC (P < 0.0001 for both) and IC rats (P = 0.0020 and 0.0010, respectively), but there was no differences relative to LC rats.
There were significant main effects of treatment (P < 0.0005) and phenotype (P < 0.0003) on liver weight. I-BDNF rats had significantly lower liver mass than IC rats (P = 0.0487). HC (P = 0.003533) and IC (P = 0.012466) rats had larger livers than that in LC rats. Liver weight in the CD-C group was comparative to HC and IC groups, but was significantly higher than that of LC group (P = 0.0117).
H: high body fat; I: intermediate body fat; L: low body fat; pWAT: perirenal white adipose tissue; eWAT: epididymal white adipose tissue. Please refer to the detailed statistic analyses described in the methods and results sections.
: P < 0.05, compared with aCSF-treated rats within each phenotype group with t-test;
P < Benjamini-Hochberg critical values (0.025, 0.01667 or 0.00833), compared to aCSF-treated H (HC);
P < Benjamini-Hochberg critical values (0.025, 0.01667 or 0.00833), compared to aCSF-treated I (IC);
P < 0.05, compared to aCSF-treated L (LC).
There were significant main effects of treatment (P < 0.0005) and phenotype (P < 0.0003) on liver weight. Post-hoc t-tests indicated significantly reduced liver mass in the BDNF-treated I rats (Table 6). HC and IC rats had significantly larger livers than that in LC rats. CD-C group had comparable liver size with HC and IC groups, but larger liver than that of LC group.
4. Serum metabolic measurements
There was a significant main effect of phenotype (P = 0.0056) on serum glucose among the H, I and L groups at pre-intervention. Glucose in the H rats was significantly higher than that in the I (the H rats: 140.1 ± 5.6 mg/dl vs. the I rats: 114.3 ± 7.8 mg/dl, P = 0.00444) and the L groups (109.4 ± 6.3 mg/dl, P = 0.00048, data not shown). Three-factor ANOVA (phenotype, time and treatment) showed a significant main effect of time and interaction between phenotype and time, with a weak effect of treatment. Within the H group, BDNF did not elicit changes in glucose levels post-treatment, but within each subgroup, glucose was significantly lower as compared to pretreatment (Table 7). In the L group, BDNF-treated rats had significantly reduced glucose compared to pre-treatment, but were not different from the LC group.
Table 7.
Serum metabolic indices at pre- and post-intervention time points.
| High fat diet | Control diet | |||||||
|---|---|---|---|---|---|---|---|---|
| H | I | L | ||||||
| aCSF | BDNF | aCSF | BDNF | aCSF | BDNF | aCSF | ||
| Glucose (mg/dl) | Pre-treatment | 145.4 ± 7.7 | 135.4 ± 6.4 | 121.1 ± 15.4 | 109.4 ± 4.1 | 113.6 ± 6.9 | 106.1 ± 8.3 | 106.7 ± 5.5 |
| Post-treatment | 81.7 ± 8.2# | 80.1 ± 6.8# | 108.0 ± 7.4 | 85.7 ± 9.7# | 81.4 ± 10.2 | 85.6 ± 8.2# | 68.2 ± 9.1# | |
| Insulin (ng/ml) | Pre-treatment | 10.02 ± 1.14 | 6.11 ± 0.91* | 4.82 ± 0.74 | 5.45 ± 0.75 | 2.33 ± 0.50 | 3.57 ± 0.74 | 4.65 ± 0.77 |
| Post-treatment | 10.22 ± 2.87 | 3.74 ± 1.35* | 9.41 ± 2.19# | 7.65 ± 1.74 | 5.10 ± 0.88# | 3.26 ± 0.74¥ | 5.42 ± 0.95 | |
| Leptin (pg/ml) | Pre-treatment | 3.39 ± 0.22 | 3.17 ± 0.24 | 2.24 ± 0.20 | 2.34 ± 0.13 | 1.37 ± 0.11¥ | 1.16 ± 0.14 | 1.65 ± 0.20 |
| Post-treatment | 3.17 ± 0.64 | 1.36 ± 0.24*,# | 2.44 ± 0.23 | 0.92 ± 0.14*# | 1.46 ± 0.28 | 0.49 ± 0.14*#,Δ | 1.27 ± 0.22Δ | |
Glucose: Three-factor ANOVA (phenotype, time and treatment) showed a significant main effect of time (P < 0.0001) and interaction between phenotype and time (P= 0.008), with a weak effect of treatment (P = 0.1501). HC and H-BDNF rats had similar glucose at post-treatment, but both had decreased (P < 0.01) glucose compared to pre-treatment. I-BDNF rats had reduced glucose compared with IC and pre-treatment, but did not reach the significant levels (P = 0.1206 and P = 0.06133, respectively). L-BDNF rats had significantly reduced glucose compared to pre-treatment (P = 0.0348), but had no difference from LC rats.
Insulin: There were significant main effects of treatment (P < 0.0242), phenotype (P = 0.0011) and interactions between the two (P = 0.0435). In the H group, BDNF reduced insulin compared to aCSF (P = 0.02335) and pre-treatment (P = 0.08305). In I and L groups, IC and LC rats, but not I-BDNF and L-BDNF rats, had significantly elevated insulin compared with pre-intervention (P = 0.0484 and P = 0.03881, respectively).
Leptin: Three-factor ANOVA (phenotype, time and treatment) showed main effects of treatment (P < 0.0001), time (p = 0.0002), phenotype (P < 0.0001), and interactions between time and treatment (P < 0.0001). BDNF significantly decreased leptin compared to aCSF treatment and pre-treatment in the H (P = 0.029766 and P = 0.0012, respectively), I (P = 0.00045 and P = 0.00041, respectively) and L (P = 0.01516 and p = 0.0003, respectively) groups.
There were no significant differences in glucose (P = 0.0616) or insulin (P = 0.2253) between the CD-C and the HC, IC and LC post-treatment. CD-C rats had lower serum leptin than that of HC (P = 0.0043, with P = 0.0165 for main effect) at post-treatment. CD-C rats had comparable glucose, insulin and leptin with LC rats at post-treatment. Compared with pre-treatment, CD-C rats at post-treatment had similar levels of insulin and leptin, but significantly lower glucose (P = 0.0052).
H: high body fat; I: intermediate body fat; L: low body fat. Please refer to the detailed statistical analysis described in the method and results sections.
P < 0.05, comparison between BDNF- and aCSF-treated rats in same phenotype group;
P < 0.05, comparison between pre- and post- intervention in each phenotype;
P < 0.05, compared to aCSF-treated rats in H (HC) or BDNF-treated rats in H (H-BDNF);
P < 0.05, compared to aCSF-treated rats in I (IC) or BDNF-treated rats in I (I-BDNF).
Pre-intervention, there was a significant main effect of phenotype on serum insulin (P < .00001) among the H, I and L groups. The B-H procedure further indicated that rats in the H group had significantly higher insulin than that in the I (the H rats: 7.95 ± 0.94 ng/ml vs. the I rats: 5.19 ± 0.56 ng/ml, P = 0.0069) and L groups (3.03 ± 0.54 ng/ml, P = 0.00005). Rats in the I group also had significantly higher insulin than that in the L group (P = 0.0048, data not shown). Three-factor ANOVA (phenotype, time and treatment) showed significant main effects of treatment (P < 0.0242), phenotype (P = 0.0011) and a significant interaction (P = 0.0435). In the H group, BDNF reduced insulin compared to that in the HC group and to pre-treatment levels (Table 7). In the I and L groups, IC and LC rats at post-intervention had significantly elevated insulin compared with pre-intervention; while I-BDNF and L-BDNF rats did not show elevated insulin post-intervention.
Pre-intervention, there was a significant main effect of phenotype on leptin among the H, I and L groups (P < .0001). The B-H analysis indicated that leptin in the H rats was significantly higher than that in the I (the H rats: 3.28 ± 0.18 pg/ml vs. the I rats: 2.32 ± 0.13 pg/ml, P < 0.0001) and L rats (1.25 ± 0.10 pg/ml, P < 0.0001, data not shown). Leptin in the I group was significantly higher than that in the L group (P < 0.00001, data not shown). For evaluation of leptin after intervention, three-factor ANOVA (phenotype, time and treatment) showed main effects of treatment, time, phenotype, and interactions between time and treatment. BDNF significantly decreased leptin compared to control treatment and pre-intervention in all phenotype groups (Table 7).
CD-C rats had comparable glucose and insulin with the HC, IC and LC rats at post treatment; and their serum leptin was lower than that of HC and IC rats at post-treatment (Table 7). Compared with pretreatment, CD-C rats at post treatment had significantly lower glucose, and similar levels of insulin and leptin.
5. Liver histology
Liver histology was examined for all animals. Shown in Figs 8a, b and c are representative liver histology of rats from the CD-C, HC and H-BDNF groups, respectively. An abnormality was defined if liver histology showed balloon-like cells and infiltration of white blood cells (Fig. 8b), and a normal structure is shown in Fig. 8a and 8c. As indicated in Table 8, abnormal liver histology was found in all phenotype groups as compared to controls, with the highest occurrence in HC animals. BDNF appeared to reduce occurrence of the abnormality induced by HFD in all phenotype groups. With the Oil Red O staining, Fig. 8e shows fat deposits in the liver of a HC rat, and Fig. 8d and 8e show no detectable fat deposits in the healthy liver of a rat from CD-C and H-BDNF group, respectively.
Figure 8.

Liver histology from CD-C, HC and H-BDNF. aCSF/BDNF was injected in the VMN every other day for 20 days. At the end of the experiment, the liver from all groups was harvested, sectioned with a cryostat, fixed with 10% formalin, and stained with H&E (a for CD-C, b for HC, and c for H-BDNF rats) and Red Oil O (d for HC, and e for H-BDNF rats). A representative example of each group is shown. Magnification is 20x.
H: high fat mass group; HC: H group treated with aCSF; H-BDNF: H group treated with BDNF; CD: control diet; CD-C: CD group treated with aCSF.
Table 8.
Number of animals showing normal or abnormal liver histology in dietary and treatment groups.
| Normal | Abnormal * | |
|---|---|---|
| CD-C | 8 (88.9%) # | 1 (11.1%) |
| HC | 2 (25%) | 6 (75%) |
| H-BDNF | 7 (77.8%) | 2 (22.2%) |
| IC | 4 (50%) | 4 (50%) |
| I-BDNF | 8 (72.7%) | 3 (27.3%) |
| LC | 3 (42.9) | 4 (57.1%) |
| L-BDNF | 7 (87.5%) | 1 (12.5%) |
: Abnormal liver histology is defined if the histology shows balloon-like cells and/or infiltrated cells in the liver (Please see the Fig. 7b).
The value in the parentheses indicating percentage in the defined group.
Discussion
The current data demonstrate that BDNF in the VMN reduces body fat and related metabolic disorders via reductions in energy intake or/and increases in physical activity and energy expenditure. These data clearly establish the VMN as an important site of action in BDNF therapy for obesity and highlight the potential of BDNF responsive pathways in obesity therapy. Moreover, the current findings of BDNF action in VMN indicate a dual impact of BDNF on both sides of the energy balance equation – intake and expenditure – which explains the robust effect of BDNF on body adiposity and weight. Finally, the current dataset implicates physical activity as an effector of BDNF action to enhance energy expenditure.
An important finding is that body fat mass level is a more sensitive and early indicator of HFD-induced obesity than body weight alone, as a significant increase in fat mass occurred on day 3 (Fig. 2b) while a significant increase in body weight was only observed at 4 weeks (Fig. 2a). Further, the correlation between fat mass or body weight, vs. serum leptin was stronger for fat mass than for body weight. Currently there is no standardized method for defining obesity in rodents. Typically, diet-induced obesity (DIO) or resistance to obesity in response to an obesigenic diet (DR) has been defined as a disparate body weight response among rats after several months of feeding (Levin et al., 1986, Levin et al., 1989),(Ghibaudi et al., 2002), (Gao et al., 2002). By giving HFD, we defined rats as low (i.e. DR), intermediate, and high (i.e. DIO) responders (Fig. 1). Fat mass (90.9 ± 3 g) and body weight (566.8 ±10 g) in the L group was similar to those in the control diet rats (Table 3). Rats in the H group (i.e. DIO) had significantly increased energy intake, body weight and fat mass compared to I and L groups (Table 6). In addition, they had significantly higher serum glucose and insulin, consistent with type II diabetes and insulin resistance. Animals in the H group also had significantly high levels of leptin. Together, these data indicate that rats in the H group developed a leptin and glucose profile similar to that of obesity induced metabolic syndrome.
Early studies indicated that VMN lesions resulted in hyperphagia and obesity (Inoue et al., 1977), whereas electrical stimulation of the VMN immediately suppressed feeding (Ruffin and Nicolaidis, 1999). Selective deletion of BDNF in the VMN resulted in hyperphagia and obesity (Unger et al., 2007). In our study, VMN BDNF significantly decreased DIO rat body mass by increasing energy expenditure, physical activity and fat oxidation. BDNF also normalized high levels of serum insulin and leptin and improved liver histology in these animals.
All the phenotype groups responded to VMN BDNF, with some variations. Significant reduction in fat mass (Fig. 5) in the H-, I- and L-BDNF rats was confirmed by measurement of visceral fat at study’s end (Table 6). Compared to BDNF-treated rats in the I and L groups, BDNF-treated rats in the H group did not show enhanced BDNF responsiveness, as indicated by not losing proportionally more body weight and fat mass, and showing no difference in energy intake relative to controls. This finding does not support the hypothesis that DIO (H-BDNF) animals are more responsive to VMN BDNF treatment than non-DIO rats, contrasting with our previous study of BDNF administration in the PVN (Wang et al., 2010b). Higher relative sensitivity of the PVN to BDNF might explain this observation, an idea that needs further study.
Unlike BDNF-treated rats in the I and L groups, BDNF-treated rats in the H group did not lose significant lean mass (Fig. 6a and b). Further regression analyses suggest that the amount of lean mass loss with VMN BDNF was related to initial body composition, especially fat mass:lean mass ratio (Fig. 6c). The higher the initial fat mass:lean mass ratio, the less lean mass lost. The current data also indicate that in animals with high fat mass, BDNF treatment decreases body weight by reducing a greater percent of fat mass and a smaller percent of lean mass compared to the animals with initially lower fat mass (Figs. 5b and 6b). The same observation was noted in a previous study of BDNF in PVN (Wang et al., 2010b), and suggests that VMN BDNF could lead to different outcomes when used in DIO and non-DIO populations.
A reduction in body weight and fat mass without decreased energy intake in BDNF-treated rats in the H group suggests a increased EE, and confirmed by the finding that BDNF in the VMN significantly increased tEE and aEE (Fig. 7 and table 4). Similarly, BDNF-treated rats in the L group had decreased body weight, despite normal intake, suggesting BDNF-increased EE as a main contributor for body weight loss in these rats.
The current data suggest that VMN BDNF-induced increases in energy expenditure are primarily due to increased amounts of time engaged in physical activity (Fig. 7 and table 4 and 5). Together with other reports showing that several agents in the VMN affect locomotor activity (Bannai et al., 1998), (Narita et al., 1994), (Zhao et al., 2004), the current data indicate that the VMN plays an important role in the regulation of physical activity. The sustained elevations in physical activity and energy expenditure in the current dataset are different from previous observations in animals on regular chow in which acute VMN BDNF increased several components of physical activity and energy expenditure in a rapid and transient manner (Wang et al., 2010a). The long-lasting BDNF effect in the current study is consistent with a report showing elevated EE and locomotor activity after BDNF gene delivery to the hypothalamus (Cao et al., 2009).
BDNF treatment reduced respiratory exchange ratio (RER) throughout the entire 24 h, suggesting that BDNF increased fat oxidation, which may explain the reduction of scanned fat mass and visceral fat in these animals. This finding is consistent with a previous observation showing decreased RER in animals on regular chow (Wang et al., 2010a). A mechanism underlying BDNF-induced fat oxidation is suggested in the reports showing increased sympathetic noradrenalin by hypothalamic BDNF (Cao et al., 2010), and elevated fat oxidation with VMN noradrenalin (Fujikawa et al., 2007).
Compared to the control-treated I and L rats, control-treated H (DIO) group had more rats with liver damage (Table 8), characterized by balloon-like cells spreading throughout the liver along with some infiltrated cells and fat deposits (Fig. 8). Besides reduction of liver weight in BDNF-treated I rats, BDNF appeared to reduce liver abnormality in all groups, especially in H-BDNF rats. The improvement of liver histology was also noticed after chronic BDNF was injected in the PVN (Wang et al., 2010c).
At post-intervention, all BDNF-treated and control-treated rats had reduced glucose levels compared to pretreatment, and no difference was found between BDNF and aCSF treatments within each phenotype. Even CD-C rats reduced glucose post-intervention (Table 7). This suggests that other factors (such as animal handling during injection) might confound the treatment’s effect on glucose metabolism. Dynamically, BDNF in the H group reduced insulin compared to HC and pretreatment. In the control I and L rats, insulin was significantly increased compared to pretreatment, while no such an increase occurred after BDNF treatment in the I- and L rats, suggesting that BDNF prevented elevation of insulin. BDNF in the H, I and L groups resulted in significantly lower leptin compared to the corresponding aCSF-treated rats and to pretreatment levels, suggesting that BDNF reverses hyperleptinemia. A recent study suggests that the hypothalamic BDNF induced leptin reduction is mediated by the sympathetic nervous system (Cao et al., 2010). Together these findings suggest that VMN BDNF normalizes high levels of insulin and leptin, and improves metabolic syndrome-like symptoms.
As indicated above, we have previously determined the effect of BDNF in the PVN (Wang et al., 2010b), using a similar study designs as that in the current study of BDNF in the VMN in HFD-induced obesity. The common findings are that BDNF: 1) significantly reduces body weight and fat mass; 2) reduces visceral fat mass and improves liver histology; and 3) reduces levels of insulin and leptin. The dissimilar observations between BDNF effects in the two hypothalamic sites are as follows: 1) BDNF in the PVN reduced energy intake in all phenotype groups on HFD, while BDNF in the VMN reduced energy intake only in I but not in H and L phenotypes; 2) in the PVN site, H-BDNF subgroup showed the greatest response to BDNF (indicated by having the lowest energy intake and losing the greatest body weight and fat mass) compared to BDNF treatment in the I and L groups, while BDNF in the VMN in the H group did not have the same effect; and 3) BDNF in the VMN significantly increased EE and SPA, which might be a main factor contributing to the loss of body weight and fat mass; however, the effect of BDNF in the PVN on EE was not tested in animals on HFD. These findings suggest that the PVN and VMN respond to BDNF differently, with a more robust loss of adiposity after BDNF in the PVN.
The phenotype of the HFD-induced obesity model in the current study (H group) is similar to that of BDNF-mutated and heterozygous animals (Pelleymounter et al., 1995), (Kernie et al., 2000), (Sha et al., 2007), and animals with selective deletion of VMN Bdnf (Unger et al., 2007). BDNF in the VMN reduced HFD-induced obesity and elements of metabolic syndrome, suggesting that the VMN is an important site of BDNF action in reducing diet-induced obesity, and that chronic treatment can have positive effects on obesity outcomes.
Research Highlights.
SD rats on high fat diet diverged into high (DIO), intermediate and low (DR) adiposity.
Chronic VMH BDNF reduced adiposity in all phenotypes.
BDNF reduced fat mass mainly via increasing physical activity and energy expenditure.
BDNF improved hyperinsulinemia, hyperleptinemia and liver histology.
The VMH is an important site for BDNF action on diet induced obesity.
Acknowledgments
We thank Regeneron Pharmaceuticals Inc (Tarrytown, NY) for providing BDNF, and Martha Grace, Jen Teske, Anaya Mitra, Tammy Butterick-Peterson and Mark R. Margosian for their laboratory assistance.
Grants:
This publication was made possible by Grant Number 1R01DK080782 from National Institute of Diabetes and Digestive and Kidney Diseases. The project described was also supported by the Department of Veterans Affairs. The content is solely the responsibility of the authors and does not necessarily represent the official views of the National Institute of Diabetes and Digestive and Kidney Diseases or the National Institutes of Health.
Footnotes
Publisher's Disclaimer: This is a PDF file of an unedited manuscript that has been accepted for publication. As a service to our customers we are providing this early version of the manuscript. The manuscript will undergo copyediting, typesetting, and review of the resulting proof before it is published in its final citable form. Please note that during the production process errors may be discovered which could affect the content, and all legal disclaimers that apply to the journal pertain.
References
- Ambati S, Duan J, Choi YH, Hartzell DL, Della-Fera MA, Baile CA. ICV vs. VMH injection of leptin: comparative effects on hypothalamic gene expression. Behav Brain Res. 2009;196:279–285. doi: 10.1016/j.bbr.2008.09.014. [DOI] [PubMed] [Google Scholar]
- Araya AV, Orellana X, Espinoza J. Evaluation of the effect of caloric restriction on serum BDNF in overweight and obese subjects: preliminary evidences. Endocrine. 2008 doi: 10.1007/s12020-008-9090-x. [DOI] [PubMed] [Google Scholar]
- Bagnasco M, Dube MG, Katz A, Kalra PS, Kalra SP. Leptin expression in hypothalamic PVN reverses dietary obesity and hyperinsulinemia but stimulates ghrelin. Obes Res. 2003;11:1463–1470. doi: 10.1038/oby.2003.196. [DOI] [PubMed] [Google Scholar]
- Bannai M, Ichikawa M, Nishihara M, Takahashi M. Effect of injection of antisense oligodeoxynucleotides of GAD isozymes into rat ventromedial hypothalamus on food intake and locomotor activity. Brain Res. 1998;784:305–315. doi: 10.1016/s0006-8993(97)01349-8. [DOI] [PubMed] [Google Scholar]
- Benjamini Y, Hochberg Y. Controlling the false discovery rate: A practical and powerful approach to multiple testing. Journal of the Royal Statistical Society B. 1995;57:12. [Google Scholar]
- Cao L, Lin EJ, Cahill MC, Wang C, Liu X, During MJ. Molecular therapy of obesity and diabetes by a physiological autoregulatory approach. Nat Med. 2009;15:447–454. doi: 10.1038/nm.1933. [DOI] [PMC free article] [PubMed] [Google Scholar]
- Cao L, Liu X, Lin EJ, Wang C, Choi EY, Riban V, Lin B, During MJ. Environmental and genetic activation of a brain-adipocyte BDNF/leptin axis causes cancer remission and inhibition. Cell. 2010;142:52–64. doi: 10.1016/j.cell.2010.05.029. [DOI] [PMC free article] [PubMed] [Google Scholar]
- Carter R, Holiday DB, Nwasuruba C, Stocks J, Grothues C, Tiep B. 6-minute walk work for assessment of functional capacity in patients with COPD. Chest. 2003;123:1408–1415. doi: 10.1378/chest.123.5.1408. [DOI] [PubMed] [Google Scholar]
- Cavagna GA, Saibene FP, Margaria R. External work in walking. J Appl Physiol. 1963;18:1–9. doi: 10.1152/jappl.1963.18.1.1. [DOI] [PubMed] [Google Scholar]
- Chuang ML, Lin IF, Wasserman K. The body weight-walking distance product as related to lung function, anaerobic threshold and peak VO2 in COPD patients. Respir Med. 2001;95:618–626. doi: 10.1053/rmed.2001.1115. [DOI] [PubMed] [Google Scholar]
- Clegg DJ, Benoit SC, Reed JA, Woods SC, Dunn-Meynell A, Levin BE. Reduced anorexic effects of insulin in obesity-prone rats fed a moderate-fat diet. Am J Physiol Regul Integr Comp Physiol. 2005;288:R981–986. doi: 10.1152/ajpregu.00675.2004. [DOI] [PubMed] [Google Scholar]
- Conner JM, Lauterborn JC, Yan Q, Gall CM, Varon S. Distribution of brain-derived neurotrophic factor (BDNF) protein and mRNA in the normal adult rat CNS: evidence for anterograde axonal transport. J Neurosci. 1997;17:2295–2313. doi: 10.1523/JNEUROSCI.17-07-02295.1997. [DOI] [PMC free article] [PubMed] [Google Scholar]
- Cottone P, Sabino V, Nagy TR, Coscina DV, Zorrilla EP. Feeding microstructure in diet-induced obesity susceptible versus resistant rats: central effects of urocortin 2. J Physiol. 2007;583:487–504. doi: 10.1113/jphysiol.2007.138867. [DOI] [PMC free article] [PubMed] [Google Scholar]
- David Thissen LS, Kuang Daniel. Quick and Easy Implementation of the Benjamini- Hochberg Procedure for Controlling the False Positive Rate in Multiple Comparisons. Journal of Educational and Behavioral Statistics. 2002;27:8. [Google Scholar]
- Dreon DM, Frey-Hewitt B, Ellsworth N, Williams PT, Terry RB, Wood PD. Dietary fat:carbohydrate ratio and obesity in middle-aged men. Am J Clin Nutr. 1988;47:995–1000. doi: 10.1093/ajcn/47.6.995. [DOI] [PubMed] [Google Scholar]
- El-Gharbawy AH, Adler-Wailes DC, Mirch MC, Theim KR, Ranzenhofer L, Tanofsky-Kraff M, Yanovski JA. Serum brain-derived neurotrophic factor concentrations in lean and overweight children and adolescents. J Clin Endocrinol Metab. 2006;91:3548–3552. doi: 10.1210/jc.2006-0658. [DOI] [PMC free article] [PubMed] [Google Scholar]
- Fujikawa T, Matsumura S, Yamada H, Inoue K, Fushiki T. Transforming growth factor-beta in the brain enhances fat oxidation via noradrenergic neurons in the ventromedial and paraventricular hypothalamic nucleus. Brain Res. 2007;1173:92–101. doi: 10.1016/j.brainres.2007.08.002. [DOI] [PubMed] [Google Scholar]
- Gandhi A, Beam HA, O’Connor JP, Parsons JR, Lin SS. The effects of local insulin delivery on diabetic fracture healing. Bone. 2005;37:482–490. doi: 10.1016/j.bone.2005.04.039. [DOI] [PubMed] [Google Scholar]
- Gao J, Ghibaudi L, van Heek M, Hwa JJ. Characterization of diet-induced obese rats that develop persistent obesity after 6 months of high-fat followed by 1 month of low-fat diet. Brain Res. 2002;936:87–90. doi: 10.1016/s0006-8993(02)02493-9. [DOI] [PubMed] [Google Scholar]
- Geroldi D, Minoretti P, Emanuele E. Brain-derived neurotrophic factor and the metabolic syndrome: more than just a hypothesis. Med Hypotheses. 2006;67:195–196. doi: 10.1016/j.mehy.2006.02.001. [DOI] [PubMed] [Google Scholar]
- Ghibaudi L, Cook J, Farley C, van Heek M, Hwa JJ. Fat intake affects adiposity, comorbidity factors, and energy metabolism of sprague-dawley rats. Obes Res. 2002;10:956–963. doi: 10.1038/oby.2002.130. [DOI] [PubMed] [Google Scholar]
- Gray J, Yeo G, Hung C, Keogh J, Clayton P, Banerjee K, McAulay A, O’Rahilly S, Farooqi IS. Functional characterization of human NTRK2 mutations identified in patients with severe early-onset obesity. Int J Obes (Lond) 2007;31:359–364. doi: 10.1038/sj.ijo.0803390. [DOI] [PubMed] [Google Scholar]
- Gray J, Yeo GS, Cox JJ, Morton J, Adlam AL, Keogh JM, Yanovski JA, El Gharbawy A, Han JC, Tung YC, Hodges JR, Raymond FL, O’Rahilly S, Farooqi IS. Hyperphagia, severe obesity, impaired cognitive function, and hyperactivity associated with functional loss of one copy of the brain-derived neurotrophic factor (BDNF) gene. Diabetes. 2006;55:3366–3371. doi: 10.2337/db06-0550. [DOI] [PMC free article] [PubMed] [Google Scholar]
- Han JC, Liu QR, Jones M, Levinn RL, Menzie CM, Jefferson-George KS, Adler-Wailes DC, Sanford EL, Lacbawan FL, Uhl GR, Rennert OM, Yanovski JA. Brain-derived neurotrophic factor and obesity in the WAGR syndrome. N Engl J Med. 2008;359:918–927. doi: 10.1056/NEJMoa0801119. [DOI] [PMC free article] [PubMed] [Google Scholar]
- Hashimoto K, Nishiyama M, Tanaka Y, Noguchi T, Asaba K, Hossein PN, Nishioka T, Makino S. Urocortins and corticotropin releasing factor type 2 receptors in the hypothalamus and the cardiovascular system. Peptides. 2004;25:1711–1721. doi: 10.1016/j.peptides.2004.05.024. [DOI] [PubMed] [Google Scholar]
- Horvath TL, Sarman B, Garcia-Caceres C, Enriori PJ, Sotonyi P, Shanabrough M, Borok E, Argente J, Chowen JA, Perez-Tilve D, Pfluger PT, Bronneke HS, Levin BE, Diano S, Cowley MA, Tschop MH. Synaptic input organization of the melanocortin system predicts diet-induced hypothalamic reactive gliosis and obesity. Proc Natl Acad Sci U S A. 2010;107:14875–14880. doi: 10.1073/pnas.1004282107. [DOI] [PMC free article] [PubMed] [Google Scholar]
- Inoue S, Campfield LA, Bray GA. Comparison of metabolic alterations in hypothalamic and high fat diet-induced obesity. Am J Physiol. 1977;233:R162–168. doi: 10.1152/ajpregu.1977.233.3.R162. [DOI] [PubMed] [Google Scholar]
- Irani BG, Dunn-Meynell AA, Levin BE. Altered hypothalamic leptin, insulin, and melanocortin binding associated with moderate-fat diet and predisposition to obesity. Endocrinology. 2007;148:310–316. doi: 10.1210/en.2006-1126. [DOI] [PubMed] [Google Scholar]
- Jacob RJ, Dziura J, Medwick MB, Leone P, Caprio S, During M, Shulman GI, Sherwin RS. The effect of leptin is enhanced by microinjection into the ventromedial hypothalamus. Diabetes. 1997;46:150–152. doi: 10.2337/diab.46.1.150. [DOI] [PubMed] [Google Scholar]
- Jolicoeur FB, Bouali SM, Fournier A, St-Pierre S. Mapping of hypothalamic sites involved in the effects of NPY on body temperature and food intake. Brain Res Bull. 1995;36:125–129. doi: 10.1016/0361-9230(94)00176-2. [DOI] [PubMed] [Google Scholar]
- Kernie SG, Liebl DJ, Parada LF. BDNF regulates eating behavior and locomotor activity in mice. Embo J. 2000;19:1290–1300. doi: 10.1093/emboj/19.6.1290. [DOI] [PMC free article] [PubMed] [Google Scholar]
- Kevorkova O, Ethier-Chiasson M, Lafond J. Differential expression of glucose transporters in rabbit placenta: effect of hypercholesterolemia in dams. Biol Reprod. 2007;76:487–495. doi: 10.1095/biolreprod.106.055285. [DOI] [PubMed] [Google Scholar]
- Komori T, Morikawa Y, Nanjo K, Senba E. Induction of brain-derived neurotrophic factor by leptin in the ventromedial hypothalamus. Neuroscience. 2006;139:1107–1115. doi: 10.1016/j.neuroscience.2005.12.066. [DOI] [PubMed] [Google Scholar]
- Levin BE, Dunn-Meynell AA. Reduced central leptin sensitivity in rats with diet-induced obesity. Am J Physiol Regul Integr Comp Physiol. 2002;283:R941–948. doi: 10.1152/ajpregu.00245.2002. [DOI] [PubMed] [Google Scholar]
- Levin BE, Hogan S, Sullivan AC. Initiation and perpetuation of obesity and obesity resistance in rats. Am J Physiol. 1989;256:R766–771. doi: 10.1152/ajpregu.1989.256.3.R766. [DOI] [PubMed] [Google Scholar]
- Levin BE, Triscari J, Sullivan AC. The effect of diet and chronic obesity on brain catecholamine turnover in the rat. Pharmacol Biochem Behav. 1986;24:299–304. doi: 10.1016/0091-3057(86)90354-0. [DOI] [PubMed] [Google Scholar]
- Montez JM, Soukas A, Asilmaz E, Fayzikhodjaeva G, Fantuzzi G, Friedman JM. Acute leptin deficiency, leptin resistance, and the physiologic response to leptin withdrawal. Proc Natl Acad Sci U S A. 2005;102:2537–2542. doi: 10.1073/pnas.0409530102. [DOI] [PMC free article] [PubMed] [Google Scholar]
- Nixon JP, Zhang M, Wang C, Kuskowski MA, Novak CM, Levine JA, Billington CJ, Kotz CM. Evaluation of a quantitative magnetic resonance imaging system for whole body composition analysis in rodents. Obesity Silver Spring, Md. 2010;18:1652–1659. doi: 10.1038/oby.2009.471. [DOI] [PMC free article] [PubMed] [Google Scholar]
- Ohata H, Suzuki K, Oki Y, Shibasaki T. Urocortin in the ventromedial hypothalamic nucleus acts as an inhibitor of feeding behavior in rats. Brain Res. 2000;861:1–7. doi: 10.1016/s0006-8993(99)02378-1. [DOI] [PubMed] [Google Scholar]
- Paxinos G, Watson C. The rat brain in stereotaxic coordinates. San Diego: Academic Press; 1998. [DOI] [PubMed] [Google Scholar]
- Pelleymounter MA, Cullen MJ, Wellman CL. Characteristics of BDNF-induced weight loss. Exp Neurol. 1995;131:229–238. doi: 10.1016/0014-4886(95)90045-4. [DOI] [PubMed] [Google Scholar]
- Ruffin M, Nicolaidis S. Electrical stimulation of the ventromedial hypothalamus enhances both fat utilization and metabolic rate that precede and parallel the inhibition of feeding behavior. Brain Res. 1999;846:23–29. doi: 10.1016/s0006-8993(99)01922-8. [DOI] [PubMed] [Google Scholar]
- Schick RR, Zimmermann JP, vorm Walde T, Schusdziarra V. Peptides that regulate food intake: glucagon-like peptide 1-(7–36) amide acts at lateral and medial hypothalamic sites to suppress feeding in rats. Am J Physiol Regul Integr Comp Physiol. 2003;284:R1427–1435. doi: 10.1152/ajpregu.00479.2002. [DOI] [PubMed] [Google Scholar]
- Sha H, Xu J, Tang J, Ding J, Gong J, Ge X, Kong D, Gao X. Disruption of a novel regulatory locus results in decreased Bdnf expression, obesity, and type 2 diabetes in mice. Physiol Genomics. 2007;31:252–263. doi: 10.1152/physiolgenomics.00093.2007. [DOI] [PubMed] [Google Scholar]
- Strubbe J, Mein C. Increased feeding in response to bilateral injection of insulin antibodies in the VMH. Physiol Behav. 1977;19(2):309–313. doi: 10.1016/0031-9384(77)90343-2. [DOI] [PubMed] [Google Scholar]
- Takaki A, Nagai K, Takaki S, Yanaihara N, Nakagawa H. Satiety function of neurons containing a CCK-like substance in the dorsal parabrachial nucleus. Physiol Behav. 1990;48:865–871. doi: 10.1016/0031-9384(90)90241-u. [DOI] [PubMed] [Google Scholar]
- Teske JA, Kotz CM. Effect of acute and chronic caloric restriction and metabolic glucoprivation on spontaneous physical activity in obesity-prone and obesity-resistant rats. Am J Physiol Regul Integr Comp Physiol. 2009;297:R176–184. doi: 10.1152/ajpregu.90866.2008. [DOI] [PMC free article] [PubMed] [Google Scholar]
- Teske JA, Levine AS, Kuskowski M, Levine JA, Kotz CM. Elevated hypothalamic orexin signaling, sensitivity to orexin A, and spontaneous physical activity in obesity-resistant rats. Am J Physiol Regul Integr Comp Physiol. 2006;291:R889–899. doi: 10.1152/ajpregu.00536.2005. [DOI] [PubMed] [Google Scholar]
- Tran PV, Akana SF, Malkovska I, Dallman MF, Parada LF, Ingraham HA. Diminished hypothalamic bdnf expression and impaired VMH function are associated with reduced SF-1 gene dosage. J Comp Neurol. 2006;498:637–648. doi: 10.1002/cne.21070. [DOI] [PubMed] [Google Scholar]
- Unger TJ, Calderon GA, Bradley LC, Sena-Esteves M, Rios M. Selective deletion of Bdnf in the ventromedial and dorsomedial hypothalamus of adult mice results in hyperphagic behavior and obesity. J Neurosci. 2007;27:14265–14274. doi: 10.1523/JNEUROSCI.3308-07.2007. [DOI] [PMC free article] [PubMed] [Google Scholar]
- Wang C, Bomberg E, Billington C, Levine A, Kotz CM. Brain-derived neurotrophic factor in the hypothalamic paraventricular nucleus increases energy expenditure by elevating metabolic rate. Am J Physiol Regul Integr Comp Physiol. 2007a;293:R992–1002. doi: 10.1152/ajpregu.00516.2006. [DOI] [PubMed] [Google Scholar]
- Wang C, Bomberg E, Billington C, Levine A, Kotz CM. Brain-derived neurotrophic factor in the hypothalamic paraventricular nucleus reduces energy intake. Am J Physiol Regul Integr Comp Physiol. 2007b;293:R1003–1012. doi: 10.1152/ajpregu.00011.2007. [DOI] [PubMed] [Google Scholar]
- Wang C, Bomberg E, Billington CJ, Levine AS, Kotz CM. Brain-derived neurotrophic factor (BDNF) in the hypothalamic ventromedial nucleus increases energy expenditure. Brain Res. 2010a doi: 10.1016/j.brainres.2010.04.013. [DOI] [PMC free article] [PubMed] [Google Scholar]
- Wang C, Bomberg E, Levine A, Billington C, Kotz CM. Brain-derived neurotrophic factor in the ventromedial nucleus of the hypothalamus reduces energy intake. Am J Physiol Regul Integr Comp Physiol. 2007c;293:R1037–1045. doi: 10.1152/ajpregu.00125.2007. [DOI] [PubMed] [Google Scholar]
- Wang C, Godar R, Billington C, Kotz CM. Chronic administration of brain-derived neurotrophic factor in the hypothalamic paraventricular nucleus reverses obesity induced by high fat diet. Am J Physiol Regul Integr Comp Physiol. 2010b doi: 10.1152/ajpregu.00844.2009. [DOI] [PMC free article] [PubMed] [Google Scholar]
- Wang C, Godar RJ, Billington CJ, Kotz CM. Chronic administration of brain-derived neurotrophic factor in the hypothalamic paraventricular nucleus reverses obesity induced by high-fat diet. Am J Physiol Regul Integr Comp Physiol. 2010c;298:R1320–1332. doi: 10.1152/ajpregu.00844.2009. [DOI] [PMC free article] [PubMed] [Google Scholar]
- Wetmore C, Ernfors P, Persson H, Olson L. Localization of brain-derived neurotrophic factor mRNA to neurons in the brain by in situ hybridization. Exp Neurol. 1990;109:141–152. doi: 10.1016/0014-4886(90)90068-4. [DOI] [PubMed] [Google Scholar]
- Wu A, Molteni R, Ying Z, Gomez-Pinilla F. A saturated-fat diet aggravates the outcome of traumatic brain injury on hippocampal plasticity and cognitive function by reducing brain-derived neurotrophic factor. Neuroscience. 2003;119:365–375. doi: 10.1016/s0306-4522(03)00154-4. [DOI] [PubMed] [Google Scholar]
- Wu A, Ying Z, Gomez-Pinilla F. Dietary curcumin counteracts the outcome of traumatic brain injury on oxidative stress, synaptic plasticity, and cognition. Exp Neurol. 2006;197:309–317. doi: 10.1016/j.expneurol.2005.09.004. [DOI] [PubMed] [Google Scholar]
- Xu B, Goulding EH, Zang K, Cepoi D, Cone RD, Jones KR, Tecott LH, Reichardt LF. Brain-derived neurotrophic factor regulates energy balance downstream of melanocortin-4 receptor. Nat Neurosci. 2003;6:736–742. doi: 10.1038/nn1073. [DOI] [PMC free article] [PubMed] [Google Scholar]
- Yan Q, Radeke MJ, Matheson CR, Talvenheimo J, Welcher AA, Feinstein SC. Immunocytochemical localization of TrkB in the central nervous system of the adult rat. J Comp Neurol. 1997;378:135–157. [PubMed] [Google Scholar]
- Zhao L, Bakke M, Hanley NA, Majdic G, Stallings NR, Jeyasuria P, Parker KL. Tissue-specific knockouts of steroidogenic factor 1. Mol Cell Endocrinol. 2004;215:89–94. doi: 10.1016/j.mce.2003.11.009. [DOI] [PubMed] [Google Scholar]