

Abstract
Most scoring functions for protein–protein docking algorithms are either atom-based or residue-based, with the former being able to produce higher quality structures and latter more tolerant to conformational changes upon binding. Earlier, we developed the ZRANK algorithm for reranking docking predictions, with a scoring function that contained only atom-based terms. Here we combine ZRANK's atom-based potentials with five residue-based potentials published by other labs, as well as an atom-based potential IFACE that we published after ZRANK. We simultaneously optimized the weights for selected combinations of terms in the scoring function, using decoys generated with the protein–protein docking algorithm ZDOCK. We performed rigorous cross validation of the combinations using 96 test cases from a docking benchmark. Judged by the integrative success rate of making 1000 predictions per complex, addition of IFACE and the best residue-based pair potential reduced the number of cases without a correct prediction by 38 and 27% relative to ZDOCK and ZRANK, respectively. Thus combination of residue-based and atom-based potentials into a scoring function can improve performance for protein–protein docking. The resulting scoring function is called IRAD (integration of residue- and atom-based potentials for docking) and is available at http://zlab.umassmed.edu.
Keywords: protein–protein docking, reranking, scoring function, ZDOCK, ZRANK, IRAD
Introduction
The goal of computational protein–protein docking is to predict a complex structure starting from the unbound structures of the component proteins.1–7 This challenging problem is usually approached in a stepwise fashion. In the initial stage, the proteins are kept rigid, and the six-dimensional (6D) rotational and translational space is searched for binding orientations. Searching this 6D space is time consuming, thus is often performed with rapidly computable scoring functions. Fast Fourier transform (FFT)7–10 and geometric hashing11 algorithms can be used for an exhaustive search on a grid. Alternatively, Monte Carlo or Molecular Dynamics algorithms are used for a sampling style search.3,4 Proteins undergo conformational changes upon complex formation, often only on surface side chains, sometimes on the backbones of surface loops, and sometimes involving entire domains. Rigid body algorithms can tolerate side chain conformational changes and small backbone conformational changes by introducing “softness” to scoring functions, that is, making these scoring functions insensitive to small structural errors. In the refinement stage, the many possible (thousands to tens of thousands) complex structures generated by the initial stage algorithms are refined and reranked using more time consuming scoring functions. Clustering of structures and prediction of energy funnels12,13 can improve the ability of finding the correct complex structure, and a small number of high scoring predictions can be subjected to explicit side chain and backbone conformational searches.13–15
Our lab developed the ZDOCK series of programs for initial stage docking.5,16–18 ZDOCK performs an exhaustive rigid body search in the 6D rotational and translational space. By default, the three Euler angles are sampled with 6° or 15° spacing, and the three translational degrees of freedom are sampled with 1.2 Å spacing. For each set of rotational angles, only the best scoring translation is retained, which results in 3600 or 54,000 predictions for 15° or 6° rotational sampling, respectively. In the latest version, ZDOCK 3.0, we developed a new statistical pair potential IFACE.18 ZDOCK is consistently amongst the best performing algorithms in the community wide continual challenge for protein–protein docking algorithms called critical assessment of predicted interactions.19–23 In addition to ZDOCK, we also developed a reranking program, ZRANK,24 before ZDOCK 3.0, and showed that ZRANK was effective in reranking ZDOCK 2.1 and ZDOCK 2.3 predictions with high computational speed. We also tested a reparameterized and extended version of ZRANK for reranking structures for which side chains and backbone positions were refined with RosettaDock.15
The scoring functions of both ZDOCK and ZRANK are of atomic resolution. Atom-based potentials can be more accurate than residue-based potentials on high quality structures. Residue-based potentials, on the other hand, can better tolerate conformational changes, especially for rigid body docking algorithms, as well as for reranking. Also, the parameterization is residue-type specific, which may be able to capture the biophysical interactions missed by the atom types used in atom-based potentials. Residue-based and atom-based potentials were previously used in the same docking pipelines.25,26 However, different types of functions were applied to different (filtering) stages of the pipeline, but not within a single scoring function. The goal of this work is to combine the atom-based potentials in ZRANK with several residue-based potentials published by other labs, as well as with the atom-based potential IFACE published by us. We chose the ZRANK platform instead of ZDOCK to test the combinations of potentials because it allows more flexibility in the types of potentials that are combined, and the optimization of the relative weights is straightforward. Specifically, (1) ZDOCK (and all other FFT-based algorithms) can only use potentials that can be expressed as correlations of two discrete functions, whereas ZRANK has no such constraint. (2) Pair potentials, which are expressed as functions of pairs of atom types or residue types, require as many FFTs as the number of types in FFT-based algorithms such as ZDOCK, but the number of types does not pose additional computational constraints on ZRANK. (3) ZRANK has a principled way of optimizing the relative weights of the different potentials when combined.
We implemented various combinations of scoring functions in our ZRANK framework, and evaluated the performance of reranking the predictions made by ZDOCK 3.0 with a rigorous training and testing procedure. We showed that the combination of residue-based and atom-based potentials led to a superior performance compared with the existing ZRANK, ZDOCK 3.0, or the residue-based potentials alone. Adding the residue-based terms to the scoring function increases the computational time modestly. At the atomic level, there are 36 (alanine–alanine) to 289 (arginine–arginine) atom–atom interactions for each pair of residues. But since a residue is represented by one interaction site in most residue-based potentials, there is only a single interaction for each pair in a residue-based potential. Computing this single interaction in addition to the 36–289 atom interactions adds modestly to the computational time. We also applied the newly developed potential to cross docking and showed promising results in predicting the correct binding partners.
Results
The potentials
Figure 1 and Supporting Information Table S1 show the correlations between all the potentials that we considered, using all decoys of all test cases. From the ZRANK scoring function we included van der Waals, electrostatics, and ACE27 desolvation contact energy. From ZDOCK 3.0 we included van der Waals, electrostatics, and IFACE18 desolvation contact energy. For both ZDOCK and ZRANK, the van der Waals terms are split into an attractive component and repulsive component, and the ZRANK electrostatic potential is split in a short-range and long-range component. As expected, ZDOCK and ZRANK terms that represent the same type of interactions are strongly correlated. Furthermore, the attractive and repulsive van der Waals interactions are correlated, both in the ZRANK and ZDOCK frameworks (correlation coefficient r2 = 0.61 for ZRANK and r2 = 0.74 for ZDOCK). The ACE and IFACE terms correlate moderately (r2 = 0.34).
Figure 1.
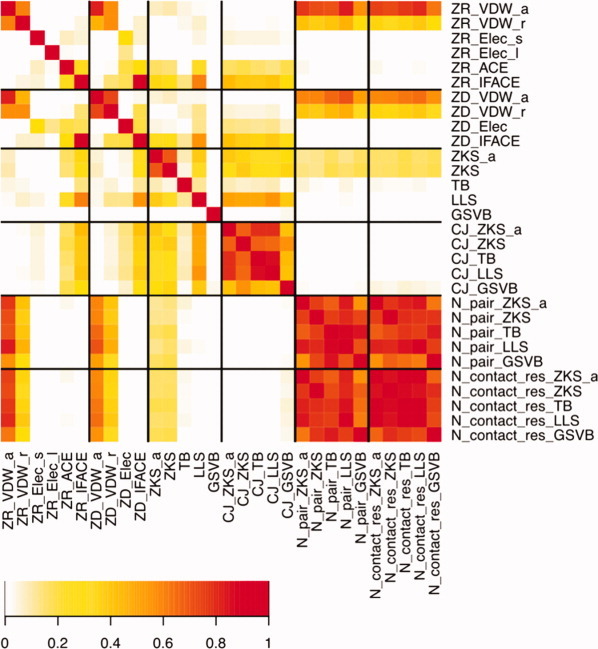
Heatmap representation of the correlation coefficients (r2) for the various terms considered. Terms prefixed with ZR and ZD are from the ZRANK and ZDOCK scoring functions, respectively. Terms with CJ represent the interface propensity potential according to the contact definition from the specified pair-potential. Terms with N_pair and N_contact_res denote the number of interacting pairs and interacting residues, respectively, according to the specified pair-potential.
We considered three residue-based potentials developed for protein–protein docking: Glaser, Steinberg, Vakser, and Ben-Tal (GSVB),28 Tobi and Bahar (TB),29 and Lu, Lu, and Skolnick (LLS).30 We also tested the pair potential developed for protein folding by Zhang, Kolinski, and Skolnick (ZKS)31 and a variant that uses an alternative definition of the interaction site (ZKS/a). These potentials differ in their parameterization, the number of interaction sites for each residue, and how contacts are defined. To assess the effect of the contact definition, we first look at the number of pairs of interacting residues according to each definition, and the associated number of interface residues. These are all strongly correlated, but not perfectly (r2 = 0.56–0.94) reflecting the subtle differences among the definition of interface residues and interaction pairs among the pair potentials.
In addition to the pairwise potentials, we also tested the nonpairwise potential-based on interface propensities from Chakrabarti and Janin (CJ).32 In Figure 1 and Table S1 we see that the CJ potentials that were implemented with different definitions of interface residues (based on the pairwise potentials), show strong but not perfect correlation (r2 = 0.42–0.86), again indicating that the contact definitions of the potentials we considered may affect the results.
The number of interface residues or pair interactions can be considered a measure of the interface size. Of the standard ZDOCK and ZRANK terms, only the vdW terms correlate with the interface size (r2 = 0.53–0.83 for attractive vdW and r2 = 0.30–0.48 for repulsive vdW), which is due to the shape complementarity attempting to maximize the interface size. CJ, IFACE, and ACE do not correlate with the interface size (r2 < 0.07), indicating that they reflect only interface composition and pairing preference. Of the pairwise residue-based potentials, only ZKS and ZKS/a correlate with the interface size, but not strongly.
As expected, the ACE and IFACE terms correlate with CJ (r2 > 0.14 and r2 > 0.30, respectively), as all include desolvation, albeit ACE and IFACE at the atomic level and CJ at the residue level. Of the pairwise residue potentials, we see that ZKS and LLS are strongly correlated with CJ (r2 = 0.39–0.56 with the same contact definition), but TB and GSVB do not show correlation (r2 = 0.04–0.08). The reason is that GSVB uses the interface as reference state, and therefore does not reflect interface composition. As the TB potential is optimized directly for a specific decoy set, it is more difficult to rationalize the correlations. As IFACE and ACE do include desolvation, they correlate with ZKS and LLS. Finally, GSVB and TB do not correlate with other potentials, and they also do not correlate with each other.
Combining potentials
We tested the reranking performance of linear combinations of the potentials introduced above. We used decoys generated with ZDOCK 3.018 for the complexes from our docking benchmark (version 3.0).5,17,33,34 We used 8-fold cross-validation for training and testing, and a downhill simplex35 algorithm to optimize the weights in the linear expression. Because the number of terms we can combine with this procedure is limited, we only tested combinations of up to 10 different potentials. This does, however, avoid the potential to overtrain the scoring function, and still allows us to assess the effects of the different potentials onto the scoring function.
In Supporting Information Tables S2–S4 we show for each combination of terms we tested the various measures that we use to assess the performance, with the key-data summarized in Table I. We use success rates (the number of cases that have at least one hit in a set of predictions, where a hit has a RMSD of less than 2.5 Å relative to the native complex) as well as hit rates (the number of hits in a set of predictions) for the top 10, 100, and 1000 predictions. For example, a success rate of 25% for the top 100 predictions means that for 25% of the test cases (out of a total of 96), at least one correct prediction is found in the 100 top ranked predictions. We also define the integrated success rate (ISR), which is obtained from plotting the success rate against the log of the number of predictions (as in Figs. 3–5). The ISR is then defined as the area under the success rate curve for 1–1000 predictions, normalized to 1. The worst performance is at ISR = 0, and perfect performance is at ISR = 1. This quantity is similar to the target function used for optimizing the weights, as outlined in the methods, and is an appropriate measure because hits with high ranks have a larger weight than hits with lower ranks. Although considering up to 1000 predictions may not seem useful for practical purposes, we want to stress that these decoys are not clustered, and therefore include many similar predictions. In practice, the reranking is usually followed by a clustering algorithm, which further reduces the number of predictions that need to be considered.
Table I.
Integrated Success Rates of Selected Potentials and Combinations Thereof
| Terms | #Terms | ISR | |
|---|---|---|---|
| Individual potentials | ZRANK scoring function | 1 | 0.350 |
| ZDOCK scoring function | 1 | 0.349 | |
| ZKS/a | 1 | 0.121 | |
| ZKS | 1 | 0.140 | |
| TB | 1 | 0.288 | |
| LLS | 1 | 0.194 | |
| GSVB | 1 | 0.072 | |
| ZRANK combined with ZDOCK terms and reoptimized | ZRANK terms | 6 | 0.333 |
| ZRANK terms + ZDOCK_VDW/a | 6 | 0.299 | |
| ZRANK terms + ZDOCK_VDW/r | 6 | 0.338 | |
| ZRANK terms + ZDOCK_Elec | 6 | 0.327 | |
| ZRANK terms + IFACE(ZD) | 6 | 0.407 | |
| ZRANK terms + IFACE(ZRa) | 6 | 0.401 | |
| ZRANK terms + ZDOCK_VDW/a + ZDOCK_VDW/r | 7 | 0.341 | |
| ZRANK terms with pair potentialsb | ZRANK terms + ZKS/a + #ZKS/a | 7 | 0.412 |
| ZRANK terms + ZKS + #ZKS | 7 | 0.402 | |
| ZRANK terms + TB + #TB | 7 | 0.388 | |
| ZRANK terms + LLS + #LLS | 7 | 0.380 | |
| ZRANK terms + GSVB + #GSVB | 7 | 0.354 | |
| ZRANK terms with CJc | ZRANK terms + CJ(ZKS/a) + #CJ(ZKS/a) | 7 | 0.373 |
| ZRANK terms + CJ(ZKS) + #CJ(ZKS) | 7 | 0.378 | |
| ZRANK terms + CJ(TB) + #CJ(TB) | 7 | 0.360 | |
| ZRANK terms + CJ(LLS) + #CJ(LLS) | 7 | 0.366 | |
| ZRANK terms + CJ(GSVB) + #CJ(GSVB) | 7 | 0.349 | |
| Combine best terms | ZRANK terms + IFACE + ZKS/a + #ZKS/a | 8 | 0.425 |
| ZRANK terms + IFACE + CJ(ZKS/a) + #CJ(ZKS/a) | 8 | 0.408 | |
| ZRANK terms + IFACE + ZKS/a + #ZKS/a + CJ(ZKS/a) + #CJ(ZKS/a) | 10 | 0.419 |
Entries in bold are emphasized in the text.
In the ZRANK framework, evaluated using exact positions and not using the ZDOCK grid.
Terms starting with ‘#’ denote the number of pair-wise interactions.
CJ calculated with contact defined as in the pair potentials.
Figure 3.
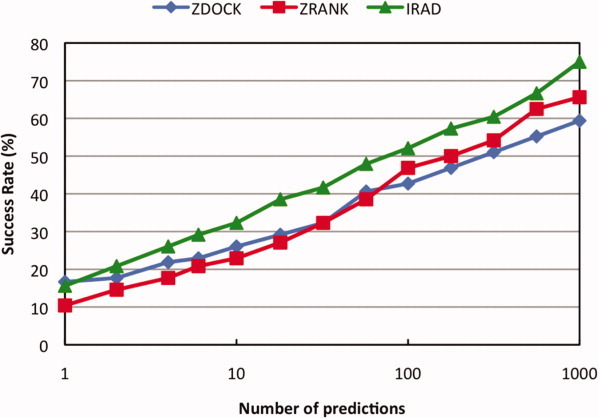
Success rates of the original ZDOCK, ZRANK, and IRAD.
Figure 5.

Success rates of ZDOCK, ZRANK, and IRAD for the Dockground decoy set.
In the tables we also show the average of the optimized weights of the eight training runs in the cross validation (as well as the standard deviation of the eight training runs). The individual potentials were divided by their standard deviation computed using all the decoys, and the weights of the different potentials can therefore be compared to each other. The variations in most of the weights obtained with the different training sets are usually small, which suggests that over-fitting is not a concern. Only the van der Waals weights occasionally show larger standard deviations, which is the result of the repulsive and attractive Van de Waals term being strongly correlated and compensate each other.
In Tables I and S2, we see that ZDOCK 3.0 and the original ZRANK perform very similar (ISR's of 0.349 and 0.350, respectively), although ZDOCK has higher top 1 and 10 success rates, whereas ZRANK has higher top 100 and 1000 success rates. We first tried combining the original ZRANK terms with terms from the ZDOCK scoring function, and IFACE improves performance dramatically (ISR = 0.401). The weight of the IFACE term is large (0.21 or 0.25, depending on the grid-based calculation in the ZDOCK program or the off-grid calculation in the ZRANK program), accordingly the weight of the ACE term is reduced strongly (from 0.25 to 0.06). None of the other ZDOCK 3.0 terms shows noteworthy improvement when combined with the existing ZRANK terms.
In Tables I and S3 we show the reranking performance of the residue potentials by themselves (thus not combined with the ZRANK terms). We see that all residue-based potentials perform worse than ZDOCK or ZRANK (ISR ranges from 0.072 to 0.288, vs. 0.349 and 0.350 for ZDOCK and ZRANK, respectively). TB and LLS, which were developed specifically for docking, perform best (ISR 0.288 and 0.194, respectively). GSVB yields the lowest ISR, which may be due to using the interface residue composition as reference state for determining this potential, whereas the other potentials used surface or entire protein composition as reference state.
Tables I and S3 also show the results of adding the residue-based pair potentials to the standard ZRANK terms. For each residue-based pair potential we also included a term that represents the number of interacting pairs, to avoid bias toward interface sizes. ZKS/a gives the best performance, with an ISR of 0.412. The performance is slightly better than combination of the IFACE term with the standard set of ZRANK terms (ISR = 0.401, Table I). ZRANK terms combined with IFACE gives somewhat better performance for the top 1 success rate, whereas ZRANK with ZKS/a gives better performance for top 10, 100, and 1000 predictions. ZKS with the computed center of mass (ZKS/a) performs better than the parameterized center of mass, which indicates that accurate placement of the center of mass is important for the performance of the potential. The ZRANK terms combined with the TB potential gives an ISR of 0.388, and in particular improves the top 1 success rate, to 16%, and shows a much higher top 1000 hit rate than any of the other combinations of terms (23.1, similar to the ZDOCK top 1000 hit rate of 26.3), which is most likely the result of each residue being represented by three interaction sites in the TB potential. Inclusion of LLS also improves the performance with respect to the existing ZRANK terms (ISR increases from 0.333 to 0.380), but not as much as including IFACE (ISR 0.401) or ZKS/a (ISR 0.412). Finally, GSVB combined with the ZRANK terms does not improve performance.
In the earlier paragraphs we showed that adding either the IFACE or the ZKS/a statistical pair potentials to the existing ZRANK terms improves the overall performance considerably and similarly, with IFACE being atom-based and ZKS/a being residue-based. To further understand the behavior of these potentials we looked at the predictions for individual complexes. For each complex Figure 2 shows the lowest RSMD amongst the top 10 or top 1000 predictions, for ZRANK+IFACE (ZRANK terms combined with IFACE) versus ZRANK+ZKS/a (ZRANK terms combined with the ZKS/a potential). Most cases that produce hits do so for both ZRANK+IFACE and ZRANK+ZKS/a. Only a small number of cases show hits exclusively with ZRANK+IFACE or ZRANK+ZKS/a. In Figure 2(A,B) we discriminate the cases by expected docking difficulty. When the top 10 predictions are considered, ZRANK+ZKS/a performs slightly better than ZRANK+IFACE. This is more pronounced when the top 1000 predictions are considered, especially with the medium difficulty cases being improved (ZRANK+ZKS/a always predicts the same or better than ZRANK+IFACE). This is due to the residue-based potential not depending on exact atomic positions, and therefore can deal better with the larger conformational changes in the cases of medium difficulty. In Figure 2(C,D) we analyze the results by biological function. ZRANK+IFACE performs remarkably better for the antibody–antigen complexes when the top 10 predictions are considered. This may be because ZKS was derived from the structures of monomeric proteins, whereas antibody–antigen interactions may prefer certain atom–atom pairs. We showed earlier that IFACE was particularly effective in identifying the binding interfaces of antibody–antigen complexes without any biological information.18
Figure 2.

RMSD's of ZRANK with IFACE added versus ZRANK with ZKS/a added. Each point represents a test case, and the left (A/C) and right (B/D) panels show the lowest RMSD of the top 10 predictions and top 1000 predictions, respectively. In the top panels (A/B) we indicate the docking difficulty, and in the bottom panels (C/D) the complex type.
Next we combined the existing ZRANK terms with the residue-based interface propensity potential CJ (Tables I and S3). Different contact definitions with the same potential parameters show large variation in performance (ISR ranges from 0.349 to 0.378). This indicates that the contact definition is critical. In fact, the performances of CJ follows the same trend as the corresponding pair potential based on which the contacts were defined: ISRZKS > (ISRTB and ISRLLS) > ISRGSVB. This suggests that the performance of a pair potential is also dependent on its contact definition, and not just due to the potential parameters. Overall, addition of CJ improves over the existing ZRANK terms, but not as much as the improvement from inclusion of the residue-based pair potentials.
Thus we determined that IFACE and ZKS/a give the largest performance gains when combined with the standard ZRANK terms. We then combined these terms to understand whether the gains were cumulative (shown in Tables I and S4). Adding both IFACE and ZKS/a increases the ISR to 0.425, considerably better than adding IFACE or ZKS/a alone (ISR = 0.401 and ISR = 0.412, respectively). We see equal or better success rates across the entire range of predictions, except the top 1 where only ZDOCK performs slightly better. Adding also CJ (with ZKS/a contact definition) does not improve the performance further (ISR = 0.419). Indeed, we see that the average weight of the CJ term is very small (0.01), indicating that this term does not contribute much to the scoring function. We tested various other combinations of the set of ZRANK terms with ZKS/a, CJ, IFACE, and the two components of ZKS/a separately (the pair potential and number of pairs). The results are listed in Table S4, but none of the combinations improved the scoring function further. Leaving out either IFACE or ACE lowers the ISR from 0.425 to 0.412 (Table S4). Although both IFACE and ACE are atom-based statistical pair potentials, ACE is designed for protein folding using monomeric proteins, and IFACE is designed for protein–protein binding using protein–protein complexes. Our results show that the scoring function benefits from including both.
We also optimized the weights separately for the different types of complex, again using 8-fold cross-validation. The overall performance, however, does not improve, and we used weights that are not complex type-specific for the results below and the final integration of residue- and atom-based potentials for docking (IRAD) scoring function.
Thus our optimum function combines the ZRANK terms with IFACE and ZKS/a, which we refer to as the integration of residue- and atom-based potentials for docking (IRAD) scoring function. We will now analyze this function in more detail. Figure 3 shows the success rate together with the success rates of the original ZDOCK and ZRANK scoring functions. Except for the top 1 prediction, IRAD outperforms both ZDOCK and ZRANK over the entire range of numbers of predictions. At the crossover point of the ZDOCK and ZRANK curves (32 predictions), the relative improvement of IRAD is 29%. The absolute gain in success rate is typically about 10%. For the top 1000 predictions, IRAD reduces the number of cases that ZDOCK and ZRANK do not find hits for by nearly 40 and 30%, respectively.
Figure 4 shows the success rates separated for docking difficulty and biological function. As the majority of the cases in our testing/training sets are rigid-body, the rigid-body curves in Figure 4 are very similar to the curves for the overall success rate in Figure 3. For the cases of medium difficulty, the IRAD performance is considerably better than ZRANK, which may be due to the residue-based potentials not being sensitive to the exact atomic positions, and are therefore better able to implicitly deal with conformational changes. The performance of ZDOCK 3.0 for medium difficulty cases is slightly better than that of IRAD. This is likely due to that the training set of IRAD was dominated by rigid-body cases. Looking at the success rates separately by biological function, we see that IRAD improves upon ZDOCK and ZRANK for all types of complex. The extents of improvement are similar, although slightly more pronounced for antibody–antigen complexes. The results in Figure 4 indicate that the IRAD scoring function is well balanced for the various types of docking problems.
Figure 4.

Success rates of the original ZDOCK (ZD), ZRANK (ZR), and IRAD, separately for rigid body cases (R) and cases of medium difficulty (M), and separately for enzyme-inhibitor (E), antigen–antibody (A), and other cases (O).
On average, the top 1000 ZDOCK predictions has 838 redundant predictions according to a simple clustering (pruning) approach with 6 Å radius.20 Therefore, an exhaustive docking search is often followed by a clustering step. In Figure S1 we show the effect of clustering on the success rates for ZDOCK and IRAD, where we used the final version that is trained on the entire BM3. We see that clustering improves the success rates for both ZDOCK and IRAD, but the improvement is more pronounced for ZDOCK. For IRAD, we either cluster before reranking (NR-IRAD), or we cluster after reranking (IRAD-NR). The success rate is better with the latter, especially for small numbers of predictions. As the computational cost of reranking is small compared with the exhaustive search, the preferred procedure is to rerank the entire set of predictions, including redundancies, before a clustering/pruning step.
We also tested IRAD, trained on the ZDOCK decoys, for ranking decoys generated with an algorithm other than ZDOCK. The Dockground36 set contains 61 test cases, with at least one near-native prediction and 100 non-native predictions for each test case. We scored the decoys with the ZDOCK, ZRANK, and IRAD scoring functions, and show the success rates in Figure 5. IRAD outperforms ZDOCK and ZRANK with the Dockground decoy set, as it did with the ZDOCK decoy set.
Figure 6.

Success rates (15 degree sampling) of the original ZDOCK, ZRANK, and IRAD for cross-docking a set of 32 monomers that are known to form 16 complexes.
Cross-docking
In the previous section, we tested the scoring functions on the ability to predict the binding mode of two proteins that are known to form a complex. We also wanted to test whether IRAD can be used to predict whether two proteins form a complex. In this section we present a preliminary test of our scoring functions to distinguish binding and nonbinding protein pairs. We use the 16 complexes for which the first prediction using ZDOCK is a hit, representing the most rigid cases from our benchmark. We used ZDOCK to “cross-dock” the monomers, thus docking each of the 32 monomers with all the other monomers. We use 15 degree sampling, which results in 3600 decoys for each docked pair. The total number of decoys in which a given monomer is represented is thus 31 × 3600 = 111,600.
We optimized the IRAD weights using the remaining 80 test cases that yield at least one hit using ZDOCK, as described in Methods, using the correctly paired (not cross-docked) decoys. Figure 5 shows the success rate for finding a hit (a near-native complex is defined as a correct complex with the correct arrangement) in the 111,600 predictions for each monomer, ranked according to ZDOCK, ZRANK, and IRAD. ZDOCK and ZRANK show behavior similar to that for docking known complexes (Fig. 3), with ZDOCK performing better for smaller numbers of predictions, and ZRANK for larger numbers of predictions. IRAD, on the other hand, shows a much larger improvement compared with docking known pairs (Fig. 3). For over 30% of the cases, the top ranked prediction (out of 111,600) is with the correct binding partner, whereas this is below 15 and 5% for ZDOCK and ZRANK, respectively. For larger numbers of predictions, around 1000, ZRANK and IRAD perform similarly, with success rates over 80%. This high success rate is particularly encouraging considering the 1000 top ranked predictions represent less than 1% of the total number of predictions for each monomer.
Methods
ZRANK
As described in our early publication,24 ZRANK uses a linear combination of energy terms with optimized weights Wn:
| (1) |
The van der Waals interaction (vdW) and electrostatic interactions (Q) are separated into repulsive (rep) and attractive (atr) terms, and are calculated using parameters from the CHARMM19 force field.37 The cutoff for van der Waals interactions is 8 Å, and a linearization is used for short-range interactions.38 The electrostatic interaction is further separated in a short-range term (sr, below 5 Å, and distances below 4 Å are set to 4 Å to avoid singularities) and long-range term (lr, 5–12 Å). The long-range term is calculated using only charged residues, with charges located on the charged atoms only. The ACE term is a statistical contact potential derived using monomeric protein structures.27 In ZDOCK 2.3,5 we used the nonpairwise approximation of ACE to increase computational efficiency, but for ZRANK the original formulation is applied. For ZRANK, the terms are calculated for all nonhydrogen atoms and polar hydrogen atoms.
In the current work, we added residue-based terms to the existing set of ZRANK terms, as described later. We also tested the atom-based terms from ZDOCK 3.0. These are the van der Waals term separated into attractive and repulsive components, electrostatics, and the atom-based statistical potential IFACE.18 IFACE was shown to improve ZDOCK performance much, but was developed after ZRANK and therefore not included in the original ZRANK. IFACE was part of the more recent development of ZRANK (version 2.0) that was designed for reranking structurally refined complex structures.15 ZDOCK terms are evaluated on a grid, but we tested the nongrid version of the IFACE terms for this work as well because ZRANK does not use a grid. Because exploratory calculations showed that using a single weight for the attractive and repulsive electrostatic interactions does not compromise performance, we used two electrostatic terms (short range and long range) instead of the four terms in Eq. (1).
Decoy set and optimization of weights
The complexes for testing and training were obtained from a widely used protein–protein docking benchmark developed by our lab (version 3.0).5,17,33,34 We generated decoy sets with ZDOCK 3.0,18 because this is the best performing ZDOCK version, and we wanted our reranking algorithm to be able to improve upon it. We used 6° sampling, resulting in 54,000 predictions for each complex. Because our algorithm only changes the rank, and not the structure of a predicted complex, it can only be successful if the initial-stage docking algorithm provides at least one correct prediction. Ninety seven cases from the benchmark did generate at least one near-native complex with ZDOCK 3.0, of which we used 96 cases (excluding the largest complex, which required very long computational time) for our training and testing. Of these, 83 and 13 cases were in the rigid-body and medium difficulty categories, respectively. Except when indicated, we used 8-fold cross-validation for training and testing to generate the results presented below. The 96 cases were randomly divided in eight groups, and for testing on each group the weights were optimized using the complexes in the remaining seven groups. This ensures that each complex is tested only once, thus the results are not biased toward specific complexes. Hydrogen atoms were added to the structures using Rosetta,38 and we calculated the potentials for each decoy using a modified version of our ZRANK program. We used a downhill simplex35 algorithm to optimize the weights of the terms in the scoring function. Each optimization is started from random weights, and we rebuilt and perform simplex optimization four times with very tight convergence. Because the downhill simplex algorithm converges to a local minimum, we repeated the optimization with different random starting weights, and considered the global minimum when the two best local minima did not differ more than a threshold (0.002 in the target function, with the function returning values between 0 and 1, as described below). This typically required several hundred downhill simplex runs for each combination of energy terms. The computational time needed for the optimization of the weights depends strongly on the number of terms that are included. We were therefore limited to optimize a maximum of 10 energy terms simultaneously.
The goal of computational docking is to predict near-native complexes, or ‘hits’. We define a hit as a complex of which the interface Cα atoms have a root-mean-square-distance (RMSD) of less than 2.5 Å from the native complex. We chose the integrative success rate (ISR; as defined above, obtained from the success rate plotted against the logarithm of the number of predictions) as the function to be optimized by the simplex algorithm. This is, in fact, the plot often used for visually assessing docking performance, including in this work. Using the logarithm of the number of predictions gives larger weight to improvements in the top predictions. For the training we relaxed the cutoff for a hit to 5.0 Å (but did not do so for testing), as this improves the stability of the optimization procedure. For computational efficiency, we only use the top 200 predictions in the optimization function.
Residue-based potentials
We considered four residue-based pair potentials from the literature, three of which were developed for docking, one for folding. Apart from each being derived from different datasets, they differ in the way contacts between residues are defined, the reference state, and the number of interaction sites per residue. We also included a nonpairwise potential based only on interface residue propensities. Below are detailed descriptions.
Glaser, Steinberg, Vakser-Ben, and Tal28 presented a knowledge-based statistical pair potential for docking, where interface residue composition is used for the reference state. Each residue has a single interaction site located on the Cβ, or Cα for glycine. Residues are defined as in contact when the distance between the interaction sites is 6 Å or less.
Tobi and Bahar29 optimized their pair potential directly for discriminating hits from nonhits in a docking decoy set, avoiding the need of an explicit reference state. They used three interaction sites: the side-chain centroid, as well as the backbone amide nitrogen and carbonyl oxygen. The backbone interaction sites are not residue specific, yielding a total number of 253 independent parameters. The cutoffs for contacts are 4.0 Å for interactions between backbone sites, 5.6 Å for interactions between side-chain site and backbone sites, and 6.8 Å between side-chain sites.
Lu, Lu, and Skolnick30 published a statistical pair potential for docking, with the reference state based on surface residues. Two residues are defined as contacting if at least one heavy atom from one residue is closer than 4.5 Å to a heavy atom from the other residue.
In addition to the potentials developed for docking, we also tested the pair potential for residue side chains from the I-TASSER algorithm for protein folding by Zhang, Kolinski, and Skolnick31. In their potential each residue has three interaction sites: Cα, Cβ, and the center of mass of the remaining side chain atoms (or Cα and Cβ for glycine and alanine, respectively). The center of mass is parameterized for the local coordinate system defined by the three consecutive Cα's and whether the main chain is compact or extended. As our docking algorithm is of atomic resolution, we also implemented the potential by computing the actual center of mass (ZKS/a). Besides the side chain pair potential, the ZKS potential as used for folding includes strong repulsive terms, which are not appropriate for the structures generated with the rigid-body docking algorithm ZDOCK that we attempt to rerank. Unlike the potentials for docking are described earlier, the parameters in ZKS side chain potential are specific for residues that are parallel, antiparallel, and perpendicular in their backbone structures. In addition, also the cutoff distances are specific to the types of the residues in the pair.
We tested the nonpairwise potential based on interface propensities from Chakrabarti and Janin.32 They used the change in solvent accessible surface area between the separated monomers and the complex to determine the interface residues, and distinguished between residues that became completely buried (the core) or partially buried (the rim). For the five-pair potentials described earlier, we used the definitions and cutoffs from the original developments to determine the residues that interact. Calculating accessible surface areas for the CJ potential, however, is computationally expensive, thus we instead used the contact definitions from each of the five-pair potentials to determine the interface residues. For simplicity, we did not distinguish between rim and core residues, and only used the propensities for the latter.
As we did not know to what extent each potential favored total number of interactions, we normalized the potentials by adding a term to the optimization that is simply the total number of pairwise interactions (for the pair potentials) or the total number of residues in the interface (for CJ).
After calculating the values for all the decoys for all the complexes, we divided the potentials by their standard deviations. This makes the values comparable, and allows us to interpret the weights in the resulting scoring functions. We separately combined each term with the ZRANK terms, and optimized the weights. We then combined various terms to investigate whether performance improvements were additive.
Conclusions
We have shown that the IRAD scoring function improves considerably over ZDOCK and ZRANK, with an absolute gain in success rate of about 10%, and reducing the number of cases for which ZDOCK and ZRANK do not find hits by up to 40% for the top 1000 predictions. IRAD combines atom-based and residue-based potential terms. The resulting scoring function is balanced for the different types of complexes. The current scoring function is determined using decoys obtained with ZDOCK 3.0, and is therefore intended to be used in a docking pipeline with ZDOCK 3.0. However, the weights in the scoring function can be reoptimized using decoys generated with other docking programs. The cross-docking exploratory results are very promising, and further investigations are in progress.
The largest difference in performance between ZRANK and IRAD is for the complexes of medium docking difficulty. This may be due to the residue-based potentials being ‘softer’ than atom-based potentials, and therefore are better able to implicitly deal with geometric changes in the binding process. This aspect is particularly useful for generating predictions that are subjected to further refinement using explicit conformational searches.
The implementation of the IRAD scoring function is available on our internet site http://zlab.umassmed.edu. The weights used in this program were obtained by training with all the cases of Benchmark 3.0.
Acknowledgments
The authors thank Brian Pierce (University of Massachusetts Medical School) and Yang Zhang (University of Michigan) for helpful discussions.
Supplementary material
References
- 1.Comeau SR, Gatchell DW, Vajda S, Camacho CJ. ClusPro: an automated docking and discrimination method for the prediction of protein complexes. Bioinformatics. 2004;20:45–50. doi: 10.1093/bioinformatics/btg371. [DOI] [PubMed] [Google Scholar]
- 2.Ritchie DW, Kozakov D, Vajda S. Accelerating and focusing protein-protein docking correlations using multi-dimensional rotational FFT generating functions. Bioinformatics. 2008;24:1865–1873. doi: 10.1093/bioinformatics/btn334. [DOI] [PMC free article] [PubMed] [Google Scholar]
- 3.Lyskov S, Gray JJ. The RosettaDock server for local protein-protein docking. Nucleic Acids Res. 2008;36:W233–W238. doi: 10.1093/nar/gkn216. [DOI] [PMC free article] [PubMed] [Google Scholar]
- 4.Dominguez C, Boelens R, Bonvin A. HADDOCK: a protein-protein docking approach based on biochemical or biophysical information. J Am Chem Soc. 2003;125:1731–1737. doi: 10.1021/ja026939x. [DOI] [PubMed] [Google Scholar]
- 5.Chen R, Li L, Weng ZP. ZDOCK: an initial-stage protein-docking algorithm. Proteins. 2003;52:80–87. doi: 10.1002/prot.10389. [DOI] [PubMed] [Google Scholar]
- 6.Vakser IA. Protein docking for low-resolution structures. Protein Eng. 1995;8:371–377. doi: 10.1093/protein/8.4.371. [DOI] [PubMed] [Google Scholar]
- 7.Mandell JG, Roberts VA, Pique ME, Kotlovyi V, Mitchell JC, Nelson E, Tsigelny I, Ten Eyck LF. Protein docking using continuum electrostatics and geometric fit. Protein Eng. 2001;14:105–113. doi: 10.1093/protein/14.2.105. [DOI] [PubMed] [Google Scholar]
- 8.Katchalskikatzir E, Shariv I, Eisenstein M, Friesem AA, Aflalo C, Vakser IA. Molecular-surface recognition—determination of geometric fit between protein and their ligands by correlation techniques. Proc Natl Acad Sci USA. 1992;89:2195–2199. doi: 10.1073/pnas.89.6.2195. [DOI] [PMC free article] [PubMed] [Google Scholar]
- 9.Gabb HA, Jackson RM, Sternberg MJE. Modelling protein docking using shape complementarity, electrostatics, and biochemical information. J Mol Biol. 1997;272:106–120. doi: 10.1006/jmbi.1997.1203. [DOI] [PubMed] [Google Scholar]
- 10.Vakser IA, Matar OG, Lam CF. A systematic study of low-resolution recognition in protein-protein complexes. Proc Natl Acad Sci USA. 1999;96:8477–8482. doi: 10.1073/pnas.96.15.8477. [DOI] [PMC free article] [PubMed] [Google Scholar]
- 11.Norel R, Lin SL, Wolfson HJ, Nussinov R. Molecular-surface complementarity at protein-protein interfaces—the critical role played by surface normals at well placed, sparse, points in docking. J Mol Biol. 1995;252:263–273. doi: 10.1006/jmbi.1995.0493. [DOI] [PubMed] [Google Scholar]
- 12.Shen Y, Paschalidis IC, Vakili P, Vajda S. Protein docking by the underestimation of free energy funnels in the space of encounter complexes. Plos Comput Biol. 2008;4:e1000191. doi: 10.1371/journal.pcbi.1000191. [DOI] [PMC free article] [PubMed] [Google Scholar]
- 13.Andrusier N, Mashiach E, Nussinov R, Wolfson HJ. Principles of flexible protein-protein docking. Proteins. 2008;73:271–289. doi: 10.1002/prot.22170. [DOI] [PMC free article] [PubMed] [Google Scholar]
- 14.Zacharias M. Accounting for conformational changes during protein-protein docking. Curr Opin Struct Biol. 2010;20:180–186. doi: 10.1016/j.sbi.2010.02.001. [DOI] [PubMed] [Google Scholar]
- 15.Pierce B, Weng Z. A combination of rescoring and refinement significantly improves protein docking performance. Proteins. 2008;72:270–279. doi: 10.1002/prot.21920. [DOI] [PMC free article] [PubMed] [Google Scholar]
- 16.Chen R, Weng ZP. Docking unbound proteins using shape complementarity, desolvation, and electrostatics. Proteins. 2002;47:281–294. doi: 10.1002/prot.10092. [DOI] [PubMed] [Google Scholar]
- 17.Mintseris J, Wiehe K, Pierce B, Anderson R, Chen R, Janin J, Weng ZP. Protein-protein docking benchmark 2.0: an update. Proteins. 2005;60:214–216. doi: 10.1002/prot.20560. [DOI] [PubMed] [Google Scholar]
- 18.Mintseris J, Pierce B, Wiehe K, Anderson R, Chen R, Weng Z. Integrating statistical pair potentials into protein complex prediction. Proteins. 2007;69:511–520. doi: 10.1002/prot.21502. [DOI] [PubMed] [Google Scholar]
- 19.Chen R, Tong WW, Mintseris J, Li L, Weng ZP. ZDOCK predictions for the CAPRI Challenge. Proteins. 2003;52:68–73. doi: 10.1002/prot.10388. [DOI] [PubMed] [Google Scholar]
- 20.Hwang H, Vreven T, Pierce BG, Hung J-H, Weng Z. Performance of ZDOCK and ZRANK in CAPRI rounds 13–19. Proteins. 2010;78:3104–3110. doi: 10.1002/prot.22764. [DOI] [PMC free article] [PubMed] [Google Scholar]
- 21.Janin J, Henrick K, Moult J, Ten Eyck L, Sternberg MJE, Vajda S, Vasker I, Wodak SJ. CAPRI: a critical assessment of predicted interactions. Proteins. 2003;52:2–9. doi: 10.1002/prot.10381. [DOI] [PubMed] [Google Scholar]
- 22.Wiehe K, Pierce B, Tong WW, Hwang H, Mintseris J, Weng Z. The performance of ZDOCK and ZRANK in rounds 6–11 of CAPRI. Proteins. 2007;69:719–725. doi: 10.1002/prot.21747. [DOI] [PubMed] [Google Scholar]
- 23.Lensink MF, Wodak SJ. Docking and scoring protein interactions: CAPRI 2009. Proteins. 2010;78:3073–3084. doi: 10.1002/prot.22818. [DOI] [PubMed] [Google Scholar]
- 24.Pierce B, Weng Z. ZRANK: reranking protein docking predictions with an optimized energy function. Proteins. 2007;67:1078–1086. doi: 10.1002/prot.21373. [DOI] [PubMed] [Google Scholar]
- 25.Murphy J, Gatchell DW, Prasad JC, Vajda S. Combination of scoring functions improves discrimination in protein–protein docking. Proteins. 2003;53:840–854. doi: 10.1002/prot.10473. [DOI] [PubMed] [Google Scholar]
- 26.Kowalsman N, Eisenstein M. Combining interface core and whole interface descriptors in postscan processing of protein–protein docking models. Proteins. 2009;77:297–318. doi: 10.1002/prot.22436. [DOI] [PubMed] [Google Scholar]
- 27.Zhang C, Vasmatzis G, Cornette JL, DeLisi C. Determination of atomic desolvation energies from the structures of crystallized proteins. J Mol Biol. 1997;267:707–726. doi: 10.1006/jmbi.1996.0859. [DOI] [PubMed] [Google Scholar]
- 28.Glaser F, Steinberg D, Vakser I, Ben-Tal N. Residue frequencies and pairing preferences at protein–protein interfaces. Proteins. 2001;43:89–102. [PubMed] [Google Scholar]
- 29.Tobi D, Bahar I. Optimal design of protein docking potentials: efficiency and limitations. Proteins. 2006;62:970–981. doi: 10.1002/prot.20859. [DOI] [PubMed] [Google Scholar]
- 30.Lu H, Lu L, Skolnick J. Development of unified statistical potentials describing protein–protein interactions. Biophys J. 2003;84:1895–1901. doi: 10.1016/S0006-3495(03)74997-2. [DOI] [PMC free article] [PubMed] [Google Scholar]
- 31.Zhang Y, Kolinski A, Skolnick J. TOUCHSTONE II: a new approach to ab initio protein structure prediction. Biophys J. 2003;85:1145–1164. doi: 10.1016/S0006-3495(03)74551-2. [DOI] [PMC free article] [PubMed] [Google Scholar]
- 32.Chakrabarti P, Janin J. Dissecting protein–protein recognition sites. Proteins. 2002;47:334–343. doi: 10.1002/prot.10085. [DOI] [PubMed] [Google Scholar]
- 33.Hwang H, Pierce B, Mintseris J, Janin J, Weng ZP. Protein–protein docking benchmark version 3.0. Proteins. 2008;73:705–709. doi: 10.1002/prot.22106. [DOI] [PMC free article] [PubMed] [Google Scholar]
- 34.Hwang H, Vreven T, Janin J, Weng Z. Protein–protein docking benchmark version 4.0. Proteins. 2010;78:3111–3114. doi: 10.1002/prot.22830. [DOI] [PMC free article] [PubMed] [Google Scholar]
- 35.Press WH. Numerical recipes in C: the art of scientific computing. New York: Cambridge University Press; 2002. [Google Scholar]
- 36.Liu SY, Gao Y, Vakser IA. DOCKGROUND protein–protein docking decoy set. Bioinformatics. 2008;24:2634–2635. doi: 10.1093/bioinformatics/btn497. [DOI] [PMC free article] [PubMed] [Google Scholar]
- 37.Neria E, Fischer S, Karplus M. Simulation of activation free energies in molecular systems. J Chem Phys. 1996;105:1902–1921. [Google Scholar]
- 38.Gray JJ, Moughon S, Wang C, Schueler-Furman O, Kuhlman B, Rohl CA, Baker D. Protein–protein docking with simultaneous optimization of rigid-body displacement and side-chain conformations. J Mol Biol. 2003;331:281–299. doi: 10.1016/s0022-2836(03)00670-3. [DOI] [PubMed] [Google Scholar]
Associated Data
This section collects any data citations, data availability statements, or supplementary materials included in this article.