

Abstract
Nucleophosmin (NPM/B23) is a multifunctional oncoprotein whose protein expression levels dictate cellular growth and proliferation rates. NPM is translationally responsive to hyperactive mammalian target of rapamycin (mTOR) signals, but the mechanism of this regulation is not understood. Using chimeric translational reporters, we found that the 3’ untranslated region (UTR) of the NPM mRNA is sufficient to mediate its translational modulation by mTOR signalling. We show that far upstream element (FUSE)-binding protein 1 (FBP1) interacts specifically with the 3’ UTR of NPM to repress translation. Overexpression of FBP1 resulted in translational repression of NPM mRNAs, while depletion of FBP1 caused a dramatic increase in NPM translation and resulted in enhanced overall cell proliferation. Thus, we propose that FBP1 is a key regulator of cell growth and proliferation through its ability to selectively bind the NPM 3’ UTR and repress NPM translation.
Keywords: FBP1, Nucleophosmin, Ribosome Biogenesis, Translation
Introduction
Translational regulation functions as a critical mode by which cells direct protein expression. Translational control of select mRNAs is often mediated by regulatory proteins that interact with sequence elements within the 5’ and/or 3’ UTRs of transcripts (Gebauer and Hentze, 2004). Compared to regulatory protein-RNA interactions in the 3’ UTR, however, those in the 5’ UTR are relatively rare (Jackson et al., 2010). Consistent with this notion, numerous studies have demonstrated important regulatory protein-mRNA interactions in the 3’ UTRs of various transcripts (Brennan and Steitz, 2001; de Moor et al., 2005; Galban et al., 2008; Hamilton et al., 2008; Irwin et al., 1997; Mazan-Mamczarz et al., 2003; Wickens et al., 2002; Zhang et al., 2002). Thus, it is clear that UTRs, and particularly the 3’ UTR, are essential regulators of the protein expression machinery.
Nucleophosmin (NPM/B23) is a nucleolar oncoprotein involved in a myriad of central cellular processes, including ribosome biogenesis (Okuwaki et al., 2002), protein chaperoning (Okuwaki et al., 2001), centrosome duplication (Okuda et al., 2000), transcriptional regulation (Colombo et al., 2002), and cellular growth and proliferation (Brady et al., 2004; Grisendi et al., 2005; Grisendi et al., 2006). NPM plays a crucial role in modulating the rate of 40S and 60S ribosomal subunit export from the nucleolus/nucleus to the cytoplasm, thereby functioning as a chaperone for the ribosome (Maggi et al., 2008; Yu et al., 2006). Through this mechanism, NPM is able to enhance protein synthesis and promote cellular growth (Maggi et al., 2008). NPM is overexpressed in several neoplasms, such as ovarian, colon, prostate, bladder, and gastric cancers (Qi et al., 2008; Sandsmark et al., 2007). As a potent oncoprotein, it is important to understand the regulation of NPM expression.
Previous data demonstrated that NPM protein expression is induced by hyperactive mTOR signalling caused by either overexpression of constitutively active H-Ras or loss of Tsc1 (Pelletier et al., 2007). Induction of NPM protein expression is clearly mTOR-dependent, as NPM induction was abrogated upon treatment with rapamycin, a selective inhibitor of mTOR (Wullschleger et al., 2006), or overexpression of TSC1 (Pelletier et al., 2007). Interestingly, NPM mRNA expression is insensitive to rapamycin, suggesting that NPM is regulated primarily at the level of translation.
Here, we establish that NPM expression is controlled translationally and that the NPM 3’ UTR alone is sufficient to impart endogenous NPM-like translational modulation onto a luciferase reporter open reading frame (ORF). Additionally, we identify FBP1 as a novel NPM 3’ UTR mRNA-binding protein that represses translation of the NPM transcript. Through modulation of NPM, FBP1 plays an important role in the regulation of cell growth and proliferation.
Results
Inhibition of mTOR induces NPM mRNA exclusion from actively translating ribosomes
Signals emanating from hyperactivated mTOR signalling stimulate the translation of NPM, resulting in increased NPM protein expression in the absence of significant changes in NPM mRNA levels (Pelletier et al., 2007). To further examine the apparent translational control of NPM, Tsc1−/−p53−/− mouse embryonic fibroblasts (MEFs), which display activated mTOR (Tee et al., 2002), were treated with rapamycin. NPM protein induction was attenuated upon rapamycin treatment (Figure 1a), even in the presence of slightly elevated levels of NPM transcripts (Supplementary Figure 1a), indicating that the rapamycin-induced reduction in NPM protein expression is not due to reduced cellular NPM mRNAs.
Figure 1.

Translation of NPM mRNAs is abrogated upon inhibition of mTOR. Tsc1−/−p53−/− MEFs were treated with vehicle (−) or rapamycin (+). (a) Rapamycin treatment results in reduced NPM protein levels. (b) Polysome formation is decreased in cells treated with rapamycin. (c) NPM mRNAs are excluded from actively translating polysomes upon treatment with rapamycin. Monosome/disome- and polysome-associated NPM mRNAs were measured by qRT-PCR and were calculated as percentage of total NPM mRNAs. Data are mean ± s.d. of three independent experiments. (d) Monosomal/disomal and polysomal distributions of GAPDH mRNAs are unaffected by rapamycin. GAPDH mRNAs measured by qRT-PCR from RNA extracted from sucrose gradient fractions are shown as percentage of total GAPDH mRNAs. Values are mean ± s.d. of three independent experiments.
We hypothesized that rapamycin treatment might result in the exclusion of NPM mRNAs from actively translating polyribosomes, or polysomes. To test this, cytosolic ribosomes were isolated by sucrose gradient centrifugation from equal numbers of Tsc1−/−p53−/− MEFs treated with vehicle or rapamycin. Ribosomal subunits were detected by continuous measurement of RNA absorbance (A254nm). Treatment with rapamycin dramatically reduced the overall formation of polysomes actively engaged in mRNA translation (Figure 1b). To evaluate the distribution of NPM transcripts in monosomes/disomes and polysomes, NPM mRNA levels in sucrose gradient fractions were measured by quantitative real-time PCR (qRT-PCR). Strikingly, despite a modest increase in the total cellular pool of NPM mRNAs in rapamycin-treated cells compared to vehicle-treated cells (Supplementary Figure 1a), the percentage of NPM transcripts associated with actively translating polysomes was dramatically diminished upon rapamycin treatment (Figure 1c). Accumulation of NPM mRNAs was apparent in monosomes/disomes, particularly 80S fractions, in cells treated with rapamycin (Figure 1c), which is consistent with previous studies (Jefferies et al., 1997). To test that our findings for NPM were specific for an mRNA that is translationally responsive to mTOR signals, we treated cells with rapamycin and analyzed GAPDH mRNAs. Rapamycin had no effect on the distribution of GAPDH mRNAs in monosome/disome or polysome fractions (Figure 1d), consistent with previous findings (Terada et al., 1994). Importantly, unchanged GAPDH transcript distribution upon rapamycin treatment suggests that inhibition of mTOR did not globally affect all cellular mRNA translation, which is in accordance with previous reports (Mendez et al., 1996). Taken together, these data indicate that NPM expression is responsive to hyperactive mTOR signalling at the level of translation.
The NPM 3’ UTR is sufficient to confer NPM-like translational regulation properties to a luciferase open reading frame
Recognition and binding of elements within the 5’ and 3’ UTRs of mRNAs by regulatory proteins is a common mechanism underlying selective mRNA translational control (Gebauer and Hentze, 2004). Indeed, previous reports have indicated that various mRNAs are subject to such regulation (Irwin et al., 1997; Jiang et al., 2006; Pontrelli et al., 2004; Sidiropoulos et al. , 2007; Takagi et al. , 2005; Zhang et al., 2008). To determine whether a comparable mechanism may be responsible for the translational regulation of NPM, we first identified the 5’ UTR sequence of the NPM transcript by rapid amplification of cDNA ends (RACE) (Supplementary Figure 2a; GenBank accession number GU214027). Like the human NPM 5’ UTR (Meyuhas, 2000), RACE revealed that the murine NPM 5’ UTR contains a canonical terminal oligopyrimidine tract (TOP) also contained in the 5’ UTRs of transcripts encoding ribosomal proteins, elongation factors, and other components of the translational machinery (Proud, 2007; Proud, 2009). For use as a control, we utilized RACE to determine the sequence of the GAPDH 5’ UTR (GenBank accession number GU214026). We attained the complete NPM and GAPDH 3’ UTR sequences from GenBank (accession numbers BC054755.1 and NM_008084.2, respectively) (Supplementary Figure 2a).
To investigate whether the NPM 5’ and 3’ UTRs may be important for regulation of the NPM mRNA, we sought to evaluate whether the NPM 5’ and 3’ UTRs were sufficient to modulate translation of another ORF in a manner equivalent to translational regulation of the NPM ORF. Specifically, we wanted to determine whether fusion of the NPM 5’ and 3’ UTRs to a firefly luciferase (Fluc) ORF rendered Fluc expression sensitive to rapamycin. To test this, Tsc1−/−p53−/− MEFs were transduced with plasmids encoding NPM 5’ and 3’ UTR-flanked Fluc(NPM 5’ -luc-NPM 3’; Supplementary Figure 2b). Although NPM 5’-luc-NPM 3’ protein activity increased over the duration of serum stimulation, this induction was greatly attenuated in the presence of rapamycin compared to vehicle (Figure 2a). As demonstrated with endogenous NPM (Pelletier et al., 2007) (Figure 1a; Supplementary Figure 1a), these data indicate that NPM 5’-luc-NPM 3’ activity is driven by changes in translation rather than transcription. To examine whether the rapamycin-induced reduction of NPM 5’-luc-NPM 3’ activity was specific for an mTOR-regulated mRNA, Tsc1−/−p53−/− MEFs were transduced with plasmids encoding GAPDH 5’ and 3’ UTR-flanked Fluc (GAPDH 5’-luc-GAPDH 3’; Supplementary Figure 2b). Notably, rapamycin failed to affect GAPDH 5’-luc-GAPDH 3’ activity at any time point evaluated (Figure 2b).
Figure 2.

The NPM 3’ UTR is sufficient to confer NPM-like translational control to a luciferase ORF. (a–d) Tsc1−/−p53−/− MEFs were transfected with plasmids depicted in Supplementary Figure 2b. Cells were serum starved and then incubated with 10% serum in the presence or absence of rapamycin for the indicated durations. Plasmid expressing CMV-driven Renilla luciferase (Rluc) was used as an internal control for transfection efficiency. Photon flux was calculated by normalizing firefly luciferase (Fluc) activity to Rluc activity. Levels of Fluc mRNA at each time point were measured by qRT-PCR from total RNA isolated from transfected MEFs. Shown is photon flux normalized to Fluc mRNA levels. Data are mean ± s.d. of quadruplicate samples per condition from three independent experiments (* P < 0.05, ** P < 0.005, Student’s t-test). (a) Rapamycin reduces NPM 5’ UTR-Fluc-NPM 3’ UTR activity. (b) Activity of GAPDH 5’ UTR-Fluc-GAPDH 3’ UTR is unchanged upon treatment with rapamycin. (c) Rapamycin has no effect on NPM 5’ UTR-Fluc-GAPDH 3’ UTR activity. (d) Activity of GAPDH 5’ UTR-Fluc-NPM3’ UTR is abrogated upon rapamycin treatment.
To examine the independent roles of each NPM UTR as potential targets of regulation, we generated chimeric reporters by fusing the NPM 5’ UTR and the GAPDH 3’ UTR or the GAPDH 5’ UTR and the NPM 3’ UTR to the respective ends of the Fluc ORF (Supplementary Figure 2b). Surprisingly, NPM 5’-luc-GAPDH 3’ activity resembled GAPDH 5’-luc-GAPDH 3’ activity, with rapamycin having no effect at any time point measured (Figure 2c). GAPDH 5’-luc-NPM 3’ activity, however, demonstrated rapamycin sensitivity similar to that observed with NPM 5’-luc-NPM 3’ activity (Figure 2d). Collectively, these data suggest that sequences within the NPM 3’ UTR, but not in the NPM 5’ UTR, mediate regulation of NPM mRNA translation, as the NPM 3’ UTR alone was sufficient to render the Fluc ORF rapamycin-sensitive. Given that rapamycin sensitivity of 5’ TOP mRNAs ranges from resistance to marked repression (Patursky-Polischuk et al., 2009), these data are in accordance with the poorly understood role of the 5’ TOP. Our findings are consistent with reports highlighting the paucity of regulatory protein-RNA interactions in the 5’ UTR, but the abundance of examples for 3’ UTR-protein regulation (Jackson et al. , 2010).
FUSE-binding protein 1 (FBP1) interacts specifically with the NPM 3’ UTR
Although reporter assay data (Figure 2a–d) indicated that only the NPM 3’ UTR is important for modulation of the NPM mRNA, we undertook an unbiased approach to screen for putative regulatory binding proteins of the NPM 5’ and 3’ UTRs. We utilized an RNA pull-down assay coupled to mass spectrometry to identify proteins that bind the NPM 5’ or 3’ UTR. Whole cell lysates prepared from Tsc1−/−p53−/− MEFs treated with vehicle or rapamycin were incubated with biotinylated NPM 5’ UTR or 3’ UTR RNA. Several proteins were found to preferentially interact with the NPM 3’ UTR, but none appeared to bind exclusively to the NPM 5’ UTR, consistent with reporter assay findings (Figure 3a, arrows). We next employed mass spectrometry to identify putative NPM 3’ UTR binding proteins and confirmed their identities as FBP1, FBP2 (also known as KHSRP or KSRP), and heterogeneous nuclear ribonucleoprotein (hnRNP) A/B (Figure 3a; Supplementary Figure 3). Since the A/B subfamily of hnRNPs refers to several promiscuous, multifunctional RNA binding proteins (He and Smith, 2009), subsequent experiments focused on evaluating the roles of FBPs in NPM translational regulation.
Figure 3.
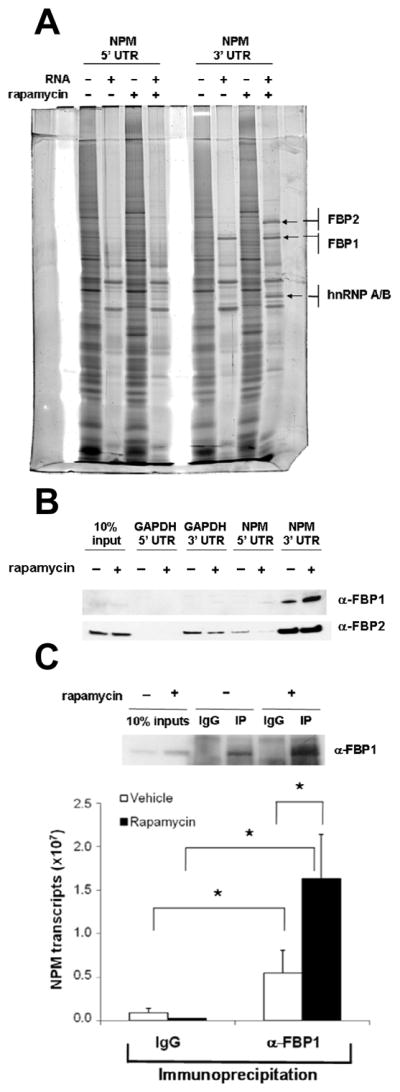
FUSE-binding protein 1 (FBP1) interacts specifically with the NPM 3’ UTR. (a) Identification of NPM 3’ UTR binding proteins. Lanes indicated as RNA (−) represent samples pre-cleared with streptavidin sepharose. Arrows indicate proteins selected as putative regulatory binding proteins of the NPM 3’ UTR, and identified proteins are shown. (b) FBP1 specifically interacts with the NPM 3’ UTR. (c) Endogenous NPM mRNAs preferentially bind FBP1 in rapamycin-treated cells. FBP1 was immunoprecipitated from vehicle-treated (−) or rapamycin-treated (+) Tsc1−/−p53−/− MEF lysates with anti-FBP1 antibody. Non-immune goat serum (IgG) was used as a control. NPM mRNA from immunoprecipitates was measured by qRT-PCR. Data are mean ± s.d. of triplicate samples from three independent experiments (* P < 0.05, Student’s t-test).
The FBP family is most noted for its transcriptional activation of c-myc (Duncan et al., 1994; He et al., 2000); however, the FBPs have also been reported to bind several RNAs, though in in-vitro studies only (Chung et al., 2006). To evaluate FBP binding specificity, we incubated biotinylated GAPDH 5’ UTR, GAPDH 3’ UTR, NPM 5’ UTR, or NPM 3’ UTR RNA with whole cell lysates from Tsc1−/−p53−/− MEFs treated with vehicle or rapamycin. FBP1 and FBP2 were visualized by Western blot analysis of UTR-precipitated samples (Figure 3b). Although FBP3 was not identified by mass spectrometry (Figure 3a; Supplementary Figure 3), we also analyzed it by immunoblot assay, as it is a member of the highly related FBP protein family. Consistent with analyses from mass spectrometry, however, FBP3 was undetectable. FBP1 was precipitated exclusively by the NPM 3’ UTR (Figure 3b). FBP2 was precipitated predominantly by the NPM 3’ UTR, but also by the GAPDH 3’ UTR and the NPM 5’ UTR in vehicle-treated cells (Figure 3b). The more promiscuous RNA binding by FBP2 is in agreement with previous reports implicating FBP2 in RNA editing, RNA trafficking, RNA stabilization, and RNA decay (Briata et al., 2005; Briata et al., 2003; Gherzi et al., 2004; Kroll et al., 2002; Li et al., 2009; Min et al., 1997; Snee et al., 2002). However, given that the interaction of FBP1 with the NPM 3’ UTR appeared to be specific, especially in the presence of rapamycin, we focused on the role of FBP1 in modulating NPM translation.
We next sought to verify the interaction of FBP1 with endogenous NPM mRNAs. FBP1 was immunoprecipitated from whole cell extracts prepared from Tsc1−/−p53−/− MEFs treated with vehicle or rapamycin (Figure 3c, top). Total RNA was isolated from FBP1 immunoprecipitates, and bound NPM mRNA was measured by qRT-PCR. Significantly higher numbers of NPM transcripts were associated with FBP1 in rapamycin-treated cells versus vehicle-treated cells (Figure 3c, bottom).
FBP1 overexpression represses NPM translation
To explore the functional role of FBP1 in NPM translational regulation, we evaluated the effects of FBP1 overexpression. Ectopic expression of Flag epitope-FBP1 in Tsc1−/−p53−/− MEFs drastically reduced NPM protein levels (Figure 4a). Consistent with FBP1 functioning as a translational regulator of NPM expression, NPM mRNA levels remained unchanged upon FBP1 overexpression (Supplementary Figure 1b). We questioned whether FBP1 overexpression could mimic inhibition of mTOR by reducing polysome-associated NPM transcripts. To test this, cytosolic ribosomes were isolated by sucrose gradient centrifugation from equal numbers of Tsc1−/−p53−/− MEFs transduced with vector or Flag-tagged FBP1. Unlike rapamycin treatment, FBP1 overexpression failed to dramatically diminish the overall formation of polysomes (Figure 4b). Distribution of NPM transcripts in monosome/disome and polysome fractions, however, was analogous to the NPM mRNA distribution observed upon inhibition of mTOR (Figure 4c; Figure 1c). In cells overexpressing FBP1, exclusion of NPM mRNAs from polysomes and accumulation in 80S fractions was visible although less pronounced compared to the shift of NPM transcripts from polysomes to monosomes/disomes measured in rapamycin-treated cells (Figure 4c; Figure 1c). These findings demonstrate that FBP1 represses NPM translation.
Figure 4.

FBP1 overexpression represses NPM translation. (a) Overexpression of FBP1 results in reduced NPM protein levels. (b) Overexpression of FBP1 fails to affect polysome formation. (c) NPM mRNAs are excluded from actively translating polysomes upon FBP1 overexpression. Monosome/disome- and polysome-associated NPM mRNAs were measured by qRT-PCR and were calculated as percentage of total NPM mRNAs. Data are mean ± s.d. of t riplicate samples from three independent experiments.
Depletion of FBP1 enhances NPM translation and cell proliferation
To further investigate the functional role of FBP1 as a translational regulator of NPM expression, we transduced Tsc1−/−p53−/− MEFs with control siRNA or two different siRNAs targeting murine FBP1. The presence of FBP1-siRNA #2 caused a marked reduction in FBP1 protein, whereas FBP1-siRNA #3 yielded a more modest decrease (Figure 5a). Increases in NPM protein expression correlated with the amount of FBP1 reduction, as siRNA #2 resulted in higher NPM induction than that observed with siRNA #3 (Figure 5a). Again, consistent with NPM protein expression being regulated independent of transcription, NPM mRNA levels remained constant in the presence of either siRNA targeting FBP1 (Supplementary Figure 1c).
Figure 5.

FBP1 depletion enhances NPM translation. (a) FBP1 knockdown increases levels of NPM protein. Tsc1−/−p53−/− MEFs were transfected with control siRNA (siCTL) or two different siRNAs targeting FB1. (b) Knockdown of FBP1 results in increased polysome formation. (c) NPM mRNAs are recruited to actively translating polysomes upon FBP1 depletion. Monosomal/disomal and polysomal NPM mRNAs were measured by qRT-PCR and were calculated as percentage of total NPM mRNAs. Data are mean ± s.d. of triplicate samples from three independent experiments. (d) Knockdown of FBP1 leads to enhanced cell proliferation.
We next wanted to determine whether depletion of FBP1 leads to enhanced polysome-associated NPM transcripts. We isolated cytosolic ribosomes by sucrose gradient centrifugation from equal numbers of Tsc1−/−p53−/− MEFs transduced with control siRNA or two siRNAs targeting FBP1. Depletion of FBP1 resulted in elevated formation of polysomes actively engaged in mRNA translation (Figure 5b). As observed with NPM protein induction (Figure 5a), polysome enhancement corresponded with the degree of FBP1 reduction (Figure 5b). Furthermore, also relative to the amount of FBP1 depletion, NPM transcripts associated with actively translating polysomes were dramatically elevated in the presence of siRNAs targeting FBP1 compared to control siRNA (Figure 5c).
Based on the striking enhancement of ribosome recruitment to NPM mRNAs observed upon FBP1 depletion and previous reports demonstrating the ability of NPM to potently promote proliferation (Brady et al., 2009; Maggi et al., 2008), we sought to explore the effects of FBP1-mediated NPM induction on cellular proliferation. In cells depleted of FBP1, we observed increased proliferation rates relative to control siRNA-transfected cells (Figure 5d). Again, enhancement of proliferation correlated with the amount of FBP1 reduction. Taken together, these findings indicate that FBP1 is necessary to restrain NPM translation and, thereby, cell proliferation.
Discussion
Here we have demonstrated that NPM expression is regulated at the level of translation and that the 3’ UTR of the NPM mRNA is sufficient to confer rapamycin sensitivity to a reporter ORF. Further analyses identified FBP1 as a protein that selectively interacts with the NPM 3’ UTR. FBP1 overexpression and knockdown data are consistent with FBP1 functioning to negatively regulate translation of NPM mRNAs.
Though we have demonstrated that NPM mRNAs are largely excluded from polysomes by FBP1, further studies will be needed to provide insight into the precise mechanism by which FBP1 binding to the NPM 3’ UTR negatively regulates NPM translation. It appears that FBP1 represses NPM translation by interfering with translation initiation, as the shift in NPM mRNA distribution from polysomes to monosomes/disomes is indicative of a reduced translation initiation rate (Meyuhas, 2000).
Collectively, our data suggest that FBP1 acts as a suppressor of proliferation through its direct repression of NPM translation. This is consistent with the requirement of NPM expression for continued cellular proliferation and growth both in vitro and in vivo (Brady et al., 2009; Grisendi et al., 2005; Maggi et al., 2008). By targeting NPM, FBP1 appears to at least mimic the functional activity of the ARF tumor suppressor. Numerous studies have shown that ARF binds directly to NPM to inhibit its activity and prevent cell growth (Bertwistle et al., 2004; Brady et al., 2004; Itahana et al., 2003). Through its ability to repress NPM translation, FBP1 also antagonizes NPM to suppress cell growth and proliferation. Of particular interest is the question of whether FBP1, like ARF, utilizes its anti-NPM function to serve as a tumor suppressor.
Materials and methods
Cell culture and transfection
Tsc1−/−p53−/− MEFs were maintained in DMEM supplemented as described previously (Pelletier et al., 2007). For bioluminescence assays, transfections were performed using Lipofectamine 2000transfection reagent ( Invitrogen). All other transfections were carried out using the Nucleofector system (Amaxa) according to the manufacturer’s instructions.
5’ RACE and 3’ UTR sequences
Sequences of the GAPDH and NPM 5’ UTRs were obtained by 5’ RACE using GeneRacer (Invitrogen) according to the manufacturer’s instructions. For the GAPDH 5’ UTR and the NPM 5’ UTR, the forward GeneRacer 5’ nested primer (5’-GGACACTGACATGGACTGAAGGAGTA-3’) was used. For the GAPDH 5’ UTR, we used the following gene-specific reverse primer: 5’-GCATTGCTGACAATCTTGAGTGAGTTG-3’. The following gene-specific reverse primer was used for the NPM 5’ UTR: 5’-CATGTCCATATCCATCGAGTCTTCCAT-3’. Sequences of the GAPDH and NPM 3’ UTRs were obtained from GenBank (accession numbers NM_008084.2 and BC054755.1, respectively).
Plasmids
The GAPDH 5’ UTR, GAPDH 3’ UTR, NPM 5’ UTR, and NPM 3’ UTR were PCR-amplified from genomic DNA of WT C57BL/6 mice. The following primers were used: GAPDH 5’ UTR: forward, 5’-CTCTCTGCTCCTCCCTGTTCCAG-3’; reverse, 5’-TTTGTCTACGGGACGAGGCTG-3’; GAPDH 3’ UTR: forward, 5’-GAAACCCTGGACCACCCACCCC-3’; reverse, 5’-TTTTTTTTTTTTTTTTTTT-3’; NPM 5’ UTR: forward, 5’-CTTTCCTTGGCGTGATTCCG-3’; reverse, 5’-GAGGTGGAGGCGCGCACTT-3’; NPM 3’ UTR: forward, 5’-GAAAAGGGTTTAAACAG-3’; reverse, 5’-TTTTTTTTTTTTTTTTTTT-3’. The GAPDH 5’ UTR, GAPDH 3’ UTR, NPM 5’ UTR, and NPM 3’ UTR PCR products were cloned into the pCR 2.1-TOPO vector (Invitrogen) for use in in-vitro transcription. For bioluminescence assays, the GAPDH 5’ UTR and the NPM 5’ UTR were sub-cloned into the HindIII and NcoI sites of the pGL3-Control vector (Promega). The GAPDH 3’ UTR and the NPM 3’ UTR were sub-cloned into the XbaI and HpaI sites of pGL3-Control. pRluc-N3(h) (BioSignal Packard) was used as a control for transfection efficiency.
Western blot analyses
Tsc1−/−p53−/− MEFs were lysed by sonication in EBC buffer as previously described (Maggi et al., 2008). The following antibodies were used at the dilutions indicated: anti-NPM (Santa Cruz, sc6013; 1:1000), anti-γ-tubulin (Santa Cruz, sc17787; 1:500), anti-FBP1 (Abcam, ab28732; 1:1600; Western blot only), anti-FBP1 (Santa Cruz, sc11101; 1:500; immunoprecipitation only), anti-FBP2 (Abnova, H00008570-A01; 1:2000), anti-FBP3 (Santa Cruz, sc11103; 1:500), and anti-Flag M2 (Sigma, F1804; 1:1000). ImageScanner III (GE) was used to scan autoradiograms, and densities were measured with ImageQuant V. 2005 (GE).
Immunoprecipitations
Tsc1−/−p53−/− MEFs were treated with vehicle or rapamycin for 48 h and lysed by sonication in EBC buffer as described above. Whole cell lysates (500 μg) were pre-cleared with 50 μl of protein A/G PLUS-agarose (Santa Cruz, sc2003) for 1 h at 4°C with rotation. Pre-cleared lysates were then subjected to immunoprecipitation using anti-FBP1 antibody (Santa Cruz, sc11101) or non-immune goat serum(Santa Cruz, 2028) .
Quantitative RT-PCR
Total RNA was extracted from Tsc1−/−p53−/− MEFs with RNA-Solv (Omega Bio-tek). Reverse transcription reactions were performed using the SuperScript III first-strand synthesis system (Invitrogen) with oligo d(T) primer according to the manufacturer’s instructions. Real-time PCR was performed on an iCycler apparatus (Bio-Rad). To amplify NPM and GAPDH mRNAs from monosome/disome and polysome fractions, we used SsoFast EvaGreen supermix (Bio-Rad) and the following primers: NPM: forward, 5’-GGAAGACTCGATGGATATGG-3’; reverse, 5’-CTTCAACCGTAAGACCACAGG-3’; GAPDH: forward, 5’-GCTGGGGCTCACCTGAAGGG-3’; reverse, 5’-GGATGACCTTGCCCACAGCC-3’. To measure NPM mRNA in immunoprecipitates, the primers used are described above. Numbers of NPM transcripts per cell were calculated by extrapolation from a standard curve generated from serial dilutions of a known quantity of subcloned NPM cDNA. To amplify NPM mRNA or firefly luciferase mRNA not isolated from ribosome fractions or immunoprecipitates, iQ Sybr green supermix (Bio-Rad) was used. Histone 3.3 mRNA was amplified as an expression control. For NPM, the primers used are described above. The following other primers were used: firefly luciferase: forward, 5’-CCCTGGTTCCTGGAACAATT-3’; reverse, 5’-GCAACCCCTTTTTGGAAACG-3’; histone 3.3: forward, 5’-CGTGAAATCAGACGCTATCAGAA-3’; reverse, 5’-TCGCACCAGACGCTGAAAG-3’.
Bioluminescence imaging
Phenol red-free DMEM was supplemented with 10% FBS and with D-luciferin (150 μg/ml; Biosynth) or coelenterazine (1 μg/ml; Biotium). Assay plates were imaged using an IVIS100 imaging system (Xenogen Caliper). Acquisition parameters were as follows: acquisition time, 60 s (firefly luciferase) or 300 s (Renilla luciferase); binning, 4; field of view, 10 cm; f/stop, 1; filter, open. Photon flux data were analyzed with Living Image (Xenogen Caliper) and Igor (Wavemetrics) image analysis software platforms, and expressed as the ratio of Flucto Rluc as described (Gross and Piwnica-Worms, 2005).
Ribosome fractionation
Cells were treated with cycloheximide (10 μg/ml) prior to harvesting and counting. Equal numbers of cells (3 × 10⁶) were lysed, and cytosolic extracts were subjected to ribosome fractionation as previously described (Strezoska et al., 2000) using a density gradient system (Teledyne ISCO).
In-vitro transcription
DNA templates for in-vitro transcription were GAPDH 5’ UTR, GAPDH 3’ UTR, NPM 5’UTR, and NPM 3’ UTR PCR products cloned into the pCR 2.1-TOPO vector (Invitrogen). To increase proximity of the UTR sequence to the T7 promoter, we excised the EcoRV-ApaI fragment between the PCR product and T7 promoter. DNA was linearized by digestion with BstXI. We used the Megashortscript kit (Ambion) for transcription with 0.5 mM biotinylated UTP (Enzo Life Sciences) and 7.5 mM ATP, CTP, GTP, and UTP.
RNA pull-down assay
For analysis by mass spectrometry, whole cell lysates (500 μg) prepared from Tsc1−/−p53−/− MEFs treated with vehicle or rapamycin were pre-cleared with 50 μl streptavidin sepharose (GE Healthcare). Pre-cleared lysates were then incubated with biotinylated GAPDH 5’ or 3’ UTR RNA or NPM 5’ or 3’ UTR RNA (20 μg) in binding buffer (10 mM HEPES [pH 7.5], 90 mM potassium acetate, 1.5 mM magnesium acetate, 40 mM KCl, 2.5 mM DTT, 0.05% NP40, protease inhibitor cocktail, and 0.5 mM PMSF). Protein and biotinylated RNA mixtures were recovered by incubation with 50 μl streptavidin sepharose. Eluted proteins were separated on 10% polyacrylamide SDS gels and stained with SYPRO-Ruby dye. To validate results from mass spectrometry, RNA pull-down assays were performed as described, but amounts of whole cell lysate and biotinylated UTR RNA were halved.
Nano-LC FT-MS analysis
Mass spectrometry was performed using the system previously described (King et al. , 2006). The survey scans (m/z= 350–2,000) were acquired using FTICR-MS with a resolution of 100,000 at m/z = 421.75 with a target value of 500,000. The ten most intense ions from survey scans were isolated in the ion trap and analyzed after reaching a target value of 10,000. The MS/MS isolation width was 2.5 Da and the normalized collision energy was 35% using wide band activation. The electrospray ionization was accomplished with a spray voltage of 2.2 kV without sheath gas. The ion transfer tube temperature was 200°C.
RNAi
The following HP GenomeWide (Qiagen) siRNA oligonucleotides were used: FBP1-2 (5’-CAGGAACGGGCTGGTGTTAAA-3’) and FBP1-3 (5’-ATGCTTTGTGATATAAATGTA-3’). As a control, siCONTROL RISC-free siRNA (Dharmacon, D-001220-01-05) was used. Tsc1−/−p53−/− MEFs (2 × 10⁶) were transfected with 0.2 nM of oligonucleotide using the Nucleofector system (Amaxa) according to the manufacturer’s instructions. Cells were assayed 48 h after transfection. For proliferation assays, cells (1 × 10⁴) were seeded in triplicate at 24 h post-transfection. Total cell numbers were counted daily for 5 days.
FBP1 overexpression
Tsc1−/−p53−/− MEFs (2 × 10⁶) were transfected with pGL3 Control (Promega; 2 μg) or Flag-FBP1 (Origene; 2 μg) using the Nucleofector system (Amaxa) according to the manufacturer’s instructions. Cells were assayed 24 h post-transfection.
Supplementary Material
Acknowledgments
The authors thank the members of the Weber, Townsend, and Piwnica-Worms laboratories for their advice and technical assistance. The luciferase reporter work was initiated through a Pilot Grant from the Washington University Imaging Center. M.E.O. was supported by NIH 5T32 GM007067. This research was supported with grants from the National Institutes of Health, P30 CA91842 to the Siteman Comprehensive Cancer Center and P41RR000954 and UL1 RR024992 from the National Center for Research Resources to the Proteomics Center. D.P.W. and B.L.M. were supported by NIH P50 CA94056. This work was supported by NIH grant CA128007 and an Era of Hope Scholar Award in Breast Cancer Research (BC007304) to J.D.W. This work was supported by NIH grant CA127008.
References
- Bertwistle D, Sugimoto M, Sherr CJ. Physical and functional interactions of the Arf tumor suppressor protein with nucleophosmin/B23. Mol Cell Biol. 2004;24:985–96. doi: 10.1128/MCB.24.3.985-996.2004. [DOI] [PMC free article] [PubMed] [Google Scholar]
- Brady SN, Maggi LB, Jr, Winkeler CL, Toso EA, Gwinn AS, Pelletier CL, et al. Nucleophosmin protein expression level, but not threonine 198 phosphorylation, is essential in growth and proliferation. Oncogene. 2009;28:3209–20. doi: 10.1038/onc.2009.178. [DOI] [PMC free article] [PubMed] [Google Scholar]
- Brady SN, Yu Y, Maggi LB, Jr, Weber JD. ARF impedes NPM/B23 shuttling in an Mdm2-sensitive tumor suppressor pathway. Mol Cell Biol. 2004;24:9327–38. doi: 10.1128/MCB.24.21.9327-9338.2004. [DOI] [PMC free article] [PubMed] [Google Scholar]
- Brennan CM, Steitz JA. HuR and mRNA stability. Cell Mol Life Sci. 2001;58 :266–77. doi: 10.1007/PL00000854. [DOI] [PMC free article] [PubMed] [Google Scholar]
- Briata P, Forcales SV, Ponassi M, Corte G, Chen CY, Karin M, et al. p38-dependent phosphorylation of the mRNA decay-promoting factor KSRP controls the stability of select myogenic transcripts. Molecular Cell. 2005;20:891–903. doi: 10.1016/j.molcel.2005.10.021. [DOI] [PubMed] [Google Scholar]
- Briata P, Ilengo C, Corte G, Moroni C, Rosenfeld MG, Chen CY, et al. The Wnt/beta-catenin-->Pitx2 pathway controls the turnover of Pitx2 and other unstable mRNAs. Molecular Cell. 2003;12:1201–11. doi: 10.1016/s1097-2765(03)00407-6. [DOI] [PubMed] [Google Scholar]
- Chung HJ, Liu J, Dundr M, Nie Z, Sanford S, Levens D. FBPs are calibrated molecular tools to adjust gene expression. Mol Cell Biol. 2006;26:6584–97. doi: 10.1128/MCB.00754-06. [DOI] [PMC free article] [PubMed] [Google Scholar]
- Colombo E, Marine JC, Danovi D, Falini B, Pelicci PG. Nucleophosmin regulates the stability and transcriptional activity of p53. Nat Cell Biol. 2002;4:529–33. doi: 10.1038/ncb814. [DOI] [PubMed] [Google Scholar]
- de Moor CH, Meijer H, Lissenden S. Mechanisms of translational control by the 3' UTR in development and differentiation. Semin Cell Dev Biol. 2005;16:49–58. doi: 10.1016/j.semcdb.2004.11.007. [DOI] [PubMed] [Google Scholar]
- Duncan R, Bazar L, Michelotti G, Tomonaga T, Krutzsch H, Avigan M, et al. A sequence-specific, single-strand binding protein activates the far upstream element of c-myc and defines a new DNA-binding motif. Genes Dev. 1994;8:465–80. doi: 10.1101/gad.8.4.465. [DOI] [PubMed] [Google Scholar]
- Galban S, Kuwano Y, Pullmann R, Jr, Martindale JL, Kim HH, Lal A, et al. RNA-binding proteins HuR and PTB promote the translation of hypoxia-inducible factor 1alpha. Mol Cell Biol. 2008;28:93–107. doi: 10.1128/MCB.00973-07. [DOI] [PMC free article] [PubMed] [Google Scholar]
- Gebauer F, Hentze MW. Molecular mechanisms of translational control. Nat Rev Mol Cell Biol. 2004;5:827–35. doi: 10.1038/nrm1488. [DOI] [PMC free article] [PubMed] [Google Scholar]
- Gherzi R, Lee KY, Briata P, Wegmuller D, Moroni C, Karin M, et al. A KH domain RNA binding protein, KSRP, promotes ARE-directed mRNA turnover by recruiting the degradation machinery. Molecular Cell. 2004;14:571–83. doi: 10.1016/j.molcel.2004.05.002. [DOI] [PubMed] [Google Scholar]
- Grisendi S, Bernardi R, Rossi M, Cheng K, Khandker L, Manova K, et al. Role of nucleophosmin in embryonic development and tumorigenesis. Nature. 2005;437:147–53. doi: 10.1038/nature03915. [DOI] [PubMed] [Google Scholar]
- Grisendi S, Mecucci C, Falini B, Pandolfi PP. Nucleophosmin and cancer. Nat Rev Cancer. 2006;6:493–505. doi: 10.1038/nrc1885. [DOI] [PubMed] [Google Scholar]
- Gross S, Piwnica-Worms D. Real-time imaging of ligand-induced IKK activation in intact cells and in living mice. Nat Methods. 2005;2:607–14. doi: 10.1038/nmeth779. [DOI] [PubMed] [Google Scholar]
- Hamilton BJ, Wang XW, Collins J, Bloch D, Bergeron A, Henry B, et al. Separate cis-trans pathways post-transcriptionally regulate murine CD154 (CD40 ligand) expression: a novel function for CA repeats in the 3'-untranslated region. J Biol Chem. 2008;283:25606–16. doi: 10.1074/jbc.M802492200. [DOI] [PMC free article] [PubMed] [Google Scholar]
- He L, Liu J, Collins I, Sanford S, O'Connell B, Benham CJ, et al. Loss of FBP function arrests cellular proliferation and extinguishes c-myc expression. EMBO J. 2000;19:1034–44. doi: 10.1093/emboj/19.5.1034. [DOI] [PMC free article] [PubMed] [Google Scholar]
- He Y, Smith R. Nuclear functions of heterogeneous nuclear ribonucleoproteins A/B. Cell Mol Life Sci. 2009;66:1239–56. doi: 10.1007/s00018-008-8532-1. [DOI] [PMC free article] [PubMed] [Google Scholar]
- Irwin N, Baekelandt V, Goritchenko L, Benowitz LI. Identification of two proteins that bind to a pyrimidine-rich sequence in the 3'-untranslated region of GAP-43 mRNA. Nucleic Acids Res. 1997;25:1281–8. doi: 10.1093/nar/25.6.1281. [DOI] [PMC free article] [PubMed] [Google Scholar]
- Itahana K, Bhat KP, Jin A, Itahana Y, Hawke D, Kobayashi R, et al. Tumor suppressor ARF degrades B23, a nucleolar protein involved in ribosome biogenesis and cell proliferation. Mol Cell. 2003;12:1151–64. doi: 10.1016/s1097-2765(03)00431-3. [DOI] [PubMed] [Google Scholar]
- Jackson RJ, Hellen CU, Pestova TV. The mechanism of eukaryotic translation initiation and principles of its regulation. Nat Rev Mol Cell Biol. 2010;11:113–27. doi: 10.1038/nrm2838. [DOI] [PMC free article] [PubMed] [Google Scholar]
- Jefferies HB, Fumagalli S, Dennis PB, Reinhard C, Pearson RB, Thomas G. Rapamycin suppresses 5'TOP mRNA translation through inhibition of p70s6k. EMBO J. 1997;16:3693–704. doi: 10.1093/emboj/16.12.3693. [DOI] [PMC free article] [PubMed] [Google Scholar]
- Jiang Y, Xu XS, Russell JE. A nucleolin-binding 3 ' untranslated region element stabilizes beta-globin mRNA in vivo. Molecular and Cellular Biology. 2006;26:2419–2429. doi: 10.1128/MCB.26.6.2419-2429.2006. [DOI] [PMC free article] [PubMed] [Google Scholar]
- King JB, Gross J, Lovly CM, Rohrs H, Piwnica-Worms H, Townsend RR. Accurate mass-driven analysis for the characterization of protein phosphorylation. Study of the human Chk2 protein kinase. Anal Chem. 2006;78:2171–81. doi: 10.1021/ac051520l. [DOI] [PubMed] [Google Scholar]
- Kroll TT, Zhao WM, Jiang C, Huber PW. A homolog of FBP2/KSRP binds to localized mRNAs in Xenopus oocytes. Development. 2002;129:5609–19. doi: 10.1242/dev.00160. [DOI] [PubMed] [Google Scholar]
- Li H, Chen W, Zhou Y, Abidi P, Sharpe O, Robinson WH, et al. Identification of mRNA binding proteins that regulate the stability of LDL receptor mRNA through AU-rich elements. J Lipid Res. 2009;50:820–31. doi: 10.1194/jlr.M800375-JLR200. [DOI] [PMC free article] [PubMed] [Google Scholar]
- Maggi LB, Kuchenruether M, Dadey DYA, Schwope RM, Grisendi S, Townsend RR, et al. Nucleophosmin Serves as a Rate-Limiting Nuclear Export Chaperone for the Mammalian Ribosome. Molecular and Cellular Biology. 2008;28:7050–7065. doi: 10.1128/MCB.01548-07. [DOI] [PMC free article] [PubMed] [Google Scholar]
- Mazan-Mamczarz K, Galban S, Lopez de Silanes I, Martindale JL, Atasoy U, Keene JD, et al. RNA-binding protein HuR enhances p53 translation in response to ultraviolet light irradiation. Proc Natl Acad Sci U S A. 2003;100:8354–9. doi: 10.1073/pnas.1432104100. [DOI] [PMC free article] [PubMed] [Google Scholar]
- Mendez R, Myers MG, Jr, White MF, Rhoads RE. Stimulation of protein synthesis, eukaryotic translation initiation factor 4E phosphorylation, and PHAS-I phosphorylation by insulin requires insulin receptor substrate 1 and phosphatidylinositol 3-kinase. Mol Cell Biol. 1996;16:2857–64. doi: 10.1128/mcb.16.6.2857. [DOI] [PMC free article] [PubMed] [Google Scholar]
- Meyuhas O. Synthesis of the translational apparatus is regulated at the translational level. Eur J Biochem. 2000;267:6321–30. doi: 10.1046/j.1432-1327.2000.01719.x. [DOI] [PubMed] [Google Scholar]
- Min H, Turck CW, Nikolic JM, Black DL. A new regulatory protein, KSRP, mediates exon inclusion through an intronic splicing enhancer. Genes Dev. 1997;11:1023–36. doi: 10.1101/gad.11.8.1023. [DOI] [PubMed] [Google Scholar]
- Okuda M, Horn HF, Tarapore P, Tokuyama Y, Smulian AG, Chan PK, et al. Nucleophosmin/B23 is a target of CDK2/cyclin E in centrosome duplication. Cell. 2000;103:127–40. doi: 10.1016/s0092-8674(00)00093-3. [DOI] [PubMed] [Google Scholar]
- Okuwaki M, Matsumoto K, Tsujimoto M, Nagata K. Function of nucleophosmin/B23, a nucleolar acidic protein, as a histone chaperone. FEBS Lett. 2001;506:272–6. doi: 10.1016/s0014-5793(01)02939-8. [DOI] [PubMed] [Google Scholar]
- Okuwaki M, Tsujimoto M, Nagata K. The RNA binding activity of a ribosome biogenesis factor, nucleophosmin/B23, is modulated by phosphorylation with a cell cycle-dependent kinase and by association with its subtype. Mol Biol Cell. 2002;13:2016–30. doi: 10.1091/mbc.02-03-0036. [DOI] [PMC free article] [PubMed] [Google Scholar]
- Patursky-Polischuk I, Stolovich-Rain M, Hausner-Hanochi M, Kasir J, Cybulski N, Avruch J, et al. The TSC-mTOR pathway mediates translational activation of TOP mRNAs by insulin largely in a raptor-or rictor-independent manner. Mol Cell Biol. 2009;29:640–9. doi: 10.1128/MCB.00980-08. [DOI] [PMC free article] [PubMed] [Google Scholar]
- Pelletier CL, Maggi LB, Brady SN, Scheidenhelm DK, Gutmann DH, Weber JD. TSC1 sets the rate of ribosome export and protein synthesis through nucleophosmin translation. Cancer Research. 2007;67:1609–1617. doi: 10.1158/0008-5472.CAN-06-2875. [DOI] [PMC free article] [PubMed] [Google Scholar]
- Pontrelli L, Sidiropoulos KG, Adeli K. Translational control of apolipoprotein B mRNA: regulation via cis elements in the 5' and 3' untranslated regions. Biochemistry. 2004;43:6734–44. doi: 10.1021/bi049887s. [DOI] [PubMed] [Google Scholar]
- Proud CG. Signalling to translation: how signal transduction pathways control the protein synthetic machinery. Biochemical Journal. 2007;403:217–234. doi: 10.1042/BJ20070024. [DOI] [PubMed] [Google Scholar]
- Proud CG. mTORC1 signalling and mRNA translation. Biochemical Society Transactions. 2009;37:227–231. doi: 10.1042/BST0370227. [DOI] [PubMed] [Google Scholar]
- Qi W, Shakalya K, Stejskal A, Goldman A, Beeck S, Cooke L, et al. NSC348884, a nucleophosmin inhibitor disrupts oligomer formation and induces apoptosis in human cancer cells. Oncogene. 2008;27:4210–20. doi: 10.1038/onc.2008.54. [DOI] [PubMed] [Google Scholar]
- Sandsmark DK, Pelletier C, Weber JD, Gutmann DH. Mammalian target of rapamycin: master regulator of cell growth in the nervous system. Histol Histopathol. 2007;22:895–903. doi: 10.14670/HH-22.895. [DOI] [PubMed] [Google Scholar]
- Sidiropoulos KG, Zastepa A, Adeli K. Translational control of apolipoprotein B mRNA via insulin and the protein kinase C signaling cascades: evidence for modulation of RNA-protein interactions at the 5'UTR. Arch Biochem Biophys. 2007;459:10–9. doi: 10.1016/j.abb.2006.11.003. [DOI] [PubMed] [Google Scholar]
- Snee M, Kidd GJ, Munro TP, Smith R. RNA trafficking and stabilization elements associate with multiple brain proteins. J Cell Sci. 2002;115:4661–9. doi: 10.1242/jcs.00137. [DOI] [PubMed] [Google Scholar]
- Strezoska Z, Pestov DG, Lau LF. Bop1 is a mouse WD40 repeat nucleolar protein involved in 28S and 5. 8S RRNA processing and 60S ribosome biogenesis. Mol Cell Biol. 2000;20:5516–28. doi: 10.1128/mcb.20.15.5516-5528.2000. [DOI] [PMC free article] [PubMed] [Google Scholar]
- Takagi M, Absalon MJ, McLure KG, Kastan MB. Regulation of p53 translation and induction after DNA damage by ribosomal protein L26 and nucleolin. Cell. 2005;123:49–63. doi: 10.1016/j.cell.2005.07.034. [DOI] [PubMed] [Google Scholar]
- Tee AR, Fingar DC, Manning BD, Kwiatkowski DJ, Cantley LC, Blenis J. Tuberous sclerosis complex-1 and–2 gene products function together to inhibit mammalian target of rapamycin (mTOR)-mediated downstream signaling. Proc Natl Acad Sci U S A. 2002;99:13571–6. doi: 10.1073/pnas.202476899. [DOI] [PMC free article] [PubMed] [Google Scholar]
- Terada N, Patel HR, Takase K, Kohno K, Nairn AC, Gelfand EW. Rapamycin selectively inhibits translation of mRNAs encoding elongation factors and ribosomal proteins. Proc Natl Acad Sci U S A. 1994;91:11477–81. doi: 10.1073/pnas.91.24.11477. [DOI] [PMC free article] [PubMed] [Google Scholar]
- Wickens M, Bernstein DS, Kimble J, Parker R. A PUF family portrait: 3'UTR regulation as a way of life. Trends Genet. 2002;18:150–7. doi: 10.1016/s0168-9525(01)02616-6. [DOI] [PubMed] [Google Scholar]
- Wullschleger S, Loewith R, Hall MN. TOR signaling in growth and metabolism. Cell. 2006;124:471–84. doi: 10.1016/j.cell.2006.01.016. [DOI] [PubMed] [Google Scholar]
- Yu Y, Maggi LB, Brady SN, Apicelli AJ, Dai MS, Lu H, et al. Nucleophosmin is essential for ribosomal protein L5 nuclear export. Molecular and Cellular Biology. 2006;26:3798–3809. doi: 10.1128/MCB.26.10.3798-3809.2006. [DOI] [PMC free article] [PubMed] [Google Scholar]
- Zhang J, Tsaprailis G, Bowden GT. Nucleolin stabilizes Bcl-X L messenger RNA in response to UVA irradiation. Cancer Res. 2008;68:1046–54. doi: 10.1158/0008-5472.CAN-07-1927. [DOI] [PMC free article] [PubMed] [Google Scholar]
- Zhang T, Kruys V, Huez G, Gueydan C. AU-rich element-mediated translational control: complexity and multiple activities of trans-activating factors. Biochem Soc Trans. 2002;30:952–8. doi: 10.1042/bst0300952. [DOI] [PubMed] [Google Scholar]
Associated Data
This section collects any data citations, data availability statements, or supplementary materials included in this article.