

Abstract
Depressive symptoms often coexist with memory deficits in older adults and also are associated with incident cognitive decline in the elderly. However, little is known about the neural correlates of the association between depressive symptoms and memory deficits in nondemented elderly. Fifteen amnestic mild cognitive impairment (aMCI) and 20 cognitively normal (CN) subjects completed resting‐state functional magnetic resonance imaging (R‐fMRI) scans. Multiple linear regression analysis was performed to test the main effects of the Geriatric Depression Scale (GDS) and Rey Auditory Verbal Learning Test delayed recall (RAVLT‐DR) scores, and their interaction on the intrinsic amygdala functional connectivity (AFC) network activity. Severer depressive symptoms and memory deficits were found in the aMCI group than in the CN group. Partial correlation analysis identified that the RAVLT‐DR scores were significantly correlated with the AFC network in the bilateral dorsolateral prefrontal cortex (DLPFC), dorsomedial and anterior prefrontal cortex, posterior cingulate cortex (PCC), middle occipital gyrus, right inferior parietal cortex, and left middle temporal gyrus (MTG). The GDS scores were positively correlated with the AFC network in the bilateral PCC and MTG, and left DLPFC. The interactive effects of the GDS and RAVLT‐DR scores on the AFC network were seen in the bilateral PCC, MTG, and left DLPFC. These findings not only supported that there were interactive neural links between depressive symptoms and memory functions in nondemented elderly at the system level, but also demonstrated that R‐fMRI has advantages in investigating the interactive nature of different neural networks involved in complex functions, such as emotion and cognition. Hum Brain Mapp , 2011. © 2011 Wiley‐Liss, Inc.
Keywords: amnestic mild cognitive impairment, depressive symptoms, memory deficits, resting‐state functional connectivity MRI, amygdala
INTRODUCTION
Several clinical and epidemiologic studies have demonstrated that depressive symptoms and memory deficits often coexist in late life [Alexopoulos,2003; Schweitzer et al.,2002; Steffens et al.,2006; Wilson et al.,2002]. It has been reported that depressive symptoms are highly prevalent in subjects with amnestic mild cognitive impairment (aMCI), and the presence of mood symptoms increases the risk of progression from aMCI to Alzheimer's disease (AD) [Apostolova and Cummings,2008; Lu et al.,2009; Modrego and Ferrandez,2004; Rozzini et al.,2008; Steffens et al.,2006]. Similarly, the presence of cognitive deficits in patients with late‐life depression is associated with future incidence of AD [Alexopoulos et al.,1993; Devanand et al.,1996]. The co‐occurrence of depressive symptoms and memory deficits increases the risk of subsequent cognitive decline and incident AD in nondemented older adults. Recently, advances in the development and application of imaging approaches and network analysis have made it possible to investigate the underlying mechanisms of the complex relationship between depressive symptoms and memory deficits, and to study how these two behaviors are linked or interacting at the neural network level.
Previous studies have employed task‐driven functional magnetic resonance imaging (fMRI) experiments to investigate the functional localizations related to depression and cognition [Depue et al.,2007; Elliott et al.,2002; Koechlin and Hyafil,2007; MacDonald et al.,2000; Siegle et al.,2007]. These studies have identified the task‐dependent brain network activation, but provide limited information as to how these regions are functionally interconnected to one another [Dosenbach et al.,2008]. Recently, resting‐state functional MRI (R‐fMRI), as a novel technique, has been increasingly applied to study activity in the context of the neural networks, in healthy individuals, as well as patients [Biswal et al.,1995; Etkin et al.,2009; Fox and Raichle,2007; Greicius et al.,2007; Harrison et al.,2009; He et al.,2007; Li et al.,2002; Sheline et al.,2009]. Functional connectivity measures temporal correlations between the spontaneous blood oxygenation level‐dependent (BOLD) signals in different brain regions, while subjects are at rest. Therefore, R‐fMRI could provide new information into how structurally segregated and functionally specialized brain networks are interconnected with network analysis methods.
In general, conceptual perspectives of the relationships between anatomical sites, neural networks, and behaviors in studying cognition and emotion have been proposed [Pessoa,2008]. Brain areas are connected to form networks and can be analyzed by graph theory [Bullmore and Sporns,2009]. The main hypothesis of this model is that multiple neural network interactions underlie behaviors, and each behavior has both affective and cognitive components. In the present study, R‐fMRI method will be employed as a powerful approach to examine the possible neural substrates responsible for linking depressive symptoms and cognitive deficits in the nondemented elderly population.
Specifically, it has been demonstrated that the amygdala, as a neural hub, is central to the cognitive–emotional interactions, and is critical for regulating and integrating information between brain regions that are involved in memory and emotional processing, as extensively reviewed [Pessoa,2008; Phelps,2006]. In addition, studies in patients with mild AD showed amygdala atrophy that is at least as severe as the volume loss in the hippocampus [Basso et al.,2006a,b]. Also, structural and functional abnormalities in the amygdala are seen in patients with major depression [Drevets,2003; Hamilton et al.,2008; Peluso et al.,2009; Siegle et al.,2007] and MCI [Luckhaus et al.,2010; Qiu et al.,2009; Rosenbaum et al.,2010; Striepens et al.,2010]. Recent fMRI activation studies have demonstrated that depression is associated with sustained and enhanced amygdala activation to emotional task performance [Siegle et al.,2007] and to unattended fear‐related stimuli [Fales et al.,2008]. These studies strongly support our justification to use the amygdala as a seed region in this R‐fMRI study. We hypothesized that investigation of the brain network activity centered on the amygdala would provide a better understanding of the relationship between depressive symptoms and memory deficits.
The specific objectives of this study, therefore, were to identify the neural substrates that link depressive symptoms and memory impairment on the intrinsic amygdala functional connectivity (AFC) network by using the R‐fMRI approach, and enrolling nondemented elderly study subjects with aMCI, in addition to cognitively normal (CN) subjects.
METHODS AND MATERIALS
Participants
Sixteen aMCI and 20 age‐matched CN subjects were recruited through the Medical College of Wisconsin Memory Disorders Clinic and local advertising. Written informed consent was obtained from all subjects, and study protocols were approved in accordance with the Medical College of Wisconsin Institutional Review Board. One aMCI subject was excluded from the analysis because of excessive motion artifact (i.e., exceeding more than 1‐mm translational movement or more than 1° rotational movement).
All aMCI and CN subjects were in good general health with adequate visual and auditory acuity to allow cognitive testing, and had a reliable informant. All subjects underwent a battery of neuropsychological tests. aMCI study subjects were diagnosed according to the Petersen criteria [Petersen,2004], as described previously [Xu et al.,2007]. CN study subjects were required to have a Clinical Dementia Rating global score of 0, a Mini‐Mental State Examination (MMSE) score ≥24 and a Yesavage 30‐item Geriatric Depression Scale (GDS) score of <10. Exclusion criteria were: history of neurological and psychiatric disease, seizures, head injury, stroke or transient ischemic attack; drug or alcohol abuse; major psychiatric diagnoses, including schizophrenia and other psychotic disorders.
All study subjects underwent a physical examination, according to their medical records. In addition, they had a complete neurological examination, which was performed by two neurologists with expertise in dementia, and consensus diagnoses were reached. In the aMCI group, four study subjects had a GDS score >10. These subjects did not endorse a history of a clinical diagnosis of depression or treatment prior to the aMCI diagnosis. We performed the Grubbs test [Grubbs,1969] to determine that the four aMCI subjects who had GDS scores greater than 10 were not outliers, and included them in the final analyses. Additionally, one aMCI subject with a normal GDS score was taking bupropion and donepezil, but no medicine was administered 48 h prior to the scan.
MRI Acquisition
Imaging was performed using a whole‐body 3T Signa GE scanner (Waukesha, Wisconsin) with a standard transmits‐receive head coil. During the resting‐state acquisitions, no specific cognitive tasks were performed and the study participants were instructed to close their eyes, and relax, and the ears were occluded. Sagittal R‐fMRI datasets of the whole brain were obtained in 6 min with a single‐shot gradient echo‐echo planar imaging (EPI) pulse sequence. The R‐fMRI imaging parameters were: TE of 25 ms, TR of 2 s, flip angle of 90°; 36 slices were obtained; slice thickness was 4 mm with a matrix size of 64 × 64 and field of view of 24 × 24 cm2. High‐resolution spoiled gradient‐recalled echo (SPGR) 3D axial images were acquired for anatomical reference. The parameters were: TE/TR/TI of 4/10/450 ms, flip angle of 12°, number of slices of 144, slice thickness of 1 mm, matrix size of 256 × 192.
Data Analysis
Data preprocessing
R‐fMRI data analysis was carried out by using AFNI software (http://afni.nimh.nih.gov/afni) and MATLAB programs (The MathWorks, Inc., Natick, MA), as summarized in Figure 1. In brief, motion correction was performed by volume registration on the resting‐state fMRI data (3dvolreg); then, detrending was carried out to remove Legendre polynomials (3dDetrend). Possible contamination from the signals in white matter, cerebrospinal fluid, the six‐motion vectors, physical noise (cardiac and respiratory signal) and global signal were regressed out from each voxel time series. A band‐pass filter was applied to keep only low‐frequency fluctuations within the frequency range of 0.015 Hz and 0.1.
Figure 1.
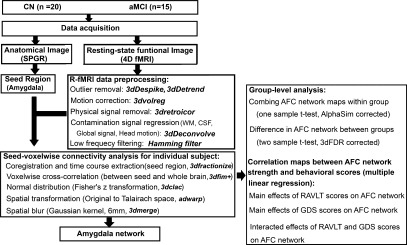
Overview of Data Process. Left: Data acquisition and preprocessing to obtain individual AFC network map. Right: statistical analysis for group‐level comparisons and linear regression analysis. CN, cognitively normal; aMCI, amnestic mild cognitive impairment; SPGR, spoiled gradient‐recalled echo sequence; fMRI: functional magnetic resonance imaging; AFC, amygdala functional connectivity; GDS: geriatric depression scale; RAVLT‐DR: Rey auditory verbal learning test delayed recall.
Manually traced amygdala mask as a seed region in the R‐fMRI study
The left and right amygdala masks were manually traced on T1‐weighted 3D SPGR images, according to literature [Honeycutt et al.,1998; Roy et al.,2009]. The most posterior boundary of the amygdala adjoins the anterior alveus of the hippocampus and the temporal horn of the lateral ventricle in the sagittal plane. The anterior boundary follows the natural boundaries of the gray matter in the anterior direction in the axial plane. The superior and inferior boundaries were coronally defined as the ventral horn of the subarachnoid space and the most dorsal finger of the white‐matter tract under the horn of the subarachnoid space, respectively. The lateral and the mesial boundaries were coronally defined at 2 mm from the surrounding white matter, and from the subarachnoid space, respectively. Operationally, a mouse‐controlled cursor traced relevant coronal, sagittal, and axial slices. Boundaries were displayed in real time on these orthogonal MRI slices with AFNI software.
Participant‐level analysis for the AFC network pattern
The traced amygadala masks from high‐resolution SPGR images were coregistered to EPI images. Because the spatial resolutions in SPGR (1.0‐mm) and EPI images (3.75 mm) were different, only those voxels in EPI images that contained at least 70% of amygdala voxels masked on the 3D SPGR images were included in the voxel time course analysis [Xu et al.,2008]. These voxel time courses within the amygdala masks were averaged as the seed time course. Then, the seed time course was correlated to the time courses of the whole‐brain voxels using the Pearson cross‐correlation. The Pearson correlation coefficients (r) were subjected to a Fisher Transform Analysis, which yielded variants of approximately normal distribution [m = 0.5ln(1 + r)/(1 − r)][Zar,1996]. These voxelwised m values were spatially transformed to the Talairach template coordinates (adwarp), resampled to 2‐mm isotropic voxels, and smoothed with a Gaussian kernel (6‐mm Full Width Half Maximum) using AFNI software (3dmerge), obtaining an AFC map for each individual.
Group‐level analysis for the AFC network pattern
Individual AFC maps were grouped together for the CN and aMCI groups, respectively. The AFC map for each group was generated by applying a voxelwise t‐test within a group of subjects against a null hypothesis of no connectivity (corrected for multiple comparison with AlphaSim, P < 0.01, cluster size of 1,072 mm3). For obtaining the difference in connectivity strength between the aMCI group and the CN group in the AFC maps, a two‐sample t‐test was used (P < 0.05, cluster size >312 mm3, False discover rate (FDR) corrected). All the results were projected on the surface brain template [Van Essen,2005].
Correlation of behavioral scores with the AFC network activity
To investigate the neural substrates underlying the functions of the GDS and RAVLT delayed recall (RAVLT‐DR) scores on the AFC network, a multivariate linear regression analysis was employed (3dRegAna, AFNI) as below:
m i = β0 + β1*GDS + β2*RAVLT + β3*GDS*RAVLT + β4*Group + β5*Age [1]
Where m i is the m value of ith voxel across group subjects, β0 is the intercept of straight line fitting in the model. β1, β2, and β3 are the effects of GDS scores, RAVLT‐DR scores, and their interaction on the functional connectivity strength of ith voxel within AFC network, respectively. β4 and β5 are the effects of group subjects and ages in the CN and aMCI groups, as covariance in the above linear regression model. The voxelwise multivariate linear regression map was generated after multiple comparison analysis (AlphaSim, AFNI, α = 0.05, P < 0.05 and cluster size >4,048 mm3) to identify the correlation maps of RAVLT and GDS scores, as well as their interactions.
RESULTS
Subject Characterization and Behavioral Performance
Fifteen aMCI study subjects (77.9 ± 6.0 years of age, including six females) and 20 CN (75.0 ± 6.2 years of age, including nine females) were included in the final data analysis. Demographic information and clinical evaluations are shown in Table I. No significant differences in age or gender were noted between aMCI and CN groups. In the aMCI group, RAVLT‐DR scores were significantly lower (F(1,33) = 15.372, P < 0.001), and GDS scores were significantly higher (F(1,33) = 7.343, P < 0.01), relative to CN group. In addition, GDS scores were inversely correlated with RAVLT‐DR scores (r = −0.37, P < 0.028), as shown in Table I and Fig. 2.
Table I.
Demographics and clinical characteristics of aMCI and CN subjects
| Characteristic | aMCI (n = 15) | CN (n = 20) | P value | ||
|---|---|---|---|---|---|
| M | SD | M | SD | ||
| Gender(female/male) | 6/9 | 9/11 | NS* | ||
| Age, years | 77.9 | 5.9 | 75.0 | 6.2 | NS |
| Education, years | 14.0 | 2.3 | 14.8 | 2.6 | NS |
| MMSE | 27.7 | 1.8 | 29.5 | 0.8 | <0.002** |
| RAVLT delayed recall | 6.8 | 3.6 | 11.2 | 3.4 | <0.0001** |
| GDS | 7.0 | 6.3 | 2.7 | 2.8 | <0.01** |
P value was obtained by χ2 two‐tailed test;
P values were obtained by a two‐sample two‐tailed t test. Unless otherwise indicated, data are presented as mean ± SD.
Significant differences were found in MMSE, RAVLT delayed recall, and GDS scores between the aMCI and CN groups. Abbreviation: aMCI, amnesic mild cognitive impairment; CN, cognitively normal; M, mean; SD, Standard Deviation; MMSE, Mini‐Mental State Examination; RAVLT, Rey Auditory Verbal Learning Test; GDS, Geriatric Depression Scale; NS, no significance.
Figure 2.
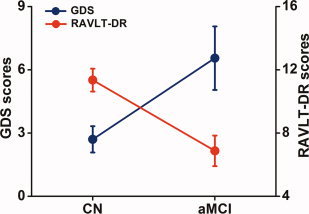
Inverse correlation between depressive symptoms and memory deficits. The results illustrated that RAVLT‐DR scores were significantly lower (F(1,33) = 15.372, P < 0.001), GDS scores were significantly higher (F(1,33) = 7.343, P < 0.01) in the aMCI group compared to the CN group. In addition, GDS scores were inversely correlated with RAVLT‐DR scores (r = −0.37, P < 0.028). Red color for the RAVLT‐DR scores, blue color for the GDS scores, error bar is presented with standard error. [Color figure can be viewed in the online issue, which is available at wileyonlinelibrary.com.]
Altered Intrinsic AFC Network Connectivity in the aMCI Subjects
The resting‐state intrinsic AFC network pattern in the CN and aMCI groups included the frontal, parietal, temporal lobes and subcortical regions, as shown in Figures 3A,B. In a two‐group comparison, altered resting‐state intrinsic AFC network connectivity was observed in the aMCI group compared with the CN group, as shown in Figure 3C. Brain regions in the AFC network were projected on the surface brain template. Regions with significantly enhanced connectivity in the AFC network included the right dorsolateral prefrontal cortex (DLPFC), inferior frontal gyrus (IFG), superior marginal gyrus (SMG)/inferior parietal cortex (IPC), left insula and precuneus, while significantly decreased connectivity in the AFC network was seen in left IFG, inferior temporal cortex (ITC), cuneus, and medial prefrontal gyrus (MeFG). Table II lists the size, location, and the highest z‐scores of each cluster with differential connectivity between aMCI and CN groups.
Figure 3.
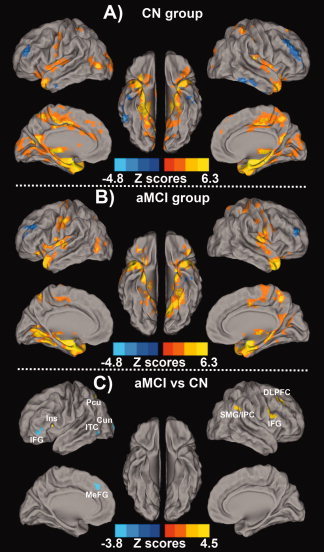
Resting‐state amygdala connectivity network pattern for (A) CN Group, (B) aMCI Group, and (C) differential amygdala connectivity between these two groups. Results are projected on a surface template (Caret software; Van Essen,2005). A: The amygdala connectivity in the CN group was primarily in the bilateral medial temporal lobule, right insula, parietal lobule and middle occipital gyrus; B: The amygdala connectivity in the aMCI group was primarily in the bilateral medial temporal lobule, parietal lobule, occipital lobule, frontal cortex and subcortical regions (both, corrected with AlphaSim, P < 0.01). Bright color indicates positive correlation and blue color indicates negative correlation; C: The altered amygdala connectivity was primarily bilateral frontal‐parietal‐occipital system, as well as left insula and inferior temporal cortex in the aMCI group compared to the CN group. Bright color indicates increased connectivity and blue color indicates decreased connectivity. Color bar is presented with z score. [Color figure can be viewed in the online issue, which is available at wileyonlinelibrary.com.]
Table II.
Clusters with altered amygdala functional connectivity in the aMCI group compared to the CN group
| Brain region | Side | BA | Cluster size (mm3) | Talairach coordinates (LPI) | Z score | ||
|---|---|---|---|---|---|---|---|
| x | Y | z | |||||
| Decreased AFC network | |||||||
| Inferior temporal cirtex | L | 37 | 2032 | −58 | −54 | −6 | −3.2 |
| Cuneus | L | 18 | 1528 | −25 | −96 | −5 | −3.1 |
| Inferior frontal gyrus | L | 47 | 880 | −39 | 39 | 0 | −2.9 |
| Medial prefrontal gyrus | L | 6 | 456 | −5 | 35 | 36 | −2.5 |
| Increased AFC network | |||||||
| Inferior frontal gyrus | R | 44 | 1072 | 51 | 11 | 22 | 2.8 |
| Dorsolateral prefrontal cortex | R | 9 | 440 | 31 | 32 | 36 | 2.4 |
| Superior marginal gyrus/Inferior parietal cortex | R | 40 | 312 | 57 | −41 | 30 | 2.5 |
| Precuneus | L | 7 | 312 | −17 | −67 | 43 | 2.8 |
| Insula | L | 13 | 312 | −29 | 15 | 10 | 2.5 |
x,y,z, coordinates of primary peak locations in the Talairach space. Abbreviation: BA, Brodmann's area; R, right. L, left.
The Effects of RAVLT‐DR and GDS Scores on the AFC Network
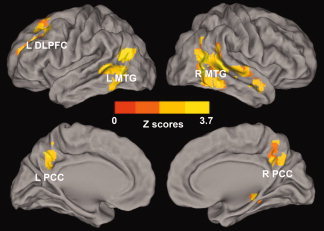
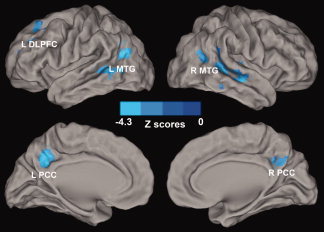
Voxelwise multivariate regression analysis identified the main effect of RAVLT‐DR and GDS scores and their interaction on the AFC network activity. The main effect of the RAVLT‐DR scores on the AFC network activity was seen in regions that included the bilateral DLPFC, dorsomedial prefrontal cortex (DMPFC), anterior prefrontal cortex (aPFC), PCC, and middle occipital gyrus (MOG), right IPC, and left MTG, as shown in Figure 4 and Table III; the main effect of GDS scores on the AFC network activity was in the regions of the bilateral PCC and MTG, and left DLPFC, as shown in Figure 5 and Table III. The interactive effects of the RAVLT‐DR and GDS scores on the AFC network activity were seen in the bilateral PCC and MTG, and left DLPFC, as described in Figure 6 and Table III.
Figure 4.
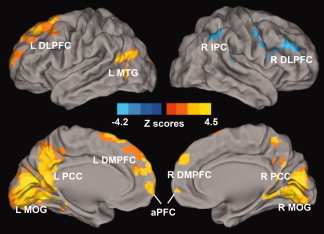
Whole‐brain analyses reveal the effects of memory performance on the amygdala connectivity network. Whole‐brain, partial‐correlation analyses were conducted between the AFC network strength and RAVLT‐DR scores after controlling the GDS scores, RAVLT‐DR, and GDS score interaction, age and group factors as covariances of no interest. Results are projected on a surface template and illustrate that the RAVLT‐DR scores are positively correlated with the strength of the distinct region of the AFC network, except for the right DLPFC and IPC. Bright color indicates positive correlation and blue color indicates negative correlation. Color bar is presented with z score. Abbreviations: L DLPFC, left dorsolateral prefrontal cortex; L MTG, left middle temporal gyrus; L PCC, left posterior cingulate cortex; L DMPFC, left dorsomedial prefrontal cortex; L MOG, left middle occipital gyrus; aPFC, anterior prefrontal cortex; R DMPFC, right dorsomedial prefrontal cortex; R PCC, right posterior cingulate cortex; R MOG, right middle occipital gyrus; R DLPFC, right dorsolateral prefrontal cortex, R IPC, right inferior parietal cortex. [Color figure can be viewed in the online issue, which is available at wileyonlinelibrary.com.]
Table III.
Neural basis of the RAVLT‐DR scores, GDS scores and their interaction on the amygdala functional connectivity network
| Brain region | Side | BA | Cluster size (mm3) | Talairach coordinates (LPI) | Z score | ||
|---|---|---|---|---|---|---|---|
| x | y | Z | |||||
| RAVLT‐DR scores | |||||||
| PCC | L | 31 | 36296 | −13 | −51 | 22 | 4.5 |
| PCC | R | 30 | 10 | −51 | 19 | 2.4 | |
| MOG | R | 18 | 4 | −76 | 6 | 4.3 | |
| MOG | L | 18 | −8 | −74 | 6 | 3.7 | |
| MTG | L | 39 | 4584 | −50 | −58 | 13 | 3.2 |
| DLPFC | R | 9 | 27160 | 61 | 13 | 34 | −4.2 |
| IPC | R | 40 | 55 | −47 | 40 | −3.2 | |
| DMPFC | L | 6 | 21584 | −11 | 23 | 58 | 4.0 |
| DLPFC | L | 9 | −45 | 7 | 34 | 3.9 | |
| DMPFC | R | 8 | 9 | 49 | 34 | 2.8 | |
| aPFC | L | 10 | −1 | 58 | 2 | 2.3 | |
| aPFC | R | 10 | 1 | 58 | 2 | 2.4 | |
| GDS scores | |||||||
| MTG | R | 22 | 12584 | 42 | −54 | 18 | 2.0 |
| PCC | R | 31 | 6 | −55 | 29 | 1.8 | |
| PCC | L | 31 | −6 | −45 | 30 | 1.6 | |
| MTG | L | 22 | 7912 | −39 | −57 | 14 | 2.1 |
| DLPFC | L | 9 | 4072 | −27 | 21 | 36 | 3.1 |
| RAVLT‐DR and GDS scores interaction | |||||||
| DLPFC | L | 9 | 4824 | −31 | 23 | 33 | −3.5 |
| MTG | L | 19 | 9336 | −39 | −59 | 16 | −4.1 |
| MTG | R | 22 | 8536 | 48 | −33 | 0 | −3.4 |
| PCC | R | 31 | 4280 | 11 | −47 | 28 | −3.1 |
| PCC | L | 31 | −7 | −47 | 29 | −2.7 | |
x,y,z, coordinates of primary peak locations in the Talairach space. Abbreviation: BA, Brodmann's area; R, right. L, left; PCC, posterior cingulate cortex; MOG, middle occipital gyrus; MTG, middle temporal gyrus; DLPFC, dorsolateral prefrontal cortex; IPC, inferior parietal cortex; DMPFC, dorsomedial prefrontal cortex; aPFC, anterior prefrontal cortex.
Figure 5.
Whole‐brain analyses reveal the effects of depressive symptoms on the amygdala connectivity network. Whole‐brain, partial correlation analyses were conducted between the AFC network strength and GDS scores after controlling the RAVLT‐DR scores, RAVLT‐DR and GDS score interaction, age and group factors as covariances of no interest. Results are projected on a surface template. They illustrate that the GDS scores are positively correlated with the strength of the distinct region of the AFC network. Bright color indicates positive correlation. Color bar was presented with z score. Abbreviations: L DLPFC, left dorsolateral prefrontal cortex; L MTG, left middle temporal gyrus; R MTG, right middle temporal gyrus; L PCC, left posterior cingulate cortex; R PCC, right posterior cingulate cortex. [Color figure can be viewed in the online issue, which is available at wileyonlinelibrary.com.]
Figure 6.
Interaction of Memory Deficits and Depressive Symptoms on the Amygdala Connectivity Network. The results show that interactive regions of depressive symptoms and memory deficits on the AFC network include the bilateral PCC, MTG, and left DLPFC. Color bar is presented with z scores. Abbreviations: L DLPFC, left dorsolateral prefrontal cortex; L MTG, left middle temporal gyrus; R MTG, right middle temporal gyrus; L PCC, left posterior cingulate cortex; R PCC, right posterior cingulate cortex. [Color figure can be viewed in the online issue, which is available at wileyonlinelibrary.com.]
The aMCI and control groups demonstrated no significant volume difference in the area of the amygdala. Also, there was no correlation between the AFC network strength and the amygdala volume across all subjects (P > 0.64). In addition, a 48‐h interval may not be sufficient time for buproprion and donepezil to be “washed out.” We reanalyzed the entire dataset without the MCI subject who was taking buproprion and donepezil; results did not significantly differ.
DISCUSSION
Intrinsic AFC Network Differences between the aMCI and CN Subjects
It is well established that the relationships between the amygdala and the prefrontal cortex and parietal cortex are functionally involved in decision making, emotion, and memory processing [Andersen and Cui,2009; Etkin et al.,2009; Spielberg et al.,2008]. A meta‐analysis has demonstrated that the amygdala is a critical node in the multiple neural networks involved in emotional‐cognitive integration among nonhuman and human primates [Robinson et al.,2010]. Previous anatomical studies in nonhuman primates have demonstrated that a wide range of cortical regions, including the medial frontal gyrus, IFG, insula, temporal lobe, and subcortical regions (e.g., caudate) have reciprocal connections with the amygdala [Etkin et al.,2009; Kita and Kitai,1990; Mufson et al.,1981; Packard et al.,1994]. A recent R‐fMRI study among healthy adults showed delineation of the amygdala functional connectivity pattern with brain regions located in the frontal‐parietal system, limbic system and subcortical region [Roy et al.,2009]. In the present R‐fMRI study, the data regarding the brain regions involved in the amygdala network in CN subjects are consistent with previous findings. Our new findings in the current study are that the AFC network connectivity is significantly altered in the frontal, occipital, and temporal lobes in aMCI subjects. It is known that the connectivity between amygdala‐MeFG and amygdala‐IFG regions in normal subjects is balanced to reflect the emotional regulation through cognitive control [Etkin et al.,2009]. The abnormal connectivity in these regions among aMCI participants may result in reduced cognitive and emotional performance. In the present study, we also found decreased connectivity of the amygdala in the occipital and temporal lobe. Such disrupted connectivity in the aMCI subjects could alter the semantic‐memory network, as recently described [Binder et al.,2009; Etkin et al.,2009].
Although this study involved no explicit tasks or stimuli, the altered connectivity in the intrinsic AFC network in the aMCI subjects may reflect the affective elaboration on persistent sad feelings or negative topics. This notion is consistent with previous findings demonstrating that emotional stimuli alter amygdala activity [Fales et al.,2008; Siegle et al.,2002; Siegle et al.,2007].
Relationship of the AFC Network Activity and Memory Deficits
A factorial analysis was performed with the RAVLT‐DR scores. Figure 4 shows that the strength of the intrinsic AFC network was positively correlated with memory performance in critical brain regions, which include the frontal‐parietal system (bilateral aPFC, left DLPFC), midline core structures (PCC, DMPFC) in the default model network [Buckner et al.,2008; Gusnard and Raichle2001], and the temporal‐occipital system (MTG, MOG) [Buckner et al.,2009; Hagmann et al.,2008; Tambini et al.,2010]; while negatively correlated regions were found in the right DLPFC and IPC. These regions, which are considered hubs, are shown to have widespread brain connections and are essential for diverse informational processing, which are especially needed for emotional and memory formation. More importantly, these regions within the AFC network are also primary sites affected the earliest by β‐Amyloid proteins accumulation [Buckner et al.,2009; Jack et al.,2008; Small et al.,2006]. Moreover, the medial temporal lobe structures, including the amygdala, are more susceptible to the neurotoxic effects of the amyloid [Frisoni et al.,2009]. Taken together, these findings reveal a functional specialization within the amygdala network for memory performance, and suggest that the amygdala network is crucial for memory processing. Therefore, it is plausible that the distinctive change in the AFC network observed in this study is related to memory deficits.
Relationship of AFC Network Activity and Depressive Symptoms
A factorial analysis was also performed with GDS scores. Figure 5 shows that the AFC strength was correlated with GDS scores in cortical structures, including the bilateral PCC and MTG, and left DLPFC. These results are consistent with previous studies [Greicius et al.,2007; Kenny et al.,2010; Sheline et al.,2010; Siegle et al.,2007; Stein et al.,2007a; Wang et al.,2008; Zhou et al.,2010]. For example, task‐dependent fMRI studies in depressed patients have shown a reciprocal relationship between decreased activation in the dorsal and ventral parts of the DLPFC and dorsal ACC regions, and increased activation in the limbic/paralimbic areas, which include the amygdala, hippocampus, thalamus, and the basal ganglia [Sheline et al.,2010; Siegle et al.,2007, 2007b; Wang et al.,2008]. Strong amygdala network connectivity related to the DLPFC, IPC, fusiform gyrus, insula and thalamus has been reported previously [Etkin et al.,2009; Roy et al.,2009]. Furthermore, elevated cerebral glucose metabolism is seen in geriatric depression, specifically in the frontal and temporal lobe structures, and the posterior cortical structures, which include the precuneus and IPC. Similar to our findings, the cortical hypermetabolism was positively correlated to depressive symptom severity [Smith et al.,2009a]. These studies suggest that the AFC network plays an important role in emotional processing, especially in the presence of depressive symptoms.
Neural Basis of the Interactive Effects of Depressive Symptoms and Memory Deficits on the AFC Network
In this study, the dual functions of the amygdala network are involved in memory deficits and depressive symptoms, thereby strongly supporting a recent conceptual hypothesis that complex cognitive and emotional behaviors have their neural bases in the dynamic coalition of networks with distributed brain regions [Pessoa,2008]. Furthermore, their interactive neural substrates provide insight into the neurophysiological nature of the link between depressive symptoms and memory deficits. These results suggest that depressive symptoms and memory function are interactive, and mediated by altering the functional connectivity among amygdala links with bilateral PCC and MTG, and left DLPFC [Baxter et al.,2008].
It is important to note that these interactive regions are reported to be involved in the earliest AD neuropathology [Buckner et al.,2009; Jack et al.,2008; Small et al.,2006]. It is conceivable that AFC network alterations may be associated with the amyloid plaques deposition. Through the amygdala network interaction, the emergence of depressive symptoms and memory deficits in aMCI subjects could occur. To our knowledge, this is the first time to demonstrate that the amygdala network, especially the connections among the amygdala and the bilateral PCC and MTG, and the left DLPFC, links the emotional state (depressive symptoms) and cognitive dysfunction (memory deficits) in nondemented elderly subjects.
In addition, previous neuroimaging studies have shown increased brain activation in MCI independent of depression [Bokde et al.,2010; Bookheimer et al.,2000; Grady et al.,2003; Ries et al.,2006; Stark and Squire,2001]. It is not clear if the altered connectivity is related to memory deficits or depressive symptoms. With the conjunction analysis we have identified the factor effect maps for memory function (see Fig. 4) and depressive symptoms (see Fig. 5). It is found that there were overlapping regions between Figure 3C and Figure 4 in the right DLPFC, IPC, and IFG. The overlapping areas suggest that the increased amygdala connectivity within these regions in MCI subjects were associated with memory deficits independent of depression. Similarly, the overlapping region between Figure 3C and Figure 5 occurred in the left MTG, suggesting that the decreased amygdala connectivity with the left MTG was associated with depressive symptoms independent of memory deficits. There were no overlapping regions between Figure 3C and Figure 6, suggesting that the interactive regions between factors of memory function and depressive symptoms did not have significant changes in amygdala connectivity. These findings suggest that the AFC differences in these regions are implicated in the process of memory, depressive symptoms, or their interaction, respectively.
The Relationship between Task‐Driven FMRI and Resting‐State FMRI
It would be useful to discuss what we know about the relationship between the two modalities and their potential impact on the interpretation of the results of this study. In general, while the neurophysiology underlying the connectivity patterns in “resting‐state” low‐frequency oscillations remains to be elucidated, these connectivity patterns measured by R‐fMRI are posited to reflect intrinsic representations of functional systems commonly implicated in task‐driven fMRI studies. For example, resting correlations between brain regions have been found to replicate the similar networks typically found in task‐activation studies [Fair et al.,2007]. Recently, it was demonstrated that the full repertoire of functional networks utilized by the brain in action is continuously and dynamically “active” even when at “rest.” [Smith et al.,2009b]. A remarkable degree of information can be gleaned with R‐fMRI about the complex orchestration of brain activity across a broad array of cognitive activities, and neurological and psychiatric disorders [Fox and Greicius,2010; Rosen,2011]. Nevertheless, the direct relationship between resting‐state functional connectivity and the BOLD response induced by task performance remains unclear. Our early study demonstrated that acute drug administration altered functional connectivity [Li et al.,2000], and cognitive tasks regulated the synchrony of the low‐frequency oscillations in memory networks [Xu et al.,2006]. Recent studies show that interindividual differences in resting‐state functional connectivity predict task‐induced BOLD activity [Mennes et al.,2010], and the resting‐state fluctuation of amplitude can be employed to scale hemodynamic responses during task performance [Kannurpatti et al.,2010].
Specifically, previous studies using task‐dependent fMRI have shown that amygdala activity increases when depressed study participants respond to emotional tasks and DLPFC reactivity decreases in response to cognitive tasks [Siegle et al.,2007], suggesting an inverse functional relationship between the amygdala and DLPFC structures. It is not known, however, how the emotional task‐driven increased amygdala activity is associated with cognitive tasks, or the manner in which the cognitive task‐driven decreased DLPFC activity is associated with emotional tasks. By using the network connectivity approach, as demonstrated in this R‐fMRI study, the depressive symptoms and memory function were interactive, and had to have an inverse effect on the neural links.
Our preliminary study is not without limitations. First, brain activity during the data acquisition is not controlled by a task or consistent behavioral state across subjects, as extensively reviewed [Fox and Raichle,2007]. Future studies may address and determine to what extent variations of measurements should be used. In addition, given the complex nature of co‐occurring depressive symptoms and memory impairment, the clinical diagnostic process should consider that depressive symptoms in patients with aMCI may be different from those in depressed patients without aMCI. Similarly, memory deficits in aMCI patients with geriatric depression may be different from those without depressive symptoms. As suggested, future studies should assess depression in the context of cognitive impairment, and cognitive impairment in the context of depression. Finally, large‐scale network analysis methods that use large study subject populations should be used instead of small sample size populations that focus on the AFC network.
CONCLUSION
In summary, using network‐based resting‐state functional connectivity analysis, we were able to demonstrate an altered intrinsic AFC network in the aMCI subjects, and distinct subcomponents of the amygdala network were found to be associated with depressive symptoms and memory impairment in nondemented elderly subjects. The functional connectivity of the amygdala‐bilateral PCC, left DLPFC, and MTG regions was involved in the interaction between mood symptoms and memory performance. Neural network analysis provides new insight for investigating the complex association that links depressive symptoms and subsequent cognitive decline in older adults.
Acknowledgements
Dr. Zhijun Zhang and Dr. Shi‐Jiang Li had full access to all of the data in the study and take responsibility for the integrity of the data and the accuracy of the data analysis. Dr. Xie and the other coauthors had full access to all the data in the study. The authors thank Ms. Carrie O'Connor for editorial assistance, Mr. Douglas Ward for discussions on the statistical analysis, and Ms. Judi Zaferos‐Pylant and Mr. Yu Liu for MRI technical assistance. No authors of this article have reported any actual or potential conflict of interest.
Contributor Information
Zhijun Zhang, Email: zhijunzhang838@yahoo.com.cn.
Shi‐Jiang Li, Email: sjli@mcw.edu.
REFERENCES
- Alexopoulos GS ( 2003): Clinical and biological interactions in affective and cognitive geriatric syndromes. Am J Psychiatry 160: 811–814. [DOI] [PubMed] [Google Scholar]
- Alexopoulos GS, Meyers BS, Young RC, Mattis S, Kakuma T ( 1993): The course of geriatric depression with “reversible dementia”: A controlled study. Am J Psychiatry 150: 1693–1699. [DOI] [PubMed] [Google Scholar]
- Andersen RA, Cui H ( 2009): Intention, action planning, and decision making in parietal‐frontal circuits. Neuron 63: 568–583. [DOI] [PubMed] [Google Scholar]
- Apostolova LG, Cummings JL ( 2008): Neuropsychiatric manifestations in mild cognitive impairment: A systematic review of the literature. Dement Geriatr Cogn Disord 25: 115–126. [DOI] [PubMed] [Google Scholar]
- Basso M, Gelernter J, Yang J, MacAvoy MG, Varma P, Bronen RA, van Dyck CH. ( 2006a): Apolipoprotein E epsilon4 is associated with atrophy of the amygdala in Alzheimer's disease. Neurobiol Aging 27: 1416–1424. [DOI] [PubMed] [Google Scholar]
- Basso M, Yang J, Warren L, MacAvoy MG, Varma P, Bronen RA, van Dyck CH, Gelernter J ( 2006b): Volumetry of amygdala and hippocampus and memory performance in Alzheimer's disease Apolipoprotein E epsilon4 is associated with atrophy of the amygdala in Alzheimer's disease. Psychiatry Res 146: 251–261. [DOI] [PubMed] [Google Scholar]
- Baxter MG, Gaffan D, Kyriazis DA, Mitchell AS ( 2008): Dorsolateral prefrontal lesions do not impair tests of scene learning and decision‐making that require frontal‐temporal interaction. Eur J Neurosci 28: 491–499. [DOI] [PMC free article] [PubMed] [Google Scholar]
- Binder JR, Desai RH, Graves WW, Conant LL ( 2009): Where is the semantic system? A critical review and meta‐analysis of 120 functional neuroimaging studies. Cereb Cortex 19: 2767–2796. [DOI] [PMC free article] [PubMed] [Google Scholar]
- Biswal B, Yetkin FZ, Haughton VM, Hyde JS ( 1995): Functional connectivity in the motor cortex of resting human brain using echo‐planar MRI. Magn Reson Med 34: 537–541. [DOI] [PubMed] [Google Scholar]
- Bokde AL, Karmann M, Born C, Teipel SJ, Omerovic M, Ewers M, Frodl T, Meisenzahl E, Reiser M, Moller HJ, Hampel H ( 2010): Altered brain activation during a verbal working memory task in subjects with amnestic mild cognitive impairment. J Alzheimers Dis 21: 103–118. [DOI] [PubMed] [Google Scholar]
- Bookheimer SY, Strojwas MH, Cohen MS, Saunders AM, Pericak‐Vance MA, Mazziotta JC, Small GW ( 2000): Patterns of brain activation in people at risk for Alzheimer's disease. N. Engl J Med 343: 450–456. [DOI] [PMC free article] [PubMed] [Google Scholar]
- Buckner RL, Andrews‐Hanna JR, Schacter DL ( 2008): The brain's default network: Anatomy, function, and relevance to disease. Ann NY Acad Sci 1124: 1–38. [DOI] [PubMed] [Google Scholar]
- Buckner RL, Sepulcre J, Talukdar T, Krienen FM, Liu H, Hedden T, Andrews‐Hanna JR, Sperling RA, Johnson KA ( 2009): Cortical hubs revealed by intrinsic functional connectivity: Mapping, assessment of stability, and relation to Alzheimer's disease. J Neurosci 29: 1860–1873. [DOI] [PMC free article] [PubMed] [Google Scholar]
- Bullmore E, Sporns O ( 2009): Complex brain networks: Graph theoretical analysis of structural and functional systems. Nat Rev Neurosci 10: 186–198. [DOI] [PubMed] [Google Scholar]
- Depue BE, Curran T, Banich MT ( 2007): Prefrontal regions orchestrate suppression of emotional memories via a two‐phase process. Science 317: 215–219. [DOI] [PubMed] [Google Scholar]
- Devanand DP, Sano M, Tang MX, Taylor S, Gurland BJ, Wilder D, Stern Y, Mayeux R ( 1996): Depressed mood and the incidence of Alzheimer's disease in the elderly living in the community. Arch Gen Psychiatry 53: 175–182. [DOI] [PubMed] [Google Scholar]
- Dosenbach NU, Fair DA, Cohen AL, Schlaggar BL, Petersen SE ( 2008): A dual‐networks architecture of top‐down control. Trends Cogn Sci 12: 99–105. [DOI] [PMC free article] [PubMed] [Google Scholar]
- Drevets WC ( 2003): Neuroimaging abnormalities in the amygdala in mood disorders. Ann NY Acad Sci 985: 420–444. [DOI] [PubMed] [Google Scholar]
- Elliott R, Rubinsztein JS, Sahakian BJ, Dolan RJ ( 2002): The neural basis of mood‐congruent processing biases in depression. Arch Gen Psychiatry 59: 597–604. [DOI] [PubMed] [Google Scholar]
- Etkin A, Prater KE, Schatzberg AF, Menon V, Greicius MD ( 2009): Disrupted amygdalar subregion functional connectivity and evidence of a compensatory network in generalized anxiety disorder. Arch Gen Psychiatry 66: 1361–1372. [DOI] [PubMed] [Google Scholar]
- Fair DA, Schlaggar BL, Cohen AL, Miezin FM, Dosenbach NU, Wenger KK, Fox MD, Snyder AZ, Raichle ME, Petersen SE ( 2007): A method for using blocked and event‐related fMRI data to study “resting state” functional connectivity. Neuroimage 35: 396–405. [DOI] [PMC free article] [PubMed] [Google Scholar]
- Fales CL, Barch DM, Rundle MM, Mintun MA, Snyder AZ, Cohen JD, Mathews J, Sheline YI ( 2008): Altered emotional interference processing in affective and cognitive‐control brain circuitry in major depression. Biol Psychiatry 63: 377–384. [DOI] [PMC free article] [PubMed] [Google Scholar]
- Fox MD, Greicius M ( 2010): Clinical applications of resting state functional connectivity. Front Syst Neurosci 4: 19. [DOI] [PMC free article] [PubMed] [Google Scholar]
- Fox MD, Raichle ME ( 2007): Spontaneous fluctuations in brain activity observed with functional magnetic resonance imaging. Nat Rev Neurosci 8: 700–711. [DOI] [PubMed] [Google Scholar]
- Frisoni GB, Lorenzi M, Caroli A, Kemppainen N, Nagren K, Rinne JO ( 2009): In vivo mapping of amyloid toxicity in Alzheimer disease. Neurology 72: 1504–1511. [DOI] [PubMed] [Google Scholar]
- Grady CL, McIntosh AR, Beig S, Keightley ML, Burian H, Black SE ( 2003): Evidence from functional neuroimaging of a compensatory prefrontal network in Alzheimer's disease. J Neurosci 23: 986–993. [DOI] [PMC free article] [PubMed] [Google Scholar]
- Greicius MD, Flores BH, Menon V, Glover GH, Solvason HB, Kenna H, Reiss AL, Schatzberg AF ( 2007): Resting‐state functional connectivity in major depression: Abnormally increased contributions from subgenual cingulate cortex and thalamus. Biol Psychiatry 62: 429–437. [DOI] [PMC free article] [PubMed] [Google Scholar]
- Grubbs F ( 1969): Procedures for detecting outlying observations in samples. Technometrics 11: 1–21. [Google Scholar]
- Gusnard DA, Raichle ME ( 2001): Searching for a baseline: Functional imaging and the resting human brain. Nat Rev Neurosci 2: 685–694. [DOI] [PubMed] [Google Scholar]
- Hagmann P, Cammoun L, Gigandet X, Meuli R, Honey CJ, Wedeen VJ, Sporns O ( 2008): Mapping the structural core of human cerebral cortex. PLoS Biol 6: e159. [DOI] [PMC free article] [PubMed] [Google Scholar]
- Hamilton JP, Siemer M, Gotlib IH ( 2008): Amygdala volume in major depressive disorder: A meta‐analysis of magnetic resonance imaging studies. Mol Psychiatry 13: 993–1000. [DOI] [PMC free article] [PubMed] [Google Scholar]
- Harrison BJ, Soriano‐Mas C, Pujol J, Ortiz H, Lopez‐Sola M, Hernandez‐Ribas R, Deus J, Alonso P, Yucel M, Pantelis C, Menchon JM, Cardoner N ( 2009): Altered corticostriatal functional connectivity in obsessive‐compulsive disorder. Arch Gen Psychiatry 66: 1189–1200. [DOI] [PubMed] [Google Scholar]
- He Y, Wang L, Zang Y, Tian L, Zhang X, Li K, Jiang T ( 2007): Regional coherence changes in the early stages of Alzheimer's disease: a combined structural and resting‐state functional MRI study. Neuroimage 35: 488–500. [DOI] [PubMed] [Google Scholar]
- Honeycutt NA, Smith PD, Aylward E, Li Q, Chan M, Barta PE, Pearlson GD ( 1998): Mesial temporal lobe measurements on magnetic resonance imaging scans. Psychiatry Res 83: 85–94. [DOI] [PubMed] [Google Scholar]
- Jack CR,Jr. , Lowe VJ, Senjem ML, Weigand SD, Kemp BJ, Shiung MM, Knopman DS, Boeve BF, Klunk WE, Mathis CA, Petersen RC ( 2008): 11C PiB and structural MRI provide complementary information in imaging of Alzheimer's disease and amnestic mild cognitive impairment. Brain 131( Part 3): 665–680. [DOI] [PMC free article] [PubMed] [Google Scholar]
- Kannurpatti SS, Motes MA, Rypma B, Biswal BB ( 2010): Increasing measurement accuracy of age‐related BOLD signal change: Minimizing vascular contributions by resting‐state‐fluctuation‐of‐amplitude scaling. Hum Brain Mapp. [Epub ahead of print]. [DOI] [PMC free article] [PubMed] [Google Scholar]
- Kenny ER, O'Brien J T, Cousins DA, Richardson J, Thomas AJ, Firbank MJ, Blamire AM. ( 2010): Functional connectivity in late‐life depression using resting‐state functional magnetic resonance imaging. Am J Geriatr Psychiatry 18:643–651. [DOI] [PubMed] [Google Scholar]
- Kita H, Kitai ST ( 1990): Amygdaloid projections to the frontal cortex and the striatum in the rat. J Comp Neurol 298: 40–49. [DOI] [PubMed] [Google Scholar]
- Koechlin E, Hyafil A ( 2007): Anterior prefrontal function and the limits of human decision‐making. Science 318: 594–598. [DOI] [PubMed] [Google Scholar]
- Li SJ, Biswal B, Li Z, Risinger R, Rainey C, Cho JK, Salmeron BJ, Stein EA ( 2000): Cocaine administration decreases functional connectivity in human primary visual and motor cortex as detected by functional MRI. Magn Reson Med 43: 45–51. [DOI] [PubMed] [Google Scholar]
- Li SJ, Li Z, Wu G, Zhang MJ, Franczak M, Antuono PG ( 2002): Alzheimer Disease: Evaluation of a functional MR imaging index as a marker. Radiology 225: 253–259. [DOI] [PubMed] [Google Scholar]
- Lu PH, Edland SD, Teng E, Tingus K, Petersen RC, Cummings JL ( 2009): Donepezil delays progression to AD in MCI subjects with depressive symptoms. Neurology 72: 2115–2121. [DOI] [PMC free article] [PubMed] [Google Scholar]
- Luckhaus C, Cohnen M, Fluss MO, Janner M, Grass‐Kapanke B, Teipel SJ, Grothe M, Hampel H, Peters O, Kornhuber J, Maier W, Supprian T, Gaebel W, Modder U, Wittsack HJ ( 2010): The relation of regional cerebral perfusion and atrophy in mild cognitive impairment (MCI) and early Alzheimer's dementia. Psychiatry Res 183: 44–51. [DOI] [PubMed] [Google Scholar]
- MacDonald AW III, Cohen JD, Stenger VA, Carter CS ( 2000): Dissociating the role of the dorsolateral prefrontal and anterior cingulate cortex in cognitive control. Science 288: 1835–1838. [DOI] [PubMed] [Google Scholar]
- Mennes M, Kelly C, Zuo XN, Di Martino A, Biswal BB, Castellanos FX, Milham MP ( 2010): Inter‐individual differences in resting‐state functional connectivity predict task‐induced BOLD activity. Neuroimage 50: 1690–1701. [DOI] [PMC free article] [PubMed] [Google Scholar]
- Modrego PJ, Ferrandez J ( 2004): Depression in patients with mild cognitive impairment increases the risk of developing dementia of Alzheimer type: A prospective cohort study. Arch Neurol 61: 1290–1293. [DOI] [PubMed] [Google Scholar]
- Mufson EJ, Mesulam MM, Pandya DN ( 1981): Insular interconnections with the amygdala in the rhesus monkey. Neuroscience 6: 1231–1248. [DOI] [PubMed] [Google Scholar]
- Packard MG, Cahill L, McGaugh JL ( 1994): Amygdala modulation of hippocampal‐dependent and caudate nucleus‐dependent memory processes. Proc Natl Acad Sci USA 91: 8477–8481. [DOI] [PMC free article] [PubMed] [Google Scholar]
- Peluso MA, Glahn DC, Matsuo K, Monkul ES, Najt P, Zamarripa F, Li J, Lancaster JL, Fox PT, Gao JH, Soares JC ( 2009): Amygdala hyperactivation in untreated depressed individuals. Psychiatry Res 173: 158–161. [DOI] [PMC free article] [PubMed] [Google Scholar]
- Pessoa L ( 2008): On the relationship between emotion and cognition. Nat Rev Neurosci 9: 148–158. [DOI] [PubMed] [Google Scholar]
- Petersen RC ( 2004): Mild cognitive impairment as a diagnostic entity. J Intern Med 256: 183–194. [DOI] [PubMed] [Google Scholar]
- Phelps EA ( 2006): Emotion and cognition: Insights from studies of the human amygdala. Annu Rev Psychol 57: 27–53. [DOI] [PubMed] [Google Scholar]
- Qiu A, Fennema‐Notestine C, Dale AM, Miller MI ( 2009): Regional shape abnormalities in mild cognitive impairment and Alzheimer's disease. Neuroimage 45: 656–661. [DOI] [PMC free article] [PubMed] [Google Scholar]
- Ries ML, Schmitz TW, Kawahara TN, Torgerson BM, Trivedi MA, Johnson SC ( 2006): Task‐dependent posterior cingulate activation in mild cognitive impairment. Neuroimage 29: 485–492. [DOI] [PMC free article] [PubMed] [Google Scholar]
- Robinson JL, Laird AR, Glahn DC, Lovallo WR, Fox PT ( 2010): Metaanalytic connectivity modeling: Delineating the functional connectivity of the human amygdala. Hum Brain Mapp 31: 173–184. [DOI] [PMC free article] [PubMed] [Google Scholar]
- Rosen BN, Napadow V ( 2011): Quantitative markers for neuropsychiatric disease—Give it a rest. Radiology (In press). [DOI] [PMC free article] [PubMed] [Google Scholar]
- Rosenbaum RS, Furey ML, Horwitz B, Grady CL ( 2010): Altered connectivity among emotion‐related brain regions during short‐term memory in Alzheimer's disease. Neurobiol Aging 31: 780–786. [DOI] [PMC free article] [PubMed] [Google Scholar]
- Roy AK, Shehzad Z, Margulies DS, Kelly AM, Uddin LQ, Gotimer K, Biswal BB, Castellanos FX, Milham MP ( 2009): Functional connectivity of the human amygdala using resting state fMRI. Neuroimage 45: 614–626. [DOI] [PMC free article] [PubMed] [Google Scholar]
- Rozzini L, Vicini Chilovi B, Conti M, Delrio I, Borroni B, Trabucchi M, Padovani A ( 2008): Neuropsychiatric symptoms in amnestic and nonamnestic mild cognitive impairment. Dement Geriatr Cogn Disord 25: 32–36. [DOI] [PubMed] [Google Scholar]
- Schweitzer I, Tuckwell V, O'Brien J, Ames D ( 2002): Is late onset depression a prodrome to dementia? Int. J Geriatr Psychiatry 17: 997–1005. [DOI] [PubMed] [Google Scholar]
- Sheline YI, Barch DM, Price JL, Rundle MM, Vaishnavi SN, Snyder AZ, Mintun MA, Wang S, Coalson RS, Raichle ME ( 2009): The default mode network and self‐referential processes in depression. Proc Natl Acad Sci USA 106: 1942–1947. [DOI] [PMC free article] [PubMed] [Google Scholar]
- Sheline YI, Price JL, Yan ZZ, Mintun MA ( 2010): Resting‐state functional MRI in depression unmasks increased connectivity between networks via the dorsal nexus. Proc Natl Acad Sci USA 107: 11020–11025. [DOI] [PMC free article] [PubMed] [Google Scholar]
- Siegle GJ, Steinhauer SR, Thase ME, Stenger VA, Carter CS ( 2002): Can't shake that feeling: Event‐related fMRI assessment of sustained amygdala activity in response to emotional information in depressed individuals. Biol Psychiatry 51: 693–707. [DOI] [PubMed] [Google Scholar]
- Siegle GJ, Thompson W, Carter CS, Steinhauer SR, Thase ME ( 2007): Increased amygdala and decreased dorsolateral prefrontal BOLD responses in unipolar depression: Related and independent features. Biol Psychiatry 61: 198–209. [DOI] [PubMed] [Google Scholar]
- Small GW, Kepe V, Ercoli LM, Siddarth P, Bookheimer SY, Miller KJ, Lavretsky H, Burggren AC, Cole GM, Vinters HV, Thompson PM, Huang SC, Satyamurthy N, Phelps ME, Barrio JR ( 2006): PET of brain amyloid and tau in mild cognitive impairment. N. Engl J Med 355: 2652–2663. [DOI] [PubMed] [Google Scholar]
- Smith GS, Kramer E, Ma Y, Kingsley P, Dhawan V, Chaly T, Eidelberg D. ( 2009a): The functional neuroanatomy of geriatric depression. Int J Geriatr Psychiatry 24: 798–808. [DOI] [PMC free article] [PubMed] [Google Scholar]
- Smith SM, Fox PT, Miller KL, Glahn DC, Fox PM, Mackay CE, Filippini N, Watkins KE, Toro R, Laird AR, Beckmann CF ( 2009b): Correspondence of the brain's functional architecture during activation and rest. Proc Natl Acad Sci USA 106: 13040–13045. [DOI] [PMC free article] [PubMed] [Google Scholar]
- Spielberg JM, Stewart JL, Levin RL, Miller GA, Heller W ( 2008): Prefrontal cortex, emotion, and approach/withdrawal motivation. Soc Personal Psychol Compass 2: 135–153. [DOI] [PMC free article] [PubMed] [Google Scholar]
- Stark CE, Squire LR ( 2001): When zero is not zero: The problem of ambiguous baseline conditions in fMRI. Proc Natl Acad Sci USA 98: 12760–12766. [DOI] [PMC free article] [PubMed] [Google Scholar]
- Steffens DC, Otey E, Alexopoulos GS, Butters MA, Cuthbert B, Ganguli M, Geda YE, Hendrie HC, Krishnan RR, Kumar A, Lopez OL, Lyketsos CG, Mast BT, Morris JC, Norton MC, Peavy GM, Petersen RC, Reynolds CF, Salloway S, Welsh‐Bohmer KA, Yesavage J ( 2006): Perspectives on depression, mild cognitive impairment, and cognitive decline. Arch Gen Psychiatry 63: 130–138. [DOI] [PubMed] [Google Scholar]
- Stein JL, Wiedholz LM, Bassett DS, Weinberger DR, Zink CF, Mattay VS, Meyer‐Lindenberg A ( 2007a): A validated network of effective amygdala connectivity. Neuroimage 36: 736–745. [DOI] [PubMed] [Google Scholar]
- Stein MB, Simmons AN, Feinstein JS, Paulus MP ( 2007b): Increased amygdala and insula activation during emotion processing in anxiety‐prone subjects. A_. J Psychiatry 164: 318–327. [DOI] [PubMed] [Google Scholar]
- Striepens N, Scheef L, Wind A, Popp J, Spottke A, Cooper‐Mahkorn D, Suliman H, Wagner M, Schild HH, Jessen F ( 2010): Volume loss of the medial temporal lobe structures in subjective memory impairment. Dement Geriatr Cogn Disord 29: 75–81. [DOI] [PubMed] [Google Scholar]
- Tambini A, Ketz N, Davachi L ( 2010): Enhanced brain correlations during rest are related to memory for recent experiences. Neuron 65: 280–290. [DOI] [PMC free article] [PubMed] [Google Scholar]
- Van Essen DC ( 2005): A population‐average, landmark‐ and surface‐based (PALS) atlas of human cerebral cortex. Neuroimage 28: 635–662. [DOI] [PubMed] [Google Scholar]
- Wang L, Krishnan KR, Steffens DC, Potter GG, Dolcos F, McCarthy G ( 2008): Depressive state‐ and disease‐related alterations in neural responses to affective and executive challenges in geriatric depression. A. J Psychiatry 165: 863–871. [DOI] [PubMed] [Google Scholar]
- Wilson RS, Barnes LL, Mendes de Leon CF, Aggarwal NT, Schneider JS, Bach J, Pilat J, Beckett LA, Arnold SE, Evans DA, Bennett DA ( 2002): Depressive symptoms, cognitive decline, and risk of AD in older persons. Neurology 59: 364–370. [DOI] [PubMed] [Google Scholar]
- Xu G, Antuono PG, Jones J, Xu Y, Wu G, Ward D, Li SJ ( 2007): Perfusion fMRI detects deficits in regional CBF during memory‐encoding tasks in MCI subjects. Neurology 69: 1650–1656. [DOI] [PubMed] [Google Scholar]
- Xu GF, Xu Y, Wu GH, Antuono PG, Hammeke TA, Li SJ ( 2006): Task‐modulation of functional synchrony between spontaneous low‐frequency oscillations in the human brain detected by fMRI. Magn Reson Med 56: 41–50. [DOI] [PubMed] [Google Scholar]
- Xu Y, Xu G, Wu G, Antuono P, Rowe DB, Li SJ ( 2008): The phase shift index for marking functional asynchrony in Alzheimer's disease patients using fMRI. Magn Reson Imaging 26: 379–392. [DOI] [PMC free article] [PubMed] [Google Scholar]
- Zar J ( 1996): Biostatistical Analysis, 3rd ed Upper Saddle River, NJ: Prentice‐Hall, Inc. [Google Scholar]
- Zhou Y, Yu CS, Zheng H, Liu Y, Song M, Qin W, Li KC, Jiang TZ ( 2010): Increased neural resources recruitment in the intrinsic organization in major depression. J Affect Disord 121: 220–230. [DOI] [PubMed] [Google Scholar]