

Abstract
In order to investigate simultaneous MR temperature imaging and direct validation of tissue damage during thermal therapy, temperature-dependent signal changes in proton resonance frequency (PRF) shifts, R2* values, and T1-weighted amplitudes are measured from one technique in ex vivo tissue heated with a 980-nm laser at 1.5T and 3.0T. Using a multi-gradient echo acquisition and signal modeling with the Stieglitz-McBride algorithm, the temperature sensitivity coefficient (TSC) values of these parameters are measured in each tissue at high spatiotemporal resolutions (1.6×1.6×4mm3,≤5sec) at the range of 25-61 °C. Non-linear changes in MR parameters are examined and correlated with an Arrhenius rate dose model of thermal damage. Using logistic regression, the probability of changes in these parameters is calculated as a function of thermal dose to determine if changes correspond to thermal damage. Temperature calibrations demonstrate TSC values which are consistent with previous studies. Temperature sensitivity of R2* and, in some cases, T1-weighted amplitudes are statistically different before and after thermal damage occurred. Significant changes in the slopes of R2* as a function of temperature are observed. Logistic regression analysis shows that these changes could be accurately predicted using the Arrhenius rate dose model (Ω=1.01±0.03), thereby showing that the changes in R2* could be direct markers of protein denaturation. Overall, by using a chemical shift imaging technique with simultaneous temperature estimation, R2* mapping and T1-W imaging, it is shown that changes in the sensitivity of R2* and, to a lesser degree, T1-W amplitudes are measured in ex vivo tissue when thermal damage is expected to occur according to Arrhenius rate dose models. These changes could possibly be used for direct validation of thermal damage in contrast to model-based predictions.
Keywords: magnetic resonance temperature imaging, proton resonance frequency shift, thermometry, hyperthermia, thermal ablation, multi-gradient echo, apparent spin-spin relaxation
Introduction
Image-guided minimally-invasive thermal therapies are increasingly being integrated into cancer patient management. These procedures are often facilitated by image-based feedback for treatment monitoring from modalities such as ultrasound (1) and computerized tomography (2), but increasingly, magnetic resonance (MR) imaging is being integrated into many of these interventional procedures owing to its high sensitivity to temperature changes (3) (4). Additionally, MR has the desired properties of providing a wealth of soft-tissue contrast mechanisms for planning, targeting, and post-treatment verification in any arbitrary plane without the use of ionizing radiation. Because of its ability also to provide quantitative as well as qualitative guidance for these procedures, magnetic resonance temperature imaging (MRTI) is quickly being recognized as a primary way to provide non-invasive, rapid, and quantitative temperature feedback during treatment delivery (5).
Numerous MR parameters can be exploited for temperature measurements; however, not all are equally useful for guiding thermal therapies. For instance, changes in T1 and T1-weighted magnitude images with temperature have been reported as being linear, up to a certain temperature, before demonstrating a deviation from this relationship (6,7). Unpredictable deviations from linearity make it difficult to ascertain accurate readings at high temperatures. One of the most commonly employed quantitative MRTI methods is based on the proton resonant frequency (PRF) shift (8-10), which has been established and validated as a technique of monitoring temperature changes for control of thermal therapies at various anatomical sites (11). The PRF shift is linear with temperature changes well above where ablation occurs and, unlike other parameters, is relatively insensitive to tissue type (12). While temperature change is measured using the PRF method using either phase difference (13) or chemical shift (11) techniques, actual damage to tissue is a rate process that has a complex dependence on the tissue type and the temperature exposure history. Determination of damage during temperature imaging tends to rely on empirically established metrics of tissue damage. In the realm of high temperature tissue ablation, temperature isotherms may be employed as well as cumulative damage models such as the “cumulative effective time at 43 °C” and Arrhenius rate models. These thermal dose models are then used to predict thermal damage based on the temperature or temperature history (14). Post-treatment imaging is also performed to validate where thermal damage has occurred (15).
Recently, a fast chemical shift imaging (CSI) technique has been introduced which can produce PRF temperature maps with high accuracy and precision at relatively high spatiotemporal resolutions (16,17). Using this technique, the temperature sensitivity coefficient (TSC) was measured in each tissue by calculating the PRF shift as a function of temperature measured from a fluoroptic probe. This technique also has the capability to provide R2* maps and T1-weighted images in addition to providing the PRF. In this work, we measured the R2* and T1-weighted image response to ablative temperatures measured by the PRF shift in various ex vivo tissues to determine their usefulness in thermal therapy monitoring and in direct verification of thermal damage.
Materials and Methods
Canine bone marrow, brain, kidney, liver and prostate tissue were treated ex vivo using a room-temperature water-cooled applicator housing a 980-nm laser fiber with a 1-cm diffusing tip powered by a 15 W diode laser source (BioTex Inc., Houston, TX) on clinical MR scanners at 1.5T (Excite HD, GE Healthcare, Waukesha, WI) and 3.0T (TwinSpeed Excite HD, GE Healthcare, Waukesha, WI). A fluoroptic temperature probe (M3300, Luxtron, Santa Clara, CA) was placed in the tissue at approximately 1.0 cm lateral to the laser fiber in order to provide an absolute measurement of temperature. All tissues were harvested during necropsy procedures from animals being utilized in a separate study and all experiments involving animals were performed in accordance with an Animal Care and Use Protocol approved by our Institutional Animal Care and Use Committee.
In each ablation, the multi-gradient echo (MGE) acquisition (18) (1.5T: 16 echoes; minimum TE (TE0)=2.0 ms; echo-spacing=3.2 ms; rBW=244 Hz/pixel, TR=69 ms; FA=30-40°; acquisition matrix=128×128; voxel volume=1.6×1.6×4.0 mm3; parallel imaging acceleration factor=2; acquisition time = 5 sec/image. 3.0T: identical to 1.5T except TE0=2.1 ms; ESP=1.8 ms; rBW=325 Hz/pixel) was used continuously throughout the ablation in addition to 30 seconds of baseline acquisitions before heating as well as acquisitions during cooling. Echoes were acquired with consistent polarity readout gradients separated by flyback rewinder gradients. While the high ESP resulted in aliasing of peaks in the spectra, the ESP was carefully selected such that these peaks would not spectrally alias into water peaks. This facilitated use of lower receiver bandwidths for higher SNR and negated the need for echo interleaving at 3.0T (16). The PRF, R2* and amplitude measurements of water (in addition to methylene and methyl protons from triglycerides in the bone marrow, if present) were calculated using the Steiglitz-McBride (SM) algorithm, which utilizes an autoregressive moving average (ARMA) model of the MGE acquisition. Briefly, the MGE signal is transformed into the z-domain and is expressed as a rational polynomial. The SM algorithm iteratively approximates the coefficients of the rational polynomial. The poles of this polynomial contains the PRF and R2* of each peak in the spectra. Using Cauchy's residue theorem, the T1-W amplitude can also be calculated. Details of this algorithm can be found in recent publications (16) (17).
In each tissue ablation, a 2 × 2-voxel ROI adjacent to the sensitive region of the fluoroptic probe was chosen and the PRFs were plotted as a function of temperature. The slope (ppm/°C) of these plots, which is the temperature sensitivity coefficient (TSC), and correlation coefficient were calculated for each temperature sensitivity calibration using linear least-squares regression analysis. Using the calculated water TSC values, the changes in the PRFs were converted to temperature changes and added to the baseline temperature provided by the fluoroptic temperature probe; thereby providing absolute temperature readings.
The dose was calculated from the Arrhenius rate model for thermal damage where
| [1] |
A is the frequency factor, Ea is the activation energy, R is the universal gas constant (8.315 JK-1mol-1) and T(τ) is the temperature in degrees Celsius as a function of time, τ (19). A and Ea values were chosen to predict protein denaturation (A: 3.1 × 1098 s-1, Ea: 6.3 × 10⁵ J mol-1) (20). Ω≥1.0 signified tissue damage, a threshold that has been used in previous studies (21,22). According to this rate theory, the surviving fraction of cells can be calculated according to
| [2] |
(19).
ROIs (2 × 2 voxels) were then chosen in areas that reached ablative temperatures with each voxel processed individually. The temperature, thermal dose, R2* and amplitude were calculated in each ROI. An inflection point, demonstrated by a sharp shift in the slope from positive polarity to negative polarity, could be observed in most of the plots of R2* versus time. An individual who was blinded to the temperature and thermal dose data labeled the data points as 0 before the inflection point and 1 after the inflection point with respect to time on the R2* plot. The inflection point was defined as the point after a local maximum or minimum R2* with five consecutively decreasing or increasing values after the local maximum or minimum. This was not done on the T1-W amplitudes since inflection points or shifts in the values could not be seen in some tissues when temperature and thermal dose values were blinded.
Next, logistic regression (23) was used to calculate the probability that the observed change in R2* (as shown by the binary descriptors) occur at thermal dose, Ω. The probability, P, of the logistic regression, or logit, curve is defined as
| [3] |
where α and β are coefficients determined by the fit. The dose was recorded where the probability of the fit equaled 0.5 (also known as LD50). The purpose of this measurement is to characterize the signal change as a function of thermal dose to determine if the changes in the MR signal occur where thermal damage is expected to occur. The slopes of the R2* and amplitude estimates in each ROI were measured before and after the inflection point with respect to temperature and compared using a two-tailed Student's t-test with equal variances (as determined by an F-Test).
To demonstrate visually how changes correspond to the Arrhenius rate dose model, voxels were labeled where inflection points were detected over the treatment. As in the logit analysis, the inflection point was defined as the point after a local maximum or minimum R2* with five consecutively decreasing or increasing values after the local maximum or minimum. This was compared spatially with the Arrhenius dose rate model. The overlap over both metrics was calculated using the Dice similarity coefficient (DSC) (24). Given the damage indicated by R2* (ψR2*) and Arrhenius dose (ψΩ) is calculated as
| [4] |
Results
Water proton resonance frequency TSC values of each of the tissues are shown in Table 1. All non-fatty tissues' (brain, prostate, kidney and liver) TSCs are within the 95% confidence interval of what has been previously reported in water and soft tissue (-0.0097 ppm/°C, -0.0098 ppm/°C for brain (25)). The water TSC in bone marrow has an average TSC of -0.0110 ± 1.67×10⁻⁴ ppm/°C (R2=0.977). The marrow contains a high amount of triglycerides which are represented by several broad peaks (i.e. methylene ((CH2)n and CO-CH2-(CH2)n), methyl (CH3) (26) in the low-spectral resolution, high spatiotemporal resolution spectra. By taking the TSC of water minus bulk methylene (CH2)n PRF (to account for susceptibility and drift by using bulk methylene as an internal standard) in bone marrow, the average TSC is -0.0087 ± 5.4×10⁻⁴ ppm/°C (R2=0.941). This value is consistent with reported values for tissue and phantoms that contain compounds with (CH2)n used as an internal reference (16,27,28). These measurements were made over a temperature range of 25 to 61 °C. These TSC values were used to calculate the change in temperature relative to the baseline temperature measured by the fluoroptic probe.
Table 1.
Water proton resonance frequency temperature sensitivity coefficients in various non-fatty tissues. TSC values were within the expected values in soft tissues. There were no shifts in linearity in the PRF. Note that bone marrow has a higher sensitivity. However, if the water PRF shift is measured with respect to the (CH2)n peak, the temperature sensitivity becomes comparable with that seen for other fatty tissues (TSC is -0.0087 ± 5.4×10⁻⁴ ppm/°C (R2=0.941)) (16,27,28).
| Tissue Type | Water PRF Temperature Sensitivity(ppm/°C) |
|---|---|
| Brain | -0.0102 ± 0.0005 (R2=0.998) |
| Prostate | -0.0099 ± 0.0004 (R2=0.995) |
| Kidney | -0.0103 ± 0.0006 (R2=0.994) |
| Liver | -0.0098 ± 0.0002 (R2=0.984) |
| Bone Marrow | -0.0110 ± 0.0002 (R2=0.977) |
Figure 1 is representative of the evolution of the water R2* and amplitude ex vivo brain tissue. Inflections in the curves are observed as Ω approaches 1.0 (57.1 ± 1.2 °C). From body temperature (36.8 ± 0.6 °C) to the break point the slope of the water R2* and amplitude was 5.5 ± 0.4 %/°C (R2=0.945) and -0.4 ± 0.1 %/°C (R2=0.799), respectively. After the inflection point, the slopes were statistically different at -4.3 ± 0.6 %/°C (R2=0.792) (p<0.001) and -1.0 ± 0.2 %/°C (R2=0.803) (p=0.02), respectively.
Figure 1.
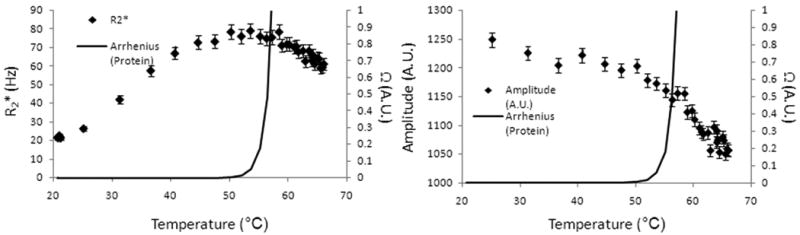
The water R2* (a) and amplitude (b) temperature response of brain tissue at 3.0T. Changes in slope can be seen when Ω approaches 1.0. The break points in the parameters were seen at 57.1 ± 1.2 °C. This corresponds to temperatures where phase changes are seen in the protein state.
Figure 2 displays the logit fits of R2* inversions related to an Arrhenius rate dose model, for each of the tissues and for all the tissues combined. N stands for the number of measurements used in the analysis. In these plots, the data is zoomed into 0≤Ω≤2.0 although Ω values greater than 2.0 were also included in the analysis. Table 2 also shows the LD50 with uncertainty along with α and β values calculated using the logit fit. In each case, Ω = 1 was within the 95% confidence interval for LD50. In the formulism by Henriques, from which the parameters used for this study are taken (20), this value was used to signify irreversible damage by protein denaturation. No consistent α or β values were measured throughout all the tissues. It is important to note that each fit reached statistical significance (p<0.03).
Figure 2.
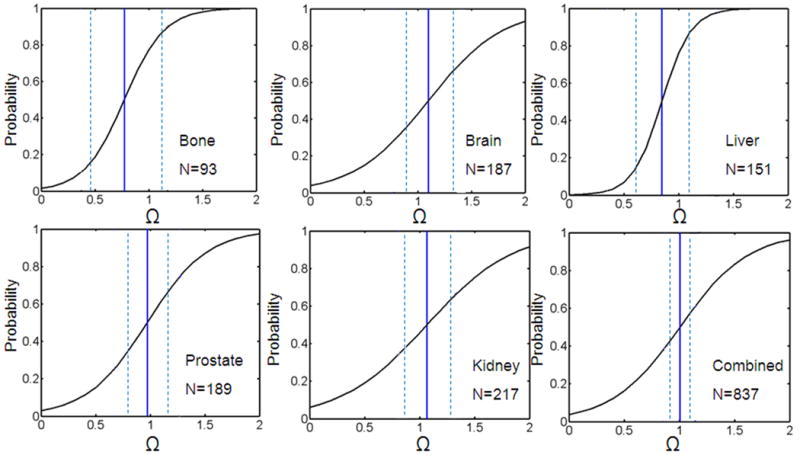
Using binomial logit analysis, the probability of 0.5 that a R2* change occurred were at thermal dose values known to cause irreversible damage as shown by Henriques (25). The black line is the logit fit. The blue solid and dashed lines are the LD50 values and the standard error, respectively. Note that there are several data points beyond Ω=2 (Range: 0-1.49×10⁷). N is the number of data points. This shows that the R2* changes are occurring where damage is expected to occur (Ω=1.0).
Table 2.
Measured LD50 values for various tissues with associated confidence intervals derived from logit analysis of dynamic changes in R2*. The dose threshold of Ω=1.0 was within the 95% confidence interval for each tissue. C(τ)/C(0) represents the fraction of cells that are damaged. The p-values calculated from the logit fit shown that the fits were statistically significant in each case.
| Tissue | α (A.U.) | β (A.U.) | LD50(Ω) | 95% CI | C(τ)/C(0) | 95% CI | p-value |
|---|---|---|---|---|---|---|---|
| Bone | -4.18 ± 1.09 | 5.41 ± 2.23 | 0.77 | (0.47,1.07) | 0.54 | (0.37,0.66) | 0.03 |
| Brain | -3.20 ± 0.50 | 2.91 ± 0.72 | 1.10 | (0.92,1.27) | 0.67 | (0.60,0.72) | <0.001 |
| Liver | -6.40 ± 1.05 | 7.56 ± 2.11 | 0.85 | (0.62,1.08) | 0.57 | (0.46,0.66) | 0.01 |
| Prostate | -3.50 ± 0.60 | 3.61 ± 0.95 | 0.97 | (0.83,1.11) | 0.62 | (0.56,0.67) | <0.001 |
| Kidney | -2.73 ± 0.35 | 2.55 ± 0.52 | 1.07 | (0.92,1.22) | 0.66 | (0.60,0.70) | <0.001 |
| Combined | -3.26 ± 0.25 | 3.24 ± 0.37 | 1.01 | (0.94,1.08) | 0.64 | (0.61,0.66) | <0.0001 |
Table 3 lists temperatures where the break points occurred according to Arrhenius rate model analysis along with the slopes between these temperatures. In all tissues except prostate, there was a statistically significant change in the R2* slope when damage is predicted to occur according to the Arrhenius dose model (p<0.001). This was more evident compared to the amplitude slopes, although significant differences in the amplitude slopes were seen in bone marrow and brain tissue.
Table 3.
Temperature break points from logit analysis with linear regression slopes above/below these points for water protons (* p<0.05,** p<0.001 compared to slope before the break point)
| R2* Slope (%/°C) | Amplitude (%/°C) | ||||
|---|---|---|---|---|---|
| Tissue | Temperature at Ω=1 | 37° to Break Point (BP) | Above BP | 37°C to BP | Above BP |
| Bone | 54.2 ± 1.2 | 2.8 ± 0.1 %/°C(R2=0.965) | -1.6 ± 0.2 %/°C (R2=0.917)** | 0.4 ± 0.1 %/°C(R2=0.824) | -1.0± 0.2 %/°C (R2=0.905)** |
| Brain | 57.1 ± 1.2 | 5.5 ± 0.4 %/°C(R2=0.945) | -4.3 ± 0.6 %/°C (R2=0.792)** | -0.4 ± 0.1 %/°C (R2=0.799) | -1.0 ± 0.2 %/°C (R2=0.803)* |
| Liver | 52.2 ± 0.4 | 0.7 ± 0.3 %/°C(R2=0.852) | -1.2 ± 0.1 %/°C (R2=0.894)** | -0.8 ± 0.3 %/°C (R2=0.874) | -0.9 ± 0.2 %/°C (R2=0.924) |
| Prostate | 57.0 ± 1.0 | 0.2 ± 0.1 %/°C(R2=0.872) | 0.4 ± 0.1 %/°C (R2=0.565) | -0.4 ± 0.2 %/°C (R2=0.851) | -0.5 ± 0.1 %/°C (R2=0.944) |
| Kidney | 57.0 ± 0.4 | 2.1 ± 0.5 %/°C(R2=0.625) | -1.0 ± 0.4 %/°C (R2=0.717)** | -0.7 ± 0.3 %/°C (R2=0.823) | -0.7 ± 0.1 %/°C (R2=0.857) |
The R2* and signal amplitude of each peak from mostly triglycerides in bone marrow were also measured along with the Arrhenius rate estimate as seen in figure 3. For (CH2)n there was an asymptotic decrease in R2* until Ω approached unity. There was also a change in the CO-CH2-(CH2)n (p<0.001) and CH3 (p<0.05) R2* slopes as Ω approached unity. The methyl at the ends of the fatty acid chain in the triglyceride had the strongest response to temperature. As seen in water protons, the R2* slopes for each peak at Ω<1.0 were statistically different when compared to their respective R2* slopes at Ω≥1.0 (p<0.05). The slopes in the CO-CH2-(CH2)n and CH3 amplitudes were also statistically different when compared before and after Ω=1.0 (p<0.05).
Figure 3.

The R2* and signal amplitude of the broad spectral peaks from triglycerides in bone marrow were also measured along with the Arrhenius rate model estimate. For (CH2)n there is an asymptotic decrease in R2* until Ω approached unity (a). There was also a statistically significant change in the CO-CH2-(CH2)n (b) (p<0.001) and CH3 (c) (p<0.05) R2* slopes as Ω approached unity. The temperature response of the (CH2)n (d), CO-CH2-(CH2)n (e) and CH3 (f) peak amplitudes are also shown.
Permanent changes were also seen in tissue after cooling. Figure 4 shows the R2* (a) and amplitude (b) during heating and cooling in bone marrow water protons for one ablation. Once heating ended, R2* did not return back to the original value at body temperature (19.0% decrease). There was also, to a lesser degree, a difference between the water amplitudes (10.6% decrease), although the amplitudes consistently increased with decreasing temperature.
Figure 4.

Water proton R2* (a) and T1-W amplitude (b) during heating and cooling. Once heating ended the R2* was reduced when it returned to body temperature (19.0% decrease). There was also a difference between the water amplitudes (10.6% decrease) when temperature returned to body temperature. This signifies that a permanent change occurred in the tissue as a result of the ablative therapy.
The inflection points of R2* seen in the images corresponded well to Arrhenius dose rate models on a voxel by voxel basis. Figure 5 (d) displays the isotherm lines for damage according to the Arrhenius dose rate model for Ω≥1 (red) and locations where inflection points were seen in the R2* data (green). In this specific case in kidney, the DSC was calculated as 0.843 where 1.000 is a perfect overlap. Changes were evident in the ΔR2* (a) and ΔT1-W (b) images at the time point before the laser was turned off.
Figure 5.
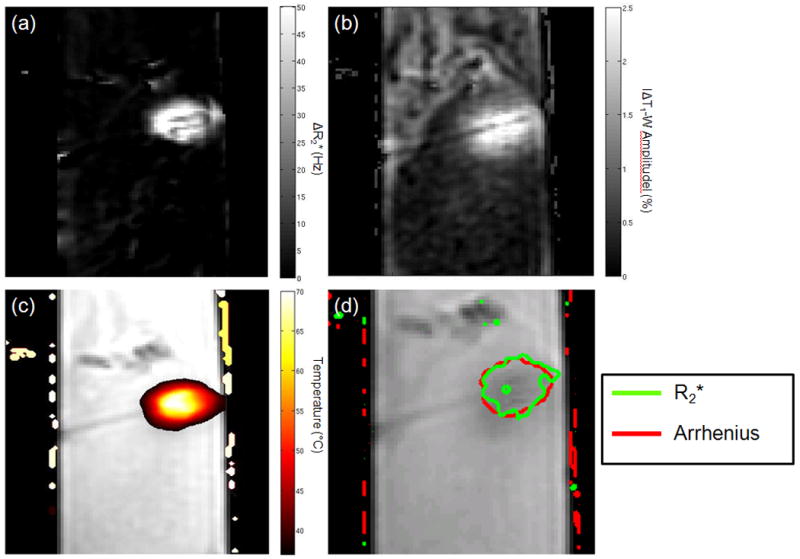
The change in R2* (a) and T1-W amplitudes (b) are evident in the area of heating as demonstrated in (c). Isotherm lines for damage from the Arrhenius dose rate model (red) corresponded to areas where inflection points were seen in R2* as a function of time. In this specific case, the overlap calculated by the DSC was 0.843.
Discussion
In this study we quantitatively correlate changes in intrinsic MR parameters to thermal damage predictions by using simultaneous PRF, R2* and peak amplitude measurements. We observed changes in linearity of the R2* and, in two tissues, T1-W amplitude signal during heating (7,29). We note that these significant changes in the temperature dependence of these parameters fall within the range where the Arrhenius rate model predicts damage (19,20). This is important since in using this method these parameters can be useful as direct verification of thermal damage while the treatment is being monitored with a highly accurate and precise PRF thermometry.
While the temperature dependence of T1 and T2 are generally understood, the mechanisms for the changes in R2* (or 1/T2*) when proteins denature are not as clear. Understanding the relationship between the dynamics and structure of proteins and the surrounding water measured by the MR signal has been described as a current challenge (30). Possible theories to these changes due to the protein denaturation include the change in the dipolar coupling between water molecules and denatured proteins (31). Additionally, release of water in the hydration layers of the denaturing proteins may explain the decrease in R2* (30) at higher temperatures. In the prostate tissue, the R2* increased instead of decreasing as in other tissues. One possible explanation is the presence of myoglobin in the prostate (32). When the myoglobin denatures, iron will be released from the protein and be oxidized in the tissue. This denaturation has been measured at 58 °C, which is in very good agreement to where a shift was seen in the R2* plot as a function of temperature (33). This may also explain why the T1-W response to temperature was lower in prostate when compared to the other tissues since iron also modulates T1 (34). It is also important to note that these changes are from multiple effects including temperature and protein denaturation. As shown in figure 4, since the parameters did not go back to baseline this suggests mechanisms are in play, such as protein denaturation, in addition to temperature. While the incremental changes in these parameters correspond to temperature changes, the abrupt shifts, which are highly correlated with Arrhenius rate dose model predictions of thermal damage, may correspond more to protein denaturation than temperature.
Several groups have studied the temperature dependence in T1 (35-41). Matsumoto et al. measured changes in the T1-W signal with a rapid acquisition with relaxation enhancement (RARE) sequence (41). They reported a 0.7 to 1.0 %/°C change in the signal intensity in liver, which corroborates with our results. They also reported a nonlinear response near 50 °C, similar to what we observed in our work. Young et al. measured a linear T1 sensitivity to temperature in bone marrow which also corroborates our measured sensitivity of 0.4 ± 0.1 %/°C (7). Additionally, Graham et al. also demonstrated a permanent shift in T2 values, which is similar to what we observed with T2* (1/R2*) (Figure 4) (42). To the best of our knowledge, there has been no studies investigating the temperature dependence of R2* or on using R2* has a marker for thermal damage. Our data suggest that R2* mapping is a stronger marker to signify thermal damage when compared to T1-W imaging.
In these previous studies, invasive temperature measurements were made through temperature probes. What also makes this study different is that, in addition to temperature verification with fluoroptic probes, we were able to measure the 2D temperature distribution once we calibrated the PRF for the tissue. We were also able to use thermal dose to measure the changes in these parameters with temperature at multiple points. In making absolute temperature measurements by using the probe as a baseline temperature for the tissue, we took special care to ensure that the entire tissue was at a homogenous baseline temperature.
Overall, this study demonstrates that spectral estimates may provide information on physical tissue changes taking place during heating, such as conformational phase transitions of proteins, which directly influence the proton chemical macroenvironment, and in turn affect relaxation values such as R2*. These observations warrant further investigation in vivo and in other tissue. Further studies will determine if adjunctive treatments such as introduction of heat sensitization agents or irradiation affect the temperature or thermal dose where these R2* and amplitude sensitivity changes occur. This would help validate this method as a valuable tool to evaluate if a therapy lowers the temperature or thermal dose needed to effectively damage the targeted tissue.
Conclusion
By using thermal dose and temperature results from logistic regression analysis, we show that statistically significant changes in the temperature response of R2* values in various ex vivo tissues at doses where thermal damage is expected to occur. R2* was observed to be more sensitive to thermally induced conformational changes in the tissue compared to T1-W signals, which exhibited changes in temperature sensitivity in only two of the five tissues investigated. The CSI methods applied here enable robust temperature imaging via measurement of the PRF, and may also provide additional important measurements during treatment for direct verification of thermal damage during ablative treatment delivery.
Acknowledgments
This work was supported in part by National Institutes of Health/National Cancer Institute training grant 5T32CA119930.
Grant Support: NIH/NCI Training Grant 5T32CA119930
Abbreviations
- MRTI
magnetic resonance temperature imaging
- PRF
proton resonant frequency
- CSI
chemical shift imaging
- MGE
multi-gradient echo
- SM
Steiglitz-McBride
- ARMA
autoregressive moving average
- TSC
temperature sensitivity coefficient
- DSC
Dice similarity coefficient
References
- 1.Daniels MJ, Varghese T, Madsen EL, Zagzebski JA. Non-invasive ultrasound-based temperature imaging for monitoring radiofrequency heating-phantom results. Phys Med Biol. 2007;52(16):4827–4843. doi: 10.1088/0031-9155/52/16/008. [DOI] [PubMed] [Google Scholar]
- 2.Fallone BG, Moran PR, Podgorsak EB. Noninvasive thermometry with a clinical x-ray CT scanner. Med Phys. 1982;9(5):715–721. doi: 10.1118/1.595117. [DOI] [PubMed] [Google Scholar]
- 3.Salomir R, Vimeux FC, de Zwart JA, Grenier N, Moonen CT. Hyperthermia by MR-guided focused ultrasound: accurate temperature control based on fast MRI and a physical model of local energy deposition and heat conduction. Magn Reson Med. 2000;43(3):342–347. doi: 10.1002/(sici)1522-2594(200003)43:3<342::aid-mrm4>3.0.co;2-6. [DOI] [PubMed] [Google Scholar]
- 4.Denis de Senneville B, Quesson B, Moonen CT. Magnetic resonance temperature imaging. Int J Hyperthermia. 2005;21(6):515–531. doi: 10.1080/02656730500133785. [DOI] [PubMed] [Google Scholar]
- 5.McDannold NJ, King RL, Jolesz FA, Hynynen KH. Usefulness of MR imaging-derived thermometry and dosimetry in determining the threshold for tissue damage induced by thermal surgery in rabbits. Radiology. 2000;216(2):517–523. doi: 10.1148/radiology.216.2.r00au42517. [DOI] [PubMed] [Google Scholar]
- 6.Peller M, Reinl HM, Weigel A, Meininger M, Issels RD, Reiser M. T1 relaxation time at 0.2 Tesla for monitoring regional hyperthermia: feasibility study in muscle and adipose tissue. Magn Reson Med. 2002;47(6):1194–1201. doi: 10.1002/mrm.10155. [DOI] [PubMed] [Google Scholar]
- 7.Young IR, Hand JW, Oatridge A, Prior MV. Modeling and observation of temperature changes in vivo using MRI. Magn Reson Med. 1994;32(3):358–369. doi: 10.1002/mrm.1910320311. [DOI] [PubMed] [Google Scholar]
- 8.Hindman JC. Proton resonance shift of water in the gas and liquid states. Journal of Chemical Physics. 1966;44(12):4582–4592. [Google Scholar]
- 9.Schneider WG, Bernstein HJ, Pople JA. Proton Magnetic Resonance Chemical Shift of Free (gaseous) and Associated (liquid) Hydride Molecules. J Chem Phys. 1958;284:601. [Google Scholar]
- 10.de Zwart JA, van Gelderen P, Kelly DJ, Moonen CT. Fast magnetic-resonance temperature imaging. J Magn Reson B. 1996;112(1):86–90. doi: 10.1006/jmrb.1996.0115. [DOI] [PubMed] [Google Scholar]
- 11.Kuroda K. Non-invasive MR thermography using the water proton chemical shift. Int J Hyperthermia. 2005;21(6):547–560. doi: 10.1080/02656730500204495. [DOI] [PubMed] [Google Scholar]
- 12.Peters RD, Hinks RS, Henkelman RM. Ex vivo tissue-type independence in proton-resonance frequency shift MR thermometry. Magn Reson Med. 1998;40(3):454–459. doi: 10.1002/mrm.1910400316. [DOI] [PubMed] [Google Scholar]
- 13.Ishihara Y, Calderon A, Watanabe H, Okamoto K, Suzuki Y, Kuroda K. A precise and fast temperature mapping using water proton chemical shift. Magn Reson Med. 1995;34(6):814–823. doi: 10.1002/mrm.1910340606. [DOI] [PubMed] [Google Scholar]
- 14.Mertyna P, Goldberg W, Yang W, Goldberg SN. Thermal ablation a comparison of thermal dose required for radiofrequency-, microwave-, and laser-induced coagulation in an ex vivo bovine liver model. Acad Radiol. 2009;16(12):1539–1548. doi: 10.1016/j.acra.2009.06.016. [DOI] [PMC free article] [PubMed] [Google Scholar]
- 15.Breen MS, Lazebnik RS, Fitzmaurice M, Nour SG, Lewin JS, Wilson DL. Radiofrequency thermal ablation: correlation of hyperacute MR lesion images with tissue response. J Magn Reson Imaging. 2004;20(3):475–486. doi: 10.1002/jmri.20143. [DOI] [PubMed] [Google Scholar]
- 16.Taylor BA, Hwang KP, Elliott AM, Shetty A, Hazle JD, Stafford RJ. Dynamic chemical shift imaging for image-guided thermal therapy: analysis of feasibility and potential. Med Phys. 2008;35(2):793–803. doi: 10.1118/1.2831915. [DOI] [PubMed] [Google Scholar]
- 17.Taylor BA, Hwang KP, Hazle JD, Stafford RJ. Autoregressive Moving Average Modeling for Spectral Parameter Estimation from a Multi-Gradient Echo Chemical Shift Acquisition. Med Phys. 2009;36(3):753–764. doi: 10.1118/1.3075819. [DOI] [PMC free article] [PubMed] [Google Scholar]
- 18.Storey P, Thompson AA, Carqueville CL, Wood JC, de Freitas RA, Rigsby CK. R2* imaging of transfusional iron burden at 3T and comparison with 1.5T. J Magn Reson Imaging. 2007;25(3):540–547. doi: 10.1002/jmri.20816. [DOI] [PMC free article] [PubMed] [Google Scholar]
- 19.Welch AJ. IEEE Journal of Quantum Electronics. 12. QE-20. 1984. The thermal response of laser irradiated tissue; p. 11. [Google Scholar]
- 20.Henriques FC. The predictability and significance of thermally induced rate processes leading to irreversible epidermal injury. Arch Pathol. 1947;43:489. [PubMed] [Google Scholar]
- 21.Carpentier A, McNichols RJ, Stafford RJ, Itzcovitz J, Guichard JP, Reizine D, Delaloge S, Vicaut E, Payen D, Gowda A, George B. Real-time magnetic resonance-guided laser thermal therapy for focal metastatic brain tumors. Neurosurgery. 2008;63(1 Suppl 1):ONS21–28. doi: 10.1227/01.neu.0000335007.07381.df. discussion ONS28-29. [DOI] [PubMed] [Google Scholar]
- 22.McNichols RJ, Gowda A, Kangasniemi M, Bankson JA, Price RE, Hazle JD. MR thermometry-based feedback control of laser interstitial thermal therapy at 980 nm. Lasers Surg Med. 2004;34(1):48–55. doi: 10.1002/lsm.10243. [DOI] [PubMed] [Google Scholar]
- 23.Begg CB. Statistical methods in medical diagnosis. Crit Rev Med Inform. 1986;1(1):1–22. [PubMed] [Google Scholar]
- 24.Dice LR. Measures of the amount of ecologic association between species. Ecology. 1945;26(3):297–302. [Google Scholar]
- 25.Chen L, Wansapura JP, Heit G, Butts K. Study of laser ablation in the in vivo rabbit brain with MR thermometry. J Magn Reson Imaging. 2002;16(2):147–152. doi: 10.1002/jmri.10152. [DOI] [PubMed] [Google Scholar]
- 26.Schick F. Bone marrow NMR in vivo. J Prog Nuc Mag Spect. 1996;29:169–227. [Google Scholar]
- 27.McDannold N, Hynynen K, Oshio K, Mulkern RV. Temperature monitoring with line scan echo planar spectroscopic imaging. Med Phys. 2001;28(3):346–355. doi: 10.1118/1.1350434. [DOI] [PubMed] [Google Scholar]
- 28.De Poorter J. Noninvasive MRI thermometry with the proton resonance frequency method: study of susceptibility effects. Magn Reson Med. 1995;34(3):359–367. doi: 10.1002/mrm.1910340313. [DOI] [PubMed] [Google Scholar]
- 29.Chen J, Daniel BL, Pauly KB. Investigation of proton density for measuring tissue temperature. J Magn Reson Imaging. 2006;23(3):430–434. doi: 10.1002/jmri.20516. [DOI] [PubMed] [Google Scholar]
- 30.Mallamace F, Chen SH, Broccio M, Corsaro C, Crupi V, Majolino D, Venuti V, Baglioni P, Fratini E, Vannucci C, Stanley HE. Role of the solvent in the dynamical transitions of proteins: the case of the lysozyme-water system. J Chem Phys. 2007;127(4):045104. doi: 10.1063/1.2757171. [DOI] [PubMed] [Google Scholar]
- 31.Bouchard LS, Bronskill MJ. Magnetic resonance imaging of thermal coagulation effects in a phantom for calibrating thermal therapy devices. Med Phys. 2000;27(5):1141–1145. doi: 10.1118/1.598980. [DOI] [PubMed] [Google Scholar]
- 32.Manaskova P, Rylava H, Ticha M, Jonakova V. Characterization of proteins from boar prostate. Am J Reprod Immunol. 2002;48(4):283–290. doi: 10.1034/j.1600-0897.2002.01138.x. [DOI] [PubMed] [Google Scholar]
- 33.Ochiai Y, Watanabe Y, Ozawa H, Ikegami S, Uchida N, Watabe S. Thermal denaturation profiles of tuna myoglobin. Biosci Biotechnol Biochem. 2010;74(8):1673–1679. doi: 10.1271/bbb.100290. [DOI] [PubMed] [Google Scholar]
- 34.Wang YX, Hussain SM, Krestin GP. Superparamagnetic iron oxide contrast agents: physicochemical characteristics and applications in MR imaging. Eur Radiol. 2001;11(11):2319–2331. doi: 10.1007/s003300100908. [DOI] [PubMed] [Google Scholar]
- 35.Bloembergen N, P EM, Pound RV. Relaxation effects in nuclear magnetic resonance absorption. Phys Rev. 1948;73:679–712. [Google Scholar]
- 36.Parker DL, Smith V, Sheldon P, Crooks LE, Fussell L. Temperature distribution measurements in two-dimensional NMR imaging. Med Phys. 1983;10(3):321–325. doi: 10.1118/1.595307. [DOI] [PubMed] [Google Scholar]
- 37.Lewa CJ, Majewska Z. Temperature relationships of proton spin-lattice relaxation time T1 in biological tissues. Bull Cancer. 1980;67(5):525–530. [PubMed] [Google Scholar]
- 38.Cline HE, Hynynen K, Hardy CJ, Watkins RD, Schenck JF, Jolesz FA. MR temperature mapping of focused ultrasound surgery. Magn Reson Med. 1994;31(6):628–636. doi: 10.1002/mrm.1910310608. [DOI] [PubMed] [Google Scholar]
- 39.Hynynen K, McDannold N, Mulkern RV, Jolesz FA. Temperature monitoring in fat with MRI. Magn Reson Med. 2000;43(6):901–904. doi: 10.1002/1522-2594(200006)43:6<901::aid-mrm18>3.0.co;2-a. [DOI] [PubMed] [Google Scholar]
- 40.Matsumoto R, Mulkern RV, Hushek SG, Jolesz FA. Tissue temperature monitoring for thermal interventional therapy: comparison of T1-weighted MR sequences. J Magn Reson Imaging. 1994;4(1):65–70. doi: 10.1002/jmri.1880040114. [DOI] [PubMed] [Google Scholar]
- 41.Matsumoto R, Oshio K, Jolesz FA. Monitoring of laser and freezing-induced ablation in the liver with T1-weighted MR imaging. J Magn Reson Imaging. 1992;2(5):555–562. doi: 10.1002/jmri.1880020513. [DOI] [PubMed] [Google Scholar]
- 42.Graham SJ, Bronskill MJ, Henkelman RM. Time and temperature dependence of MR parameters during thermal coagulation of ex vivo rabbit muscle. Magn Reson Med. 1998;39(2):198–203. doi: 10.1002/mrm.1910390206. [DOI] [PubMed] [Google Scholar]