Abstract
Residual acoustic hearing can be preserved in the same ear following cochlear implantation with minimally traumatic surgical techniques and short-electrode arrays. The combined electric-acoustic stimulation significantly improves cochlear implant performance, particularly speech recognition in noise. The present study measures simultaneous masking by electric pulses on acoustic pure tones, or vice versa, to investigate electric-acoustic interactions and their underlying psychophysical mechanisms. Six subjects, with acoustic hearing preserved at low frequencies in their implanted ear, participated in the study. One subject had a fully inserted 24 mm Nucleus Freedom array and five subjects had Iowa∕Nucleus hybrid implants that were only 10 mm in length. Electric masking data of the long-electrode subject showed that stimulation from the most apical electrodes produced threshold elevations over 10 dB for 500, 625, and 750 Hz probe tones, but no elevation for 125 and 250 Hz tones. On the contrary, electric stimulation did not produce any electric masking in the short-electrode subjects. In the acoustic masking experiment, 125–750 Hz pure tones were used to acoustically mask electric stimulation. The acoustic masking results showed that, independent of pure tone frequency, both long- and short-electrode subjects showed threshold elevations at apical and basal electrodes. The present results can be interpreted in terms of underlying physiological mechanisms related to either place-dependent peripheral masking or place-independent central masking.
INTRODUCTION
Auditory masking occurs when the threshold of audibility for one sound is raised by the presence of another sound. The phenomenon of masking has been used to investigate the auditory system’s ability to separate components of complex sounds and to derive cochlear excitation patterns (e.g., Patterson and Moore, 1986). Masking has also played a fundamental role in audio coding of MP3 players (Schroeder et al., 1979). In the seminal study by Wegel and Lane in 1924, it was shown that pure tone signals are more easily masked by pure tones with frequencies closer to the signal. Masked threshold shifts are thought to be due to mechanical interference on the basilar membrane, overlap in the neural domain, or suppression of neural responses due to efferent activity (e.g., Delgutte, 1990; Oxenham and Plack, 1998).
The psychophysical mechanisms that underlie masking may differ for cochlear implant (CI) users. A CI speech processor bypasses the normal hair cell function by filtering the incoming signal and mapping it onto an array of electrodes that directly stimulates different neural populations. High frequency sounds activate the basal electrodes while low frequency sounds activate the apical electrodes. However, cochlear implants are limited in the number and precision of distinct “place frequencies” because the stimulating electrodes deliver a broad electrical current field. Furthermore, channel interactions between nearby stimulating electrodes can cause current field summation peripheral to the stimulated nerves and neural-perceptual interactions following stimulation (Shannon, 1983). Because of these differences in sound transduction, it is hypothesized that masking patterns involving electric stimulations result from the auditory-nerve response or by subsequent processing from more central mechanisms along the auditory pathway.
Early cochlear implant (CI) masking experiments have measured masking by electric pulses on electric pulses from adjacent electrodes. A study involving one CI subject showed that decreasing the spatial separation between masker and probe electrodes increased the amount of forward masking (Lim et al., 1989). When the masker level was increased, both the amount of masking and spread of neural excitation increased as well. Another forward masking experiment displayed excitation patterns that had a spatial band pass characteristic with a peak in the region of the masked electrode (Chatterjee and Shannon, 1998). Temporal masking patterns in electric hearing revealed that brief signals were harder to detect at the onset of a high level masker than during the steady-state portion (Zeng et al., 2005).
Residual acoustic hearing at apical regions can now be preserved during the cochlear implant surgery using minimally traumatic surgical techniques and shorter electrode arrays that minimize potential damage to the scala media during insertion. Several studies have investigated aspects of the combined electric-acoustic stimulations or EAS (e.g., Von Ilberg et al., 1999). Although the low frequency acoustic hearing produced essentially no recognition for speech recognition in noise, it significantly enhanced performance when combined with the electric hearing of the cochlear implant (Kong et al., 2005). The Iowa∕Nucleus hybrid CI uses a 10 mm short-electrode array to preserve low frequency acoustic hearing after implantation and users have shown improved speech recognition in quiet (Gantz and Turner, 2004) and noise (Turner et al., 2004), and music perception (Gfeller et al., 2006). Despite the clinical success with combined electric-acoustic stimulations, there is no study that systematically investigates masking interactions between electric and acoustic hearing in the same ear.
METHODS
Subjects
Six CI subjects, with residual acoustic hearing preserved in their implanted ear, participated in the study. The study included one subject (LE1) with a fully inserted 24 mm Nucleus Freedom array. Low frequency acoustic hearing was preserved for subject LE1 following a surgical procedure that performed the cochleostomy anterior-inferior to the round window membrane and placed the electrode using the advance off-stylet technique.
The study also included five Iowa∕Nucleus hybrid subjects (SE1, SE3, SE21, SE26, and SE27) with short-arrays that were 10 mm in length and had electrodes in the cochlea 4.75–10 mm apical to the round window membrane. Designed based on the Nucleus CI24 implant (Cochlear Corporation), this short intracochlear electrode has a reduced diameter of 0.2 × 0.4 mm and has six active channels located in the distal 4.3 mm. With its reduced length and diameter, the Iowa∕Nucleus hybrid implant was designed to limit damage to the scala media, prevent injury to the ascending basal turn of the cochlea, and to prevent the electrode from curling on itself during insertion. The surgical procedure for the short-array was a modification of the technique used to implant a standard cochlear implant (Gantz et al., 2005).
The electrode insertion depths were not confirmed with imaging measurements for any of the participating CI subjects. The policy at the University of Iowa Cochlear Implant Program is that patients are not subjected to imaging radiation unless there is indication of malfunction or other problems with an implant. The surgeon’s reports indicated normal (i.e., full) insertion of the cochlear implant arrays, and all electrode impedances were in normal range at the time of testing.
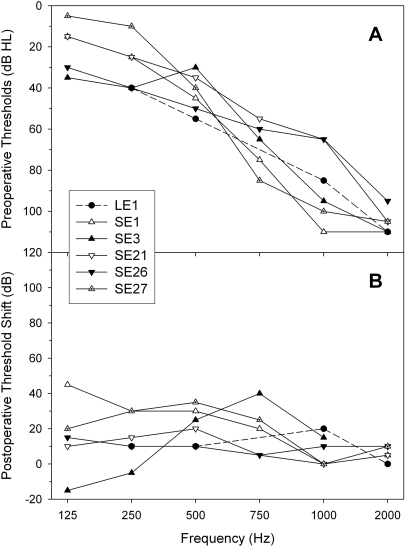
The audiograms in Fig. 1A show the preoperative thresholds for each subject. These subjects had severe-to-profound hearing loss at high frequencies and showed minimal speech recognition benefit using traditional acoustic amplification (hearing aids). Figure 1B shows the postoperative shifts in thresholds for the participating subjects at the time of testing. Residual hearing for the lower frequencies (≤ 1000 Hz) was preserved to within an average of 16 dB relative to preoperative thresholds. Test-retest variability in the audiology clinic is +∕− 5 dB (95% confidence interval). Subject SE3 showed higher preoperative thresholds at some frequencies, a phenomenon typically attributed to middle ear problems during the initial measurement. All subjects had postoperative thresholds of 75 dB hearing level or lower for 125–500 Hz. Subjects were all post-linguistically deafened adults with cochlear implant experience over 12 months. Both Institutional Review Board approval and written informed consent were obtained at University of California, Irvine, and University of Iowa.
Figure 1.
(A) Preoperative unaided audiograms of all participating subjects including one standard long-electrode subject (solid circles connected by the dashed line) and five short-electrode subjects (symbols connected by sold lines). (B) Postoperative audiometric threshold shift.
Stimuli
The acoustic stimuli presented in these masking experiments were pure tones generated using sinusoidal waveforms programmed in matlab. The acoustic stimuli were delivered to the implanted ear via Sennheiser HDA-200 headphones. Acoustic sound calibrations were conducted by coupling the Sennheiser HDA-200 headphones to a Bruel and Kjaer (B&K) 4153 artificial ear with a flat-plate coupler. The acoustic output was measured by a B&K 4192 1∕2 in. condenser microphone and read on a B&K 2260 sound level meter. The electric stimuli were trains of biphasic electric pulses delivered from a single active electrode in the cochlear implant. The external CI device was directly connected using a Freedom TV∕HiFi Stereo patch cable. In order to eliminate the external or ambient sound picked up by the CI microphone, the microphone sensitivity was decreased from the default setting of 12 to a level of 0, the mixing ratio was changed from 3:1 to 10:1, SmartSound settings were turned off, and the T-sound pressure (SPL) level and C-SPL levels were raised from 25–65 dB SPL to 44–84 dB SPL. Parameters such as pulse duration, comfort (C), and threshold (T) current levels, and stimulation rates were all set according to each subject’s clinical MAP settings (Table TABLE I.). All subjects used monopolar (MP1 + 2) stimulation and the ACE strategy. All appropriate levels and settings were programmed using Custom Sound 2.0 software and confirmed with an electrodogram monitor and the RF Statistics program.
Table 1.
Subject’s age at testing, duration of CI use, side of implant, length of electrode, and “everyday” MAP parameters.
| Subject | Age at testing (yr) | Duration of CI use (yr) | Side of implant | Length of electrode (mm) | Pulse rate (pps) | Pulse duration (μs) |
|---|---|---|---|---|---|---|
| LE1 | 51 | 1 | L | 24 | 900 | 25 |
| SE1 | 65 | 8 | R | 10 | 720 | 25 |
| SE3 | 36 | 6 | R | 10 | 720 | 25 |
| SE21 | 53 | 3 | R | 10 | 1200 | 25 |
| SE26 | 77 | 3 | R | 10 | 2400 | 12 |
| SE27 | 58 | 3 | R | 10 | 1200 | 37 |
Procedure
Two separate experiments were designed to measure the effects of ipsilateral masking between electric and acoustic stimulations. In the electric masking experiment, electric pulse trains were used as electric maskers and pure tone frequencies were used as acoustic probes. In the acoustic masking experiment, pure tone frequencies were used as acoustic maskers and electric pulse trains were used as electric probes. In both masking experiments, the detection threshold of the probes was measured using a three interval forced choice (3IFC) task without visual feedback. A graphical user interface illuminated the three 500 ms intervals in succession with 500 ms of silence in between each. One of the three intervals randomly contained a 200 ms probe signal delivered 150 ms after the onset of the interval. The probe was presented with a 10 ms cosine-squared ramp at onset and offset. Subjects were instructed to select only the interval that contained the probe. In the masked condition, 500 ms masking signals were presented during each interval. The maskers were presented with a 25 ms cosine-squared ramp at onset and offset. The amplitude level of the probe was adapted using a two-down, one-up decision rule corresponding to the 70.7% correct point on the patient’s psychometric function (Levitt, 1971). Large step sizes of 5 dB were used for the first four reversals and small step sizes of 2 dB were used for the next four reversals. The detection threshold was determined as the average of the last four reversals. The amount of masking or threshold elevation was defined as the difference between the masked threshold and the unmasked threshold. Acoustic threshold levels were recorded in units of dB SPL. Electric threshold levels were recorded in current level programming units (CL) derived from the clinical software of Cochlear, Ltd. The implanted stimulator delivers current in 256 steps ranging from approximately 10 μA at CL = 0 to approximately 1750 μA at CL = 255. The stimulator output [I(μA)] at any given CL can be derived using the formula
| (1) |
The degree of masking was also calculated as a percentage to allow comparison across electrodes, acoustic frequencies, and subjects with widely varying dynamic ranges and loudness growth functions (Lim et al., 1989). The percentage of dynamic range (% DR) for acoustic stimuli is calculated according to the equation
| (2) |
where θm is the masked threshold level, and θu is the unmasked threshold level (dB SPL). This equation can also be used to calculate the % DR for electric stimulation where θm and θu are in CL programming units. The MCL value refers to the “most-comfortable-level” of an acoustic stimulation as indicated by each subject on a standard 10-interval loudness scale. The MCL was determined by repeatedly presenting three 500 ms tones and adjusting the levels by 1–5 dB steps until the subject indicated the MCL. For electric stimulation, the MCL was set to the C-level from each subject’s most recent clinical MAP.
Electric masking
The first experiment was designed to determine what effect electric stimulations delivered from a cochlear implant had on the detection of acoustic stimuli. Acoustic thresholds were measured in quiet at 250, 500, 625, 750, or 1000 Hz, and then measured in the presence of the electric masker. Electric maskers were presented at the C-level, the MCL of each subject’s clinical settings. Electrodes E22, E16, E11, E6, and E1 were selected as electric maskers for the 24 mm array of subject LE1. Electrodes are reported in base-to-apex order, such that electrode E1 is the most basal and electrode E22 is the most apical. In preliminary tests, electric masking was observed in electrode E22, so electrodes E21, E20, E19, E18, and E17 were subsequently tested to measure the distance or spread of electric masking along the apical end of the array. The Iowa∕Nucleus hybrid subjects all had 10 mm short-arrays and electrodes E6, E5, E4, E3, E2, and E1 were selected as electric maskers.
Acoustic masking
The second experiment was designed to determine what effect acoustic pure tones had on the detection of electric stimulations. Acoustic pure tone maskers were presented at MCL or at the imposed upper limit of 110 dB SPL. Electrode probes were tested on the 24 mm array of subject LE1 and the 10 mm array of subject SE3. The electric thresholds of subject LE1were measured in quiet at electrodes E22, E16, E11, E6, and E1, and then measured in the presence of acoustic maskers at 125, 250, 500, and 625 Hz. The electric thresholds of subject SE3 were measured in quiet at electrodes E6, E5, E4, E3, E2, and E1, and then measured in the presence of acoustic maskers at 125, 250, 500, 625, and 750 Hz.
RESULTS
Electric masking
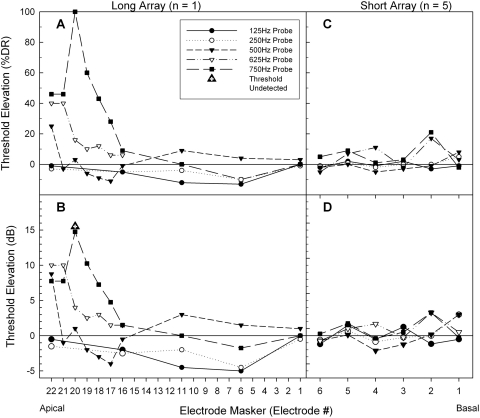
Figure 2A shows electric masking patterns for subject LE1 as a percentage of dynamic range while Fig. 2B shows the same threshold elevation in decibel units. Masking electrodes located at the apical end of the array elevated acoustic thresholds by the greatest amount. For example, electrode E22 was located at the most apical end of the array and produced 25%–46% DR (7.8–10 dB) masking on the 500, 625, and 750-Hz acoustic probes. Masker electrode E20 produced over 100% DR (> 15 dB) masking by completely preventing the subject from detecting the 750-Hz probe at the 110 dB limit of testing. This apical electrode was subsequently tested in its ability to mask a 750-Hz tone played in the opposite ear, but no contralateral electric masking was observed. In contrast to the apical electrodes, none of the middle or basal masking electrodes (E11, E6, E1) elevated acoustic thresholds by over 4 dB. A two-way analysis of variance (ANOVA) was conducted to compare the main effects of both electrode and probe frequency on threshold elevation and post hoc analyses were adjusted using Bonferroni corrections. There was no significant main effect of electrode on the mean threshold elevation [F(9, 23) = 1.663, p <0.156], but there was a significant main effect of probe frequency on the mean threshold elevation [F(4, 23) = 4.730, p <0.006]. Post hoc analysis indicated the difference was between the lowest probe frequencies (125 and 250 Hz) and the highest probe frequency (750 Hz), [p < 0.05 for all conditions]. These low probe frequencies (125 and 250 Hz) actually had lower masked thresholds than unmasked thresholds, suggesting the possibility that acoustic hearing may have been enhanced by the presence of electric stimulation.
Figure 2.
(A) Electric masking patterns reflected by threshold elevation of the pure tones (% dynamic range) as a function of masking electrode location for subject LE1. (B) Threshold elevation (in dB) for subject LE1. (C) Average threshold elevation for Iowa∕Nucleus hybrid subjects SE1, SE3, SE21, SE26, and SE27. (D) Average threshold elevation (in dB) for the five Iowa∕Nucleus hybrid subjects.
Electric masking patterns for the five Iowa∕Nucleus subjects are shown in Figs. 2C, 2D using the six electrodes of their short-arrays. The threshold elevations for acoustic probes at 125, 250, 500, 625, and 750 Hz were averaged between the participating subjects. The average acoustic threshold elevation was below 4 dB at all masking electrodes. A two-way ANOVA was conducted to compare the main effects of both electrode and probe frequency on threshold elevation. There was no significant main effect of probe frequency on the mean threshold elevation [F(4, 20) = 0.827, p = 0.523], and no significant main effect of electrode on the mean threshold elevation [F(5, 20) = 1.814, p < 0.156]. When averaging across the 6 masking electrodes, acoustic threshold elevation was minimal (mean = 0.37 dB, SD = 1.43), and nearly all of the data points fell within 2 standard deviations from the mean (± 2.85 dB). Assuming normal testing variability, these results suggest electric masking was not present for these five Iowa∕Nucleus subjects with short electrodes. Subjects SE21 and SE26 had postoperative audiometric thresholds (≤ 75 dB SPL) for 1000 Hz pure tones. Preliminary trials using electrodes E6, E5, and E4 of subject SE21 and electrode E6 of subject SE26 showed no electric masking of the 1000-Hz probe.
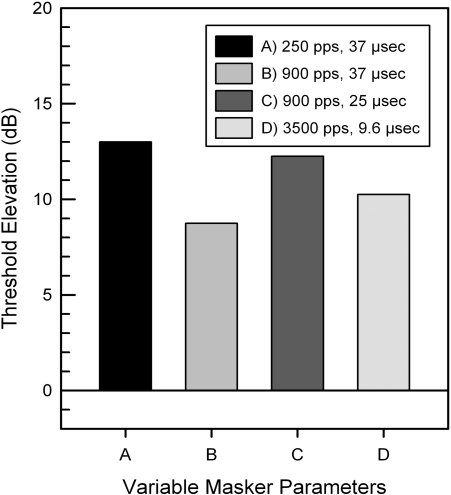
Varying the pulse rate or pulse duration of the electrode masker did not seem to alter the presence or absence of electric masking. Figure 3 shows the effect of varying electric stimulus parameters on electrode E22 of subject LE1. In spite of more than a tenfold change in pulse rate (250−3500 pps) and 2.5-fold change in pulse duration (9.6–25 μs), electrode E22 consistently masked 500-Hz probes over 40% DR (8 dB). Similarly, none of the five short-array subjects showed electric masking even though they were programmed using varying pulse rates (720–2400 pps) and pulse durations (12–36 μs). Electric masking seems to be primarily determined by the place of stimulation.
Figure 3.
Threshold elevation of a 500-Hz probe signal. Masking electrode E22 was tested for subject LE1 using variable pulse rates (pulses per second) and pulse durations (μs).
Acoustic masking
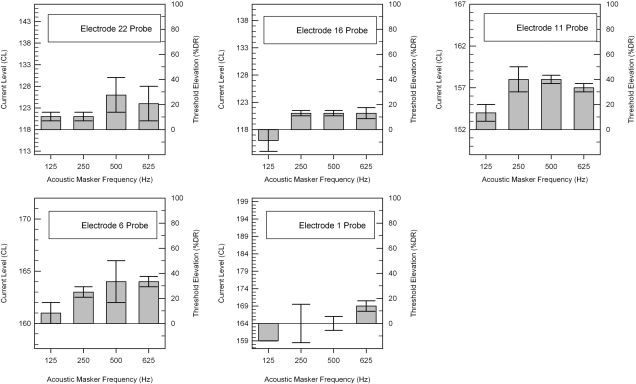
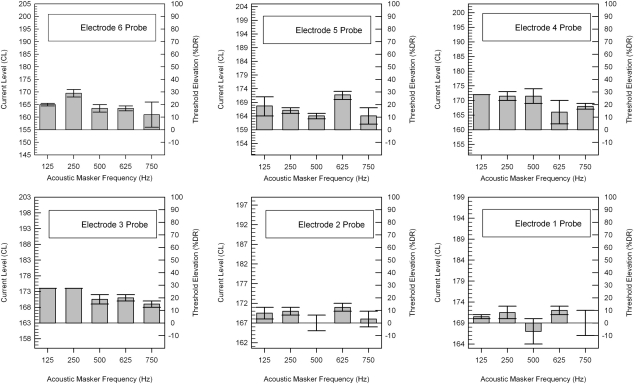
Figure 4 shows acoustic masking patterns alongthe 24 mm array of subject LE1 using electrodes E22, E16, E11, E6, and E1 as electric probes. The y axis on the right side of each graph displays threshold elevation as a percentage of dynamic range. The different clinically programmed C-levels, T-levels, and dynamic ranges for each electrode are indicated by the y axis on the left side of each graph. The top and bottom of the error bars indicate the two masked threshold levels from two trials, and show the range of responses. The height of the solid bar indicates the averaged masked threshold level from the two individual trials. Acoustic masking tones at 125, 250, 500, and 625 Hz elevated electric thresholds for electrodes E22, E16, E11, and E6 on 29 of the 32 trials. Subject LE1 had on average a 16% DR threshold elevation across masker and electrode conditions. The acoustic masker at 500 Hz elevated electric thresholds by the greatest amount, masking electrode E22, E11, and E6 over 40% DR. The most basal electrode E1 showed the least acoustic masking as tones at 125, 250, and 500 Hz did not elevate the average threshold.
Figure 4.
Acoustic masking patterns for subject LE1. The y axis (right side) marks the threshold elevation (% dynamic range). The y axis (left side) displays the range of current levels used for each electrode.
Figure 5 shows acoustic masking patterns along subject SE3’s short-array using electrodes E6, E5, E4, E3, E2, and E1 as electric probes. Acoustic masking tones at 125, 250, 500, 625, and 750 Hz elevated electric thresholds for electrodes E6, E5, E4, and E3 on every trial. Subject SE3 had on average a 15% DR threshold elevation across masker and electrode conditions. A one-way ANOVA showed no significant differences in the mean threshold elevations between subjects LE1 and SE3 [F(1, 48) = 0.107, p = 0.745]. The acoustic maskers at 125 and 250 Hz elevated electric thresholds by the greatest amount, masking electrode E6, E4, and E3 over 28% DR. The most basal electrodes E1 and E2 showed the least acoustic masking as tones at 125, 250, 500, 625, and 750 Hz elevated thresholds less than 10% DR.
Figure 5.
Acoustic masking patterns for the Iowa∕Nucleus hybrid subject SE3. The y axis (right side) marks the threshold elevation (% dynamic range). The y axis (left side) displays the range of current levels used for each electrode.
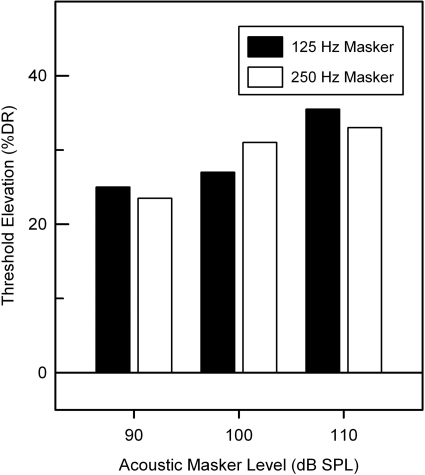
Figure 6 shows acoustic masking growth function for subject SE3. When the level of the 125-Hz masker was increased from 90, to 100, and 110 dB, the detection threshold of electrode E3 was increased by 25% to 27 and 35.5% DR, respectively. The 250-Hz masker produced a similar amount of masking with a 20-dB increase in the acoustic masker elevating the electric detection by 10.5% DR.
Figure 6.
Acoustic masking growth function (Increasing detection thresholds of probe electrode E3 as a function of masker level) for Iowa∕Nucleus hybrid subject SE3.
DISCUSSION
Electric masking
The electric masking data are consistent with the place-theory of auditory masking. For acoustic on acoustic signals, the greatest amount of masking occurs when the signal and probe are the same frequency, and masking decreases as the masker frequency moves away from the signal frequency. The results of the electric masking experiment show that only the most apical electrodes of the 24 mm array of subject LE1 masked acoustic probe tones at 500, 625, and 750 Hz. These electrodes were inserted deeply and stimulated regions on the basilar membrane nearby and adjacent to areas of preserved low frequency acoustic hearing. None of the electrodes on the array seemed to be inserted deep enough to mask the lowest acoustic frequencies (125 and 250 Hz). Similarly, no electric masking was seen in the five Iowa∕Nucleus hybrid subjects whose electrodes were only 4.75 to 10 mm apical to the round window membrane. The absence of stimulation rate effects and contralateral masking lends further support to the place-dependent theory for electric masking.
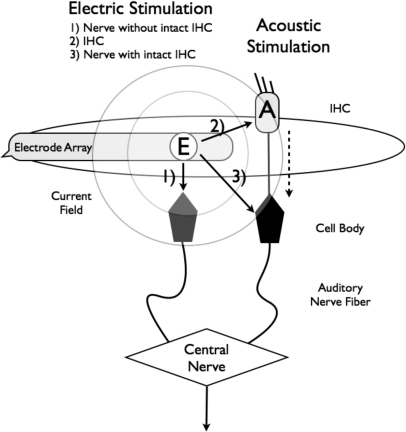
It is hypothesized that the observed ipsilateral electric masking originates from peripheral mechanisms at the auditory nerve response. Figure 7 illustrates schematically that electric stimulation not only activates nearby neurons without intact hair cells (labeled “1”) but also can interfere with acoustic signal transduction via direct stimulation of either the intact hair cell (2) or the attached nerve (3). It is well known that electrical stimulation produces highly synchronous activity across auditory nerve fibers (Kiang and Moxon, 1972), depolarizing the peripheral processes and spiral ganglion cells at high intensity levels (Van den Honert and Stypulkowski, 1984). The spread of current can also stimulate overlapping subsets of nerve fibers, leading to channel interactions (Shannon, 1983). Computational models have also shown that both the area and temporal pattern of neural responses are dependent on the distance of current flow from the stimulating electrode (Frijns et al., 1995; Mino et al., 2004). At present, it is not clear whether it is the reduced response or desynchronized response or both that contribute to the presently observed electric masking of acoustic signals.
Figure 7.
Schematic representation of acoustic and electric masking mechanisms in hybrid hearing.
Acoustic masking
The acoustic masking data are more consistent with the central theory of auditory masking. Acoustic stimulation from 125–750 Hz elevated detection thresholds for electrodes that were deeply and shallowly inserted. In addition, the amount of acoustic masking was independent of the acoustic masker frequency. Because the acoustic stimulation is confined to the functional hair cells and nerves (dashed line in Fig. 7), and there is no known mechanism that acoustic stimulation can directly activate a nerve fiber, the observed acoustic masking could only occur as a result of subsequent interaction at the next level (labeled as “central nerve” in Fig. 7). Similar place-independent masking patterns were prevalent in contralateral masking experiments involving bimodal and bilateral CI subjects when the probe and masker were presented in opposite ears (James et al., 2001; Van Hoessel and Clark, 1997). Contralateral masking in normal hearing is attributed to the overlap of neural responses further up in the auditory processing pathway (Zwislocki, 1972) or suppression by efferent neural activity (Oxenham et al., 1998). The acoustic-electric interactions could also be affected by the stochastic activity or spontaneous release of neurotransmitter by the functionally active hair cells (Rubinstein et al., 1999). Miller et al. (1998, 2000) directly measured the auditory nerve response to simultaneous electric and acoustic stimulation in animals with intact hair cells and found that acoustic noise reduces electrically evoked compound action potentials. Because functional hair cells are most likely lacking in the basal part of the cochlea in the present CI subjects, the observed acoustic masking is not due to the efferent and transmitter mechanisms but rather a result of the central interactions.
Implications
The results from both the present experiments suggest that electric and acoustic stimulations can interact in different ways to produce masking. The complex interactions between acoustic and electric stimulations may relate to both the large individual variability in EAS performance and the lack of correlation between hearing thresholds and EAS benefit (Gifford et al., 2007). It is noted that the observed acoustic-electric masking patterns are not completely compatible with the upward spread of masking seen in normal hearing where the amount of masking grows nonlinearly on the high-frequency side. Restoring some aspects of this asymmetric masking pattern in acoustic-electric stimulation may present opportunities to further improve the EAS benefit. On the other hand, clinicians may opt to reduce acoustic-electric masking effects while programming hearing aids and cochlear implants in order to enhance spectral resolution.
CONCLUSIONS
The present results from both long-electrode and short-electrode EAS subjects support the following conclusions.
-
(1)
Electric stimulation in the long-electrode subject can mask pure tones of 500–750 Hz over 10 dB, but cannot mask pure tones of 125–250 Hz.
-
(2)
Electric stimulation in the short-electrode subjects can hardly mask pure tones of 125–750 Hz (< 4 dB).
-
(3)
Varying electric stimulus parameters including stimulation rate and pulse duration did not significantly alter the amount of masking, suggesting a place-dependent masking mechanism.
-
(4)
Acoustic stimulation from 125–750 Hz elevated electric detection threshold the most at the middle and apical electrodes. The amount of acoustic masking was not correlated to the frequency of the maskers used, suggesting a central masking mechanism.
ACKNOWLEDGMENTS
We thank our cochlear implant subjects for their dedication and time. This project was supported in part by the National Institutes of Health, United States Department of Health and Human Services (Grant Nos. RO1 DC008858 and P30 DC008369 to UC Irvine and Grant Nos. R01 DC000377 and P50 DC00242 to University of Iowa).
References
- Chatterjee, M., and Shannon, R. V. (1998). “Forward masked excitation patterns in multielectrode electrical stimulation,” J. Acoust. Soc. Am. 105, 2565–2572. 10.1121/1.422777 [DOI] [PubMed] [Google Scholar]
- Delgutte, B. (1990). “Physiological mechanisms of psychophysical masking: Observations from auditory-nerve fibers,” J. Acoust. Soc. Am. 87, 791–809. 10.1121/1.398891 [DOI] [PubMed] [Google Scholar]
- Frijns, J. H. M., De Snoo, S. L., and Schoonhoven, R. (1995). “Potential distributions and neural excitation patterns in a rotationally symmetric model of the electrically stimulated cochlea,” Hear Res. 87, 170–186. 10.1016/0378-5955(95)00090-Q [DOI] [PubMed] [Google Scholar]
- Gantz, B. J., and Turner, C. (2004). “Combining acoustic and electric speech processing: Iowa/Nucleus hybrid implant,” Acta Otolaryngol. 124 (4), 344–347. 10.1080/00016480410016423 [DOI] [PubMed] [Google Scholar]
- Gantz, B. J., Turner, C., Gfeller, K. E., and Lowder, M. A. (2005). “Preservation of hearing in cochlear implant surgery: advantages of combined electrical and acoustical speech processing,” Laryngoscope 115, 796–802. 10.1097/01.MLG.0000157695.07536.D2 [DOI] [PubMed] [Google Scholar]
- Gfeller, K. E., Olszewski, C., Turner, C., Gantz, B., and Oleson, J. (2006). “Music perception with cochlear implants and residual hearing,” Audiol Neurotol. 11 (Suppl 1), 12–15. 10.1159/000095608 [DOI] [PubMed] [Google Scholar]
- Gifford, R. H., Dorman, M. F., Spahr, A. J., and Bacon, S. P. (2007). “Auditory function and speech understanding in listeners who qualify for EAS surgery,” Ear Hear. 28 (Suppl 2), 114S–118S. 10.1097/AUD.0b013e3180315455 [DOI] [PMC free article] [PubMed] [Google Scholar]
- James, C., Blamey, P., Shallop, J. K., Incerti, P. V., and Nicholas, A. M. (2001). “Contralateral masking in cochlear implant users with residual hearing in the non-implanted ear,” Audiol. Neuro-otol. 6, 87–97. 10.1159/000046814 [DOI] [PubMed] [Google Scholar]
- Kiang, N. Y. S., and Moxon, E. C. (1972). “Physiological considerations in artificial stimulation of the inner ear,” Ann. Otol. 81, 714. [DOI] [PubMed] [Google Scholar]
- Kong, Y. Y., Stickney, G. S., and Zeng, F. G. (2005). “Speech and melody recognition in binaurally combined acoustic and electric hearing,” J. Acoust. Soc. Am. 117 (3), 1351–1361. 10.1121/1.1857526 [DOI] [PubMed] [Google Scholar]
- Levitt, H. (1971). “Transformed up-down methods in psychoacoustics,” J. Acoust. Soc. Am. 49, 467–477. 10.1121/1.1912375 [DOI] [PubMed] [Google Scholar]
- Lim, H. H., Tong, Y. C., and Clark, G. M. (1989). “Forward masking patterns produced by intracochlear electrical stimulation of one and two electrode pairs in the human cochlea,” J. Acoust. Soc. Am. 86, 971–980. 10.1121/1.398732 [DOI] [PubMed] [Google Scholar]
- Miller, C. A., Abbas, P. J., Rubinstein, J. T., Robinson, B. K., Matsuoka, A. J., and Woodworth, G. (1998). “Electrically evoked compound action potentials of guinea pig and cat: responses to monopolar, monophasic stimulation,” Hear. Res. 119, 142–154. 10.1016/S0378-5955(98)00046-X [DOI] [PubMed] [Google Scholar]
- Miller, C. A., Abbas, P. J., Rubinstein, J. T., Runge-Samuelson, C., and Robinson, B. K. (2000). “Effects of remaining hair cells on cochlear implant function,” Fifth Quarterly Progress Report, Neural Prosthesis Program Contract No. N01-DC-9-2106 NIH.
- Mino, H., Rubinstein, J. T., Miller, C. A., and Abbas, P. J. (2004). “Effects of electrode-to-fiber distance on temporal neural response with electrical stimulation,” IEEE Trans. Biomed. Eng. 51, 13–20. 10.1109/TBME.2003.820383 [DOI] [PubMed] [Google Scholar]
- Oxenham, A. J., and Plack, C. J. (1998). “Suppression and the upward spread of masking,” J. Acoust. Soc. Am. 104 (6), 3500–3510. 10.1121/1.423933 [DOI] [PubMed] [Google Scholar]
- Patterson, R. D., and Moore, B. C. J. (1986). “Auditory filters and excitation patterns as representations of frequency resolution,” in Frequency Selectivity in Hearing, edited by B. C. J. Moore (Academic, London: ), pp. 123–177. [Google Scholar]
- Rubinstein, J. T., Wilson, B. S., Finley, C. C., and Abbas, P. J. (1999). “Pseudospontaneous activity: stochastic independence of auditory nerve fibers with electrical stimulation,” Hear. Res. 127, 108–118. 10.1016/S0378-5955(98)00185-3 [DOI] [PubMed] [Google Scholar]
- Schroeder, M. R., Atal, B. S., and Hall, J. L. (1979). “Optimizing digital speech coders by exploiting masking properties of the human ear,” J. Acoust. Soc. Am. 66, 1647–1652. 10.1121/1.383662 [DOI] [Google Scholar]
- Shannon, R. V. (1983). “Multichannel electrical stimulation of the auditory nerve in man. II. Channel interaction,” Hear Res. 12, 1–16. 10.1016/0378-5955(83)90115-6 [DOI] [PubMed] [Google Scholar]
- Turner, C. W., Gantz, B. J., Vidal, C., Behrens, A., Henry, B. A. (2004). “Speech recognition in noise for cochlear implant listeners: Benefits of residual acoustic hearing,” J. Acoust. Soc. Am. 115 (4), 1729–1735. 10.1121/1.1687425 [DOI] [PubMed] [Google Scholar]
- Van den Honert, C., and Stypulkowski, P. H. (1984). “Physiological properties of the electrically stimulated auditory nerve. II. Single fiber recordings,” Hearing Res. 14, 225–243. 10.1016/0378-5955(84)90052-2 [DOI] [PubMed] [Google Scholar]
- Van Hoesel, R. J. M., and Clark, G. M. (1997). “Psychophysical studies with two binaural cochlear implant subjects,” J. Acoust. Soc. Am. 102, 495–507. 10.1121/1.419611 [DOI] [PubMed] [Google Scholar]
- Von Ilberg, C., Keifer, J., Tillein, J., Pfenningdorff, T., Hartmann, R., Sturzebecher, E., and Klinke, R. (1999). “Electro-acoustic stimulation of the auditory system,” ORL 61, 334–340. 10.1159/000027695 [DOI] [PubMed] [Google Scholar]
- Wegel, R. L., and Lane, C. E. (1924). “The auditory masking of one pure tone by another and its probable relation to the dynamics of the inner ear,” Phys. Rev. 23, 266–285. 10.1103/PhysRev.23.266 [DOI] [Google Scholar]
- Zeng, F. G., Chen, H., and Han, S. (2005). “Temporal masking in electric hearing,” J. Assoc. Res. Otolaryngol. 6, 390–400. [DOI] [PMC free article] [PubMed] [Google Scholar]
- Zwislocki, J. J. (1972). “A theory of central auditory masking and its partial validation,” J. Acoust. Soc. Am. 52 (2B), 644–659. 10.1121/1.1913154 [DOI] [Google Scholar]


