

Abstract
Up-regulation of the dolichol pathway, a “hallmark” of asparagine-linked protein glycosylation, enhances angiogenesis in vitro. The dynamic relationship between these two processes is now evaluated with tunicamycin. Capillary endothelial cells treated with tunicamycin were growth inhibited and could not be reversed with exogenous VEGF165. Inhibition of angiogenesis is supported by down-regulation of (i) phosphorylated VEGFR1 and VEGFR2 receptors; (ii) VEGF165-specific phosphotyrosine kinase activity; and (iii) MatrigelTM invasion and chemotaxis. In vivo, tunicamycin prevented the vessel development in MatrigelTM implants in athymic Balb/c (nu/nu) mice. Immunohistochemical analysis of CD34 (p < 0.001) and CD144 (p < 0.001) exhibited reduced vascularization. A 3.8-fold increased expression of TSP-1, an endogenous angiogenesis inhibitor in MatrigelTM implants correlated with that in tunicamycin (32 h)-treated capillary endothelial cells. Intravenous injection of tunicamycin (0.5 mg/kg to 1.0 mg/kg) per week slowed down a double negative (MDA-MB-435) grade III breast adenocarcinoma growth by ∼50–60% in 3 weeks. Histopathological analysis of the paraffin sections indicated significant reduction in vessel size, the microvascular density and tumor mitotic index. Ki-67 and VEGF expression in tumor tissue were also reduced. A significant reduction of N-glycan expression in tumor microvessel was also observed. High expression of GRP-78 in CD144-positive cells supported unfolded protein response-mediated ER stress in tumor microvasculature. ∼65% reduction of a triple negative (MDA-MB-231) breast tumor xenograft in 1 week with tunicamycin (0.25 mg/kg) given orally and the absence of systemic and/or organ failure strongly supported tunicamycin's potential for a powerful glycotherapeutic treatment of breast cancer in the clinic.
Keywords: Anticancer Drug, Breast Cancer, Chemotaxis, ER Stress, Glycosylation Inhibitors, Angiogenesis, Gene Expression, VEGF, Unfolded Protein Response
Introduction
Breast cancer is becoming an important public health issue globally. The etiology of breast cancer is complex; this hyperproliferative disorder involves morphological and cellular transformation, dysregulation of apoptosis, uncontrolled cellular proliferation, invasion, metastasis, and angiogenesis (1–3). In malignant breast tissue, the intratumoral endothelial cell proliferation rate is higher than that of the surrounding breast (4). The central importance of angiogenesis and the current understanding of blood vessel formation have led to therapies to interrupt this process. Unfortunately, none of these therapies targeting different areas of vasculature cure breast cancer and, therefore, the need for the development of new therapeutics has emerged.
Asparagine-linked (N-linked) glycoproteins have been found to play an important role in angiogenesis (5–11). We have observed that proliferation of capillary endothelial cells as well as the capillary lumen formation is up-regulated when the cells are treated with 8Br-cAMP (9, 12, 13). Such treatment increases mannosylphospho dolichol synthase (DPMS) activity increasing the synthesis and turnover of Glc3Man9GlcNAc2-PP-Dol (lipid-linked oligosaccharide, LLO)2 and consequently the N-glycosylation of Factor VIIIC (eFVIIIc); enhancing angiogenesis (14). cDNA cloning of the Dpm1 gene identifies a cAMP-dependent protein kinase (PKA)-mediated phosphorylation motif in the capillary endothelial cell DPMS (15, GenBankTM GQ367549) as reported earlier for Dpm1 from yeast (16) and other organisms (17). Tunicamycin, a glucosamine-containing pyrimidine nucleoside (and an antibiotic) inhibits protein N-glycosylation by blocking LLO synthesis in the endoplasmic reticulum (ER; 18). Consequently, the glycoproteins are not folded and caused an accumulation of mis- or unfolded glycoproteins in the ER. This saturation of the ER folding capacity induces ER stress and activates ER-specific adaptive response, the unfolded protein response (upr; 19). The underlying mechanism of upr-induced ER stress could indirectly impede cell cycle progression by interfering with the proper maturation of growth factor receptors or other modulators of mitogenic signaling. Alternatively, ER stress may directly induce checkpoint response and prevent cells from completing their cell division cycle (20). Recently, we have observed that tunicamycin treatment causes cell cycle arrest in G1 and induces apoptosis of capillary endothelial cells while the cells are still in G1 (6). The present study demonstrates that tunicamycin (i) inhibits angiogenesis in vivo and reduces a double (ER−/PR−/EGFR+) and a triple-negative (ER−/PR−/EGFR−) breast tumor growth in nude mice; and (ii) the inhibition of angiogenesis is stable under tumor microenvironment as it is irreversible by exogenous VEGF165.
EXPERIMENTAL PROCEDURES
Materials
Hydroxyurea, dimethyl sulfoxide, nystatin, tunicamycin, and heparin were obtained from Sigma Aldrich. MatrigelTM, mouse monoclonal antibody for CD144, and actin were from BD-Bioscience (San Diego, CA). Mouse monoclonal antibody for VEGF, rabbit polyclonal phospho-VEGFR1, and goat polyclonal total VEGFR1 antibodies were from Oncogene (San Diego, CA). Recombinant VEGF165, rabbit polyclonal phospho-VEGFR2, and total VEGFR2 antibodies were from Calbiochem (EMD Biosciences; La Jolla, CA). Mouse monoclonal antibody for CD34 was from Cell Science (Canton, MA) and mouse monoclonal antibodies for Ki-67 and thrombospondin were from Abcam (San Francisco, CA). Rabbit polyclonal antibody for GRP-78 was from Santa Cruz Biotechnology (Santa Cruz, CA). WGA (Texas-Red conjugated) was from EY Laboratories (San Mateo, CA). HRP-conjugated goat anti-rabbit IgG/anti-mouse IgG, streptavidin, and ECL chemiluminescence detection kit were from GE Healthcare (Piscataway, NJ). TRIzol was from Invitrogen (Carlsbad, CA). PCR grade water and the DNA decontamination kit were from Applied Biosystems (Ambion Inc., Austin, TX), iScript c-DNA synthesis kit, biotinylated protein molecular weight markers, DNA markers, and all electrophoresis reagents were obtained from Bio-Rad. All other chemicals and solvents used were of the highest purity available. All cell culture wares were from Sarstedt (Newton, NC), and fetal bovine serum was purchased from HyClone Laboratories (Logan, UT).
Cell Line and Animals
Human breast carcinoma cells MDA-MB-231 and MDA-MB-435 were from the American Type Culture Collection (ATCC, Manassas, VA). The capillary endothelial cells were from the laboratory stock of a non-transformed endothelial cell line (21). Athymic Balb/c female (nu/nu) mice were from Charles River Laboratories (Wilmington, MA).
Culturing of Capillary Endothelial Cells and Proliferation Assay
The capillary endothelial cell stock was maintained as previously described (21, 22). For the proliferation assay, 1 × 10⁴ cells/ml/well were plated in triplicate in 24-well plates and synchronized (13) followed by culturing in EMEM containing 2% fetal bovine serum (heat inactivated) in the presence or absence of tunicamycin (1 μg/ml). Viable cells were counted every 24 h.
Analysis of Phosphotyrosine Kinase (PTK) Activity by Enzyme-linked Immunosorbent Assay (ELISA)
Protein tyrosine kinase activity (23) was measured in a Ray Bio® (RayBiotech; Norcross, GA) cell-based phosphotyrosine ELISA kit in synchronized cells treated with tunicamycin (1 μg/ml) for 3 h in triplicate following incubation with VEGF165 (10 ng/well) for 10 min prior to tunicamycin addition. CBO-II (50 μm), a VEGF receptor inhibitor was added 30 min prior to the addition of VEGF165.
SDS-PAGE and Western Blot Analyses
SDS-PAGE and Western Blot Analyses were performed as before (13) with 7.5% gel concentration.
Quantitative Real-time PCR (qRT-PCR)
(a) Isolation of RNA: total RNA was isolated in TRIzol, treated with DNase, and quantified in a NanoDrop Bioanalyzer. The integrity of RNA was verified by agarose gel electrophoresis followed by ethidium bromide staining. (b) qRT-PCR: total RNA (2 μg) was used to generate cDNA using the iScriptTM cDNA synthesis kit. qRT-PCR was performed in an iCycler (Bio-Rad) using iQTM SYBR® Green Supermix for the double-stranded DNA. After optimizing the PCR conditions, reactions with SYBR® Green PCR master mix, forward/reverse primers (10 μm), and cDNA (100 ng) were performed. PCR parameters used were 95 °C for 3 min (required for iTaqTM DNA polymerase activation), 40 cycles at 95 °C for 10 s, and 1 min at 50 °C (annealing). The PCR products were confirmed by agarose gel electrophoresis. The quantification of the target gene expression relative to the total DNA was carried out by melting curve analysis and calculated by ΔCt = Cthousekeeping − Cttarget gene. The changes in target gene expression in tunicamycin-treated cells compared with the control are reported as ΔΔCt = ΔCtcontrol − ΔCttunicamycin where the Cttarget and CtGAPDH are the fractional cycle number at which fluorescence generated by reporter dye exceeded the fixed level above baseline for target and housekeeping genes. The relative expression of the target gene in the control and tunicamycin-treated samples was calculated as 2ΔΔCt. Each sample was run three times.
The PCR primer pairs used were: mouse thrombospondin (forward): 5′-TGCGATGATGACGATGAC-3′; (reverse) 5′-CAGGGTTGTGGTTGTAGG-3′; mouse GAPDH (forward): 5′-GCCTTCCGTGTTCCTACC-3′; (reverse) 5′-TCTTGCTCAGTGTCCTTGC-3′; bovine thrombospondin (forward): 5′-GCCGATTCCAGATGATTC-3′; (reverse) 5′-CATAACCTACAGCAAGTCC-3′; and bovine GAPDH (forward): 5′-TGACCCCTTCATTGACCTTC-3′; (reverse) 5′-GATCTCGCTCCTGGAAGATG-3′.
MatrigelTM Invasion Assay and Chemotaxis
BD BioCoat MatrigelTM invasion chambers were used according to the manufacturer's instruction. The conditioned media from MCF7 cells containing 10% fetal bovine serum and VEGF165 (10 ng) were placed in lower chambers as a chemoattractant. Tunicamycin (1 μg/ml)-treated or untreated capillary endothelial cells (1 × 10⁵) in serum-free medium containing 0.1% bovine serum albumin were seeded in the upper chamber of the MatrigelTM-coated (growth factor-reduced) transwell. After incubating for 24 h at 37 °C in a CO2 incubator, non-migrating cells from the upper surface of the membrane were removed with a cotton swab. The cells invaded to the lower side of the membrane were fixed, stained with H&E, and quantified by counting in five fields under a Zeiss optical microscope (200×). The chemotaxis was performed as described before (24).
In Vivo MatrigelTM Plug Assay
MatrigelTM (0.5 ml) containing heparin (60 units/ml) (negative control), heparin plus VEGF165 (30 ng; positive control), or heparin plus VEGF165 plus tunicamycin (5 μg, experimental) per mice were injected subcutaneously (s.c.) into the flank of 8-week-old female Balb/c (nu/nu) mice. Five mice per group were used. All animal studies were approved by the Institutional Animal Care and Use Committee (IACUC).
Histological Staining
The mice were killed 10 days postimplantation. MatrigelTM plugs were removed, fixed in 10% neutral formalin, and embedded in paraffin. Breast tumor tissue from nude mice was also processed similarly. 5-μm sections were collected on glass slides, stained with H&E, and analyzed microscopically (Axioskop 2, Carl Zeiss, Germany).
Immunohistochemistry and Immunofluorescence Microscopy
For microsvessel counting, the MatrigelTM sections were stained immunohistochemically with anti-CD34 and anti-CD144 antibodies using the HistomouseTM Max kit (Zymed Laboratories Inc.). A similar protocol was used to detect Ki-67 and VEGF expression in breast tumor tissue sections. De-paraffinized sections were treated with 0.3% hydrogen peroxide (10 min) at room temperature, washed with PBS, pH 7.4 (3 × 3 min each), and blocked with solutions A and B for 30 min and 10 min, respectively. The sections were incubated at room temperature with anti-CD34, anti-CD144, anti-Ki-67, anti-VEGF, and anti-GRP-78 antibodies, respectively, in a moist chamber for 3 h. After rinsing with PBS, pH 7.4 (3 × 2 min each), the sections were incubated with 100 μl of HRP-conjugated rabbit anti-mouse IgG for 10 min at room temperature. The sections were rinsed three times with PBS, pH 7.4, and incubated with a mixture of chromogenic substrate (cold) for 15 min. After washing with distilled water, all sections were counterstained with hematoxylin before mounting and analysis. In some experiments, GRP-78 and CD144 were detected with fluorescently labeled secondary antibodies. N-Glycans were detected with Texas-Red-conjugated WGA.
Microvessel Counts (MVC)
MVC were analyzed using the hot spot area. H&E-stained sections as well as the sections immunostained with anti-CD34 and anti-CD144 antibodies were analyzed in 3 hot spots (i.e. the highest number of vessel areas under 200× magnification). Microscopic images from each area were collected (100×/0.25 ph1 A plan) in Axioskop 2 fitted with AxioCam MRc5 camera and Axion Vision Rel 4.6 software, and recorded as the MVC (25).
Development of Breast Tumor in Nude Mice
(a) Orthotopic model: 4 × 10⁶ MDA-MB-435 (a double negative) cells (25, 26) were mixed with 0.3 ml of MatrigelTM and injected into mammary fat pads of 6-week-old athymic Balb/c (nu/nu) female mice. One week later, mice bearing the tumor were divided into five groups (10 mice per group). Mice in the treatment group received tunicamycin intravenously (i.v.) at doses of 0, 0.1, 0.5, and 1.0 mg/kg per week, while the mice in the control group received i.v. injection of the vehicle only. Taxol (15 mg/kg) was used as an internal control. Tumor growth was monitored by caliper measurements of length and width for 23 days after initiating the treatment and the tumor volume was calculated. At the end, the mice were sacrificed, the excised tumor was weighed and fixed in formalin. Paraffin embedded and frozen tumor sections were analyzed histologically and immunohistochemically.
(b) Xenograft Model: 4 × 10⁶ MDA-MB-231 (a triple negative breast cancer) cells mixed with 0.3 ml of MatrigelTM and injected subcutaneously (s.c.) in the hind region of the mouse. One week later, the mice bearing tumor were divided into two groups. The mice in the treatment group received tunicamycin (5 μg/mouse ≈ 0.25 mg/kg) orally twice a week for 4 weeks, while the mice in the control group received the vehicle only. The tumor growth was monitored as above.
Quantification of Fluorescence Images of the Tumor Microvessels
Tumor tissue was immunostained with Texas-red-conjugated WGA and photographed at 200× magnification. The fluorescence intensity of each vessel was quantified by ImageJ version 1.39 (NIH). RGB composite images from control and tunicamycin-treated vessels were created using Axion Vision rel, 4.6 and analyzed. Vessels from five different areas were used for statistical analysis.
Statistical Analysis
Statistical analysis was carried out with Graph Pad Prism 4 software (Graph Pad Software Inc., San Diego, CA). Quantitative data are presented as mean plus S.E. The mean ± S.E. was calculated by one-way analysis of variance (ANOVA). Significance between groups was further analyzed using the post hoc Tukey's test.
RESULTS
Tunicamycin Inhibition of Capillary Endothelial Cell Proliferation Is Not Reversible by VEGF165
Tunicamycin (a potent protein N-glycosylation inhibitor) arrests capillary endothelial cells in G1 (21, 22). To evaluate the stability of the anti-angiogenic effect of tunicamycin in tumor microenvironment, a time course was set up where VEGF165-stimulated capillary endothelial cells were treated with tunicamycin (1 μg/ml) and monitored every 24 h for 144 h. Exogenous addition of VEGF165 stimulated the cell proliferation, but it failed to protect the cells from the growth inhibitory effect of tunicamycin (Fig. 1A). In the first 24 h of VEGF treatment, the inhibition of cell proliferation was less but from 48 h onwards VEGF did not show any protection (p < 0.001).
FIGURE 1.

Time course of tunicamycin inhibition of VEGF-stimulated capillary endothelial cell proliferation. A, synchronized culture of capillary endothelial cells was treated with VEGF165 (10 ng) in the presence or absence of tunicamycin (1 μg/ml), and cell numbers were counted microscopically. VEGF165 was added prior to the addition of tunicamycin. B, phosphotyrosine kinase activity in capillary endothelial cells. The experiment was performed per instructions from the manufacturer, and measurements were made in an automated microplate reader/EIA plate reader (Model 2550, Bio-Rad) at 450 nm. The synchronized cells were treated with tunicamycin (1 μg/ml) for 3 h and then treated with VEGF165 for 10 min. CBO-II was added 30 min prior to the addition of VEGF165. C, status of VEGFR1 and VEGFR2 receptors. Synchronized cells were incubated with tunicamycin for 3 h-32 h, and the levels of total VEGFR1, phospho-VEGFR1, total VEGFR2, and phospho-VEGFR2 receptors were analyzed by Western blot using anti-VEGFR1 total (1:2,000; v/v), anti-phospho-VEGFR1 (1:1,000; v/v), anti-VEGFR2 total (1:2,000; v/v), and anti-phospho-VEGFR2 (1:1,000; v/v) antibodies. Actin (1:5,000; v/v) was used as a loading control. D, quantification of VEGFR1 and VEGFR2 receptors: Densitometer scanning (arbitrary unit) of the Western blots was plotted against the time of treatment. The results are an average from three representative immunoblots for each experiment.
Tunicamycin Down-regulates Phosphotyrosine Kinase Activity in VEGF165-treated Capillary Endothelial Cells
VEGF signals through activation of tyrosine kinase (23, 25). We have tested the status of the VEGF-stimulated tyrosine kinase activity after treating the cells with tunicamycin. Cells stimulated with VEGF165 exhibited an increase in tyrosine kinase activity over the basal level. A marked reduction in the enzyme activity (p < 0.001) however, was observed in cells treated with tunicamycin for 3 h (Fig. 1B). To evaluate the specificity of VGF165-stimulated up-regulation of the tyrosine kinase activity, a 17 amino acid peptide, CBO-II (50 μm), which blocks the binding of VGF165 to its receptors, was used. Cells pretreated with CBO-II inhibited the tyrosine kinase activity following VEGF165 stimulation (p < 0.001) to an extent similar to that observed in tunicamycin-treated cells. No further reduction in VEGF165-stimulated activity was observed when tunicamycin-treated cells were preincubated with CBO-II (Fig. 1B). This suggested no changes in the receptor level, but alteration in its signaling ability.
Tunicamycin Down-regulates Phospho-VEGFR1 and Phospho-VEGFR2 Receptors
VEGF-induced changes are expected to be seen in cells expressing functional VEGF receptors (26). Endothelial cells express both VEGFR1 and VEGFR2 receptors although the VEGFR2 receptor has been claimed to be more effective in inducing angiogenesis. The status of total, phosphorylated VEGFR1 and VEGFR2 receptors and their ratios in capillary endothelial cells was therefore evaluated following tunicamycin (1 μg/ml) treatment. Total VEGFR1 expression was ∼97.2, ∼83.3, and ∼89.4% at 3, 12, and 32 h, respectively, over the synchronized cells, i.e. 0 h. These values for VEGFR2 were ∼110.3, ∼91.8, and ∼68.3%, respectively, for the same period. The level of phosphorylated VEGFR1 when analyzed was down-regulated by ∼30.5, ∼33.5, and ∼75.7% in cells treated with tunicamycin for 3, 12, and 32 h, respectively compared with their respective controls. The phosphorylated VEGFR2 was down-regulated by ∼44.4%, and ∼72.6% in cells treated with tunicamycin for 3 and 32 h, respectively but increased by ∼3.3% in cells treated with tunicamycin for 12 h (Fig. 1, C and D) compared with their controls. Interestingly, the reduction of phosphorylated VEGFR1 (i.e. ∼30.5%) and VEGFR2 (i.e. ∼44.4%) is serendipitously very similar to ∼46.6% reduction of protein tyrosine kinase activity following VEGF stimulation in cells treated with tunicamycin for 3 h. There was also a 1.6–2.4-fold reduction of phosphorylated VEGFR1 and VEGFR2 in cells treated with tunicamycin for 32 h over that of 3 h. On the other hand, there was a 2.7–2.9-fold difference between the ratio of down-regulated phosphor-VEGF receptors (i.e. VEGFR1 and VEGFR2) and the total VEGFR 1 and VEGFR2 at 3 and 32 h of tunicamycin treatment (Table 1).
TABLE 1.
Ratio of Phospho-VEGFRs to Total VEGFRs
The ratios are calculated from the values in Fig. 1D. The results are expressed as mean ± S.E.
| Ratio | Samples |
|||||
|---|---|---|---|---|---|---|
| Con-3h | TM-3h | Con-12h | TM-12h | Con-32h | TM-32h | |
| Phospho-VEGFR1/Total VEGFR1 | 0.96 ± 0.09 | 0.72 ± 0.04 | 0.85 ± 0.09 | 0.53 ± 0.06 | 0.59 ± 0.06 | 0.15 ± 0.01 |
| Phospho-VEGFR2/Total VEGFR2 | 0.49 ± 0.02 | 0.36 ± 0.07 | 0.80 ± 0.06 | 0.88 ± 0.06 | 0.99 ± 0.13 | 0.26 ± 0.01 |
Tunicamycin Inhibits Angiogenesis in Vivo
To study the anti-angiogenic effect of tunicamycin in vivo, we have used the MatrigelTM plug assay in nude mice. Angiogenesis was induced by injecting MatrigelTM containing VEGF165. Intense vascularization was observed 10 days post-implantation in MatrigelTM plugs containing VEGF165. In contrast, the plugs with MatrigelTM alone appeared pale. Tunicamycin inhibited neo-vascularization, and the plugs appeared pale as well even when VEGF165 was present (Fig. 2A, right). Histological analysis of H&E-stained paraffin sections also supported an increased number of vessels in the plugs containing VEGF165, as opposed to the plugs with MatrigelTM alone. Tunicamycin treatment caused considerable reduction of neo-vascularization in the plugs containing VEGF165 (Fig. 2B). Quantitative analysis supported ∼75% reduction in the vessel density in tunicamycin-treated MatrigelTM plugs (Fig. 2B far right; p < 0.001).
FIGURE 2.

Tunicamycin inhibition of VEGF-induced angiogenesis and CD34 and CD144 expression in MatrigelTM implants. A, representative images of MatrigelTM plugs containing heparin (left), heparin + VEGF165 (middle), and heparin + VEGF165 + Tunicamycin (5 μg) (right). B, H&E staining of MatrigelTM implants (100×). Microvessels are identified with arrows. Magnified views (200×) are in insets. Histograms represent microvessels per fields (mean ± S.E. (n = 5); p < 0.001). C, immunohistochemistry of CD34 of MatrigelTM sections (100×). The histograms are for CD34-positive cells (mean ± S.E.) per field. D, photomicrographs of immunostained CD144 from MatrigelTM sections (100×). The histograms are for CD144-positive cells (mean ± S.E.). The numbers in each case are an average from five different slides and five regions per slide; p < 0.001.
Decreased CD34 and CD144 Expression in Tunicamycin-treated MatrigelTM Plugs
Microvessel density is a vital prognostic biomarker correlating the growth and development of breast cancer (27) and is often used to evaluate tumor growth (28). To assess the tunicamycin-mediated inhibition of vessel formation in MatrigelTM plugs, the microvessel density in the plugs was examined immunohistochemically after staining for CD34 and CD144. Microscopic examination revealed numerous CD34- and CD144-stained vessels in the positive control group (VEGF165 + heparin) (Fig. 2, C and D, middle), but only a few vessels in the group treated with tunicamycin (Fig. 2C, right and Fig. 2D, right). 87 ± 4.04 vessels stained for CD34 and 78 ± 3.4 vessels for CD144 in the positive control group as opposed to only 12 ± 1.2 vessels in CD34 or 8 ± 1.5 vessels in CD144 in the group treated with tunicamycin, respectively. Quantification (Fig. 2, C and D, far right) indicates ∼87.5% decrease (p < 0.001) in microvessel density because of tunicamycin treatment.
Increased Expression of Thrombospondin-1 Gene in Tunicamycin-treated MatrigelTM Plugs
Angiogenesis is a balance between the expression of pro- and anti-angiogenic molecules (29). Thrombospondin-1 (Tsp-1) is an endogenous inhibitor of angiogenesis (30). To get an insight into the tunicamycin-induced inhibition of neo-vascularization in MatrigelTM plugs, Tsp-1 gene expression was monitored in the plugs. qRT-PCR analysis reveals ∼3.8-fold (p < 0.001) up-regulation of Tsp-1 gene expression (Fig. 3A). Up-regulation of TSP-1 mRNA as well as protein was also observed in capillary endothelial cells treated with tunicamycin for 32 h (Fig. 3, B and C).
FIGURE 3.

Thrombospondin-1 expression in MatrigelTM implants and in capillary endothelial cells. A, quantification of TSP-1 mRNA expression in MatrigelTM. B, quantification of TSP-1 mRNA expression in capillary endothelial cells after 3 h and 32 h of tunicamycin treatment. C left, TSP-1 protein expression in capillary endothelial cell was examined by immunoblotting (40 μg of total protein) from control and tunicamycin-treated cells (3 h and 32 h). The blot was developed with an anti-TSP-1 antibody (1:1,000; v/v) and anti-actin. C, right, histogram representing quantification of the TSP-1 protein expression as measured by Chem Doc Densitometry (Bio-Rad). The results are an average from three blots done independently.
Tunicamycin Inhibits Breast Tumor Growth in Athymic Nude Mice
In vitro cell culture and in vivo MatrigelTM implant models raised the question of whether tunicamycin could treat breast tumors. To answer, we took the following approaches: (i) orthotopic breast tumor in nude mice were developed with MDA-MB-435 (ER−/PR−/EGFR+) cells and treated with tunicamycin by intravenous injection (group a; Fig. 4A); and (ii) breast tumor xenografts in nude mice were developed with MDA-MB-231 (ER−/PR−/EGFR−) cells and treated orally with tunicamycin (group b; Fig. 5A). In group a, tunicamycin treatment was started after the tumor size reached ∼3 mm in diameter in 6 days at doses of 0.1, 0.5, and 1.0 mg/kg, respectively, once a week. The results (Fig. 4A) indicated that tumor growth progressed in untreated controls and also in the group treated with a low dose of tunicamycin (i.e. 0.1 mg/kg). However, it was markedly reduced (∼56% in 23 days) when treated with 1.0 mg/kg of tunicamycin. Tumor volume regressed ∼17% at 0.5 mg/kg of tunicamycin. It is important to note that 15 times more taxol was needed to match the effect of 1 mg/kg of tunicamycin. The histogram in Fig. 4A (far right) recorded the tumor weight after each treatment and at the end of the treatment period. H&E staining of paraffin sections of the tumor tissue indicated reduced microvascular density as the tunicamycin concentrations were increased from zero to 1 mg/kg (Fig. 4, B and C). Fig. 4C (far right) recorded the mitotic index of tumor cells per 10 high power field (HPF) and explained that the mitotic index of the tumor cells declined as a consequence of tunicamycin treatment (p < 0.001). In group b, tunicamycin treatment was started 7 days after the tumor development and was given orally twice a week at a dose of 5 μg/mouse (≈0.25 mg/kg). In the control group (Fig. 5A, top row), the tumor growth was almost doubled in 4 weeks, whereas the growth in the treatment group was reduced by ∼65% in 1 week and maintained (Fig. 5, A, bottom row and B).
FIGURE 4.

Tunicamycin slows down the growth of a double negative breast adenocarcinoma. The breast tumor was developed orthotopically in athymic nude mice after injecting MDA-MB-435 (ER−/PR−/EGFR+) human breast cancer cells and monitored by caliper measurements. The mice were treated intravenously once a week with tunicamycin (0–1.0 mg/kg). A, left, tumor growth as a function of time and tunicamycin treatment. A, right, weight of the excised tumor after 23 days. B, H&E-stained tumor sections identifying the microvascular density in control and following tunicamycin treatment. Arrows indicate microvessels. C, H&E staining identifies the mitotic index (arrowheads) in control and tunicamycin-treated breast tumor section. The histogram on the right represents the quantitative results of mitotic index averaged from ten representative areas of each tumor. The results are expressed as mean ± S.E.; p < 0.001. D, immunohistochemistry of Ki-67 and VEGF expression in breast tumor tissue sections (400×).
FIGURE 5.

Tunicamycin inhibits the growth of a triple negative breast tumor. The xenografts were developed in athymic nude mice after injecting MDA-MB-231 (ER−/PR−/EGFR−) human breast cancer cells and treated with tunicamycin (0.25 mg/kg) orally twice a week. A, tumor size in a control xenograft (untreated) and after tunicamycin treatment (TM-treated); B, tumor volume (mm3) as a function of time. ◆---◆, control; ■---■, tunicamycin.
Decreased Ki-67 and VEGF Expression in Breast Tumor after Tunicamycin Treatment
To correlate the tumor growth with the cellular markers, expression of Ki-67 and VEGF was analyzed in tumor tissue immunohistochemically. Ki-67 is a cellular proliferation marker and VEGF is pro-angiogenic. The tumor we have examined here was a grade III adenocarcinoma, and Ki-67 or VEGF expression in tumors from tunicamycin-treated group of mice (1.0 mg/kg) was reduced significantly (Fig. 4, D and E). This paralleled the reduction of microvessel count and the mitotic index (Fig. 4, B and C), respectively. Accumulating evidence thus supports that tunicamycin is anti-angiogenic and treats breast tumor in nude mice.
Decreased Invasion and Chemotaxis of Tunicamycin-treated Capillary Endothelial Cells
Capillary proliferation and tissue invasion are important for breast tumor progression. We have studied the MatrigelTM invasion of capillary endothelial cells as well as their chemotactic activity in the presence or absence of tunicamycin. Invasion through the transwell membrane in control plate (Fig. 6A) remained almost the same, whereas those migrated through the MatrigelTM reduced significantly in the presence of tunicamycin (Fig. 6B, far right; p < 0.001). This supported that tunicamycin makes capillaries less capable of invading the extracellular matrix. In addition to measuring the invasion character, the cells were also tested for their chemotaxis, i.e. the migratory activity on a wounded surface. The rate of migration was ∼75% higher in the presence of VEGF165. In the presence of tunicamycin, it was only ∼60% of the control and was further reduced (i.e. ∼25%) when both tunicamycin and VEGF165 were present (Fig. 6C, far right; p < 0.001).
FIGURE 6.

Inhibition of MatrigelTM invasion and chemotaxis of capillary endothelial cells after tunicamycin treatment. A, synchronized culture of capillary endothelial cells either alone or after pretreating with tunicamycin (1 μg/ml) for 32 h were seeded in control and growth factor-reduced MatrigelTM-coated transwell plates. B, cells were cultured in EMEM containing 2% fetal bovine serum in the upper chamber. Conditioned media from human breast cancer cells MCF-7 cultured in 10% fetal bovine serum along with VEGF (10 ng/ml) was used in the lower chamber as a chemo-attractant. After incubation for 24 h at 37 °C in a CO2 incubator, the transwells were removed, cells passed through the membrane were fixed and stained with H&E. The invaded cells were quantified by counting in an optical microscope at 200× magnification and averaged after counting five fields per membrane. The histogram at the right is the quantification of cell invasion through MatrigelTM (p < 0.001). C, image of chemotaxis of endothelial cells. Endothelial cells grown to confluence in a regular media containing 10% fetal bovine serum and switched to a media containing 0.2% fetal bovine serum for 6 h. The monolayers were scratched with a 10 μl pipette tip and cultured with or without VEGF (10 ng/ml), or tunicamycin (1 μg/ml), or tunicamycin (1 μg/ml) + VEGF165 (10 ng/ml) for an additional 6 h. The migrated cells were quantified microscopically and the histogram at the right is the quantification of cell migration (averaging the position of the migrating cells at the wounding edges; p < 0.001); broken line indicated by →.
Surface Expression of N-glycans on Tumor Microvasculature
Tunicamycin inhibits LLO biosynthesis and consequently the glycosylation of N-linked glycoproteins. To verify the status of the N-glycans on the breast tumor microvascular endothelial cell surface, the tissue sections were stained with Texas-Red-conjugated WGA and examined under a fluorescence microscope. Tumor microvessels in untreated controls were stained markedly but the staining intensity per vessel was reduced almost 50% upon treating with tunicamycin (Fig. 7A). This was further confirmed by quantifying these images with NIH-IMAGE J program (Fig. 8). Tumor cells from untreated control (Fig. 7B) exhibited positive WGA staining but the intensity was much less than the endothelial cells. Tunicamycin treatment caused a morphological change on the tumor cells, and the WGA staining was not only reduced but also appeared amorphous.
FIGURE 7.

Expression of cell surface glycans and induction of unfolded protein response-mediated ER stress in breast tumor microvasculature. A, WGA staining for N-glycans in microvessels from control and tunicamycin (0–1.0 mg/kg)-treated breast tumor tissue sections. Images were captured under a fluorescence microscope. B, WGA staining of tumor cells. Detection of upr-mediated ER stress in tumor microvasculature. Tumors were fixed, sectioned and stained dually with anti-CD144 (endothelial cell marker) antibody (1:50; v/v) followed by AlexaFluor 488-conjugated secondary antibody (1:100; v/v), and anti-GRP-78 antibody (1:40; v/v) followed by Rhodamin-conjugated secondary antibody (1:100; v/v). C, microvessel (arrows) from peripheral region of breast tissue section immunostained with anti-CD144 antibody (green), and D, microvessel immunostained with anti-GRP-78 antibody (red) were monitored under a fluorescence microscope. E, GRP-78 (red) staining of tumor tissue. Histology scale: 20 μm.
FIGURE 8.
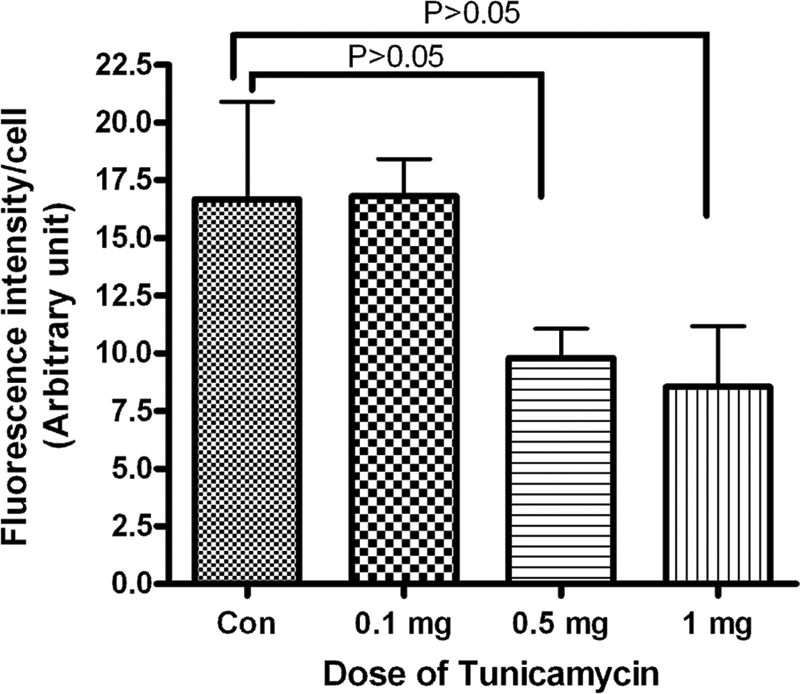
Quantification of WGA staining of breast tumor microvasculature. Tumor tissue was stained with Texas-red conjugated WGA as described under “Experimental Procedures.” The fluorescence intensity of microvessels was quantified with the ImageJ program. Results are an average of vessels from five different areas in each group.
Development of Unfolded Protein Response in Tumor Microvasculature during Tunicamycin Treatment
Inhibition of N-glycan biosynthesis with tunicamycin develops upr mediated by ER stress (19). This has led us to investigate whether ER stress-mediated upr exists in breast tumor microvasculature of the mice receiving tunicamycin treatment. Tumor tissue is heterogeneous. To answer this question, the tumor microvascular endothelial cells were first identified by staining for CD144 (green fluorescence; a marker for endothelial cells) and then stained for the GRP-78 (red fluorescence), an ER chaperone. In untreated control, CD144-stained endothelium appears as a thin line around the vessel as did the GRP-78 (Fig. 7, C and D). As the tumors were treated with tunicamycin, a high level expression of GRP-78 was observed in microvascular endothelial cells of the tumor (Fig. 7D). CD144 also stained the same area (Fig. 7C). Both green and red fluorescence of CD144 and GRP-78 co-localized in tumor microvasculature supporting unfolded protein response mediated by ER stress in tumor microvasculature. GRP-78 staining in tumor cells following tunicamycin treatment appears to be increased (Fig. 7E). This may be an indirect effect because of nutritional deprivation due to reduced blood flow in the tumor and not necessarily due to an induction of upr.
DISCUSSION
Deaths from breast cancer have dropped more than 2% since 1990, but it still is the second largest killer of women after heart disease. Approximately 15% of diagnosed breast cancers are also triple negative, have no treatment, and obviously, no cure. Tumors can stay dormant for many years due to a balance between cell proliferation and apoptosis in the absence of angiogenesis. In such condition, there is also a balance between pro-angiogenic and anti-angiogenic factors (31, 32). Dormant tumors secrete inhibitory factors that prevent the tumor from switching to the angiogenic phenotype and arrest the growth of tumors. The quantification of tumor angiogenesis, i.e. microvascular count (MVC) is a measure of tumor staging for growth, invasive, and metastatic potential as well as for diagnosis (28, 33). Many preclinical studies have suggested that the anti-angiogenic strategy could be a promising approach for cancer control because it is less likely to acquire drug resistance (34).
Anti-angiogenic agents conceptually categorized as: endothelial toxin (35), growth factor receptor antagonists (36), protease inhibitors (37, 38), and normal inhibitors (39). In addition, several chemotherapeutic agents routinely employed in breast cancer treatment have true anti-angiogenic activity (40). Unfortunately, none of these and others targeting different areas of vasculature cure breast cancer, all have serious side effects, and are detrimental to patients' quality of life.
The study we have presented here with tunicamycin as a model offers a possibility for developing a new drug regimen for treating breast cancer that includes a triple negative. The outcome is from a central hypothesis that tunicamycin inhibits angiogenesis (both in vitro and in vivo) and builds on the confidence that inhibition of capillary endothelial cell proliferation was caused by arresting cells in G1 (22).
To establish and evaluate the survivability of tunicamycin in the tumor microenvironment, the effect of tunicamycin in the presence of VEGF165 was studied. Tumor-derived VEGF is a most important angiogenic factor associated closely with the induction and maintenance of the neo-vasculature in human tumors (41). The results in Fig. 1A demonstrate that VEGF165 tries to protect the cells from tunicamycin initially, and the reduction of cellular proliferation during the first 24 h was modest when tunicamycin was present together with VEGF rather than alone. The inhibition of cellular proliferation, however, was comparable from 48 h to 144 h whether tunicamycin was present alone or in combination with VEGF165. The cells in the control continued to respond to VEGF165 stimulation and exhibited higher rates of proliferation until 120 h and before reaching a plateau at 144 h. This may be due to (i) the exhaustion of VEGF165, and/or (ii) desensitization of the VEGF receptors. Nevertheless, it clearly demonstrates that VEGF165 is unable to override the anti-angiogenic action of tunicamycin. Mechanistic details indicate that phosphorylation of VEGFR1 and VEGFR2 started down-regulating as early as 3 h of tunicamycin treatment but increased at 32 h (Fig. 1D). The behavior of phospho-VEGFR2 in cells treated with tunicamycin for 12 h is not sustainable and may indicate the cells are fighting back to stay alive under the experimental condition. This could be addressed in the future while studying cellular survival. Because VEGF signals through tyrosine phosphorylation, the tyrosine kinase activity was measured in cells treated with tunicamycin and stimulated with VEGF165. The VEGF-stimulated phosphotyrosine kinase activity in tunicamycin-treated cells was reduced significantly (i.e. ∼46.6%, p < 0.001; Fig. 1B) which is analogous to the reduction of phosphorylated VEGFR1 and VEGFR2 levels (i.e. ∼30.5 and ∼44.4%), respectively. There is a 1.6–2.4-fold reduction of VEGFR1 and VEGFR2 phopshorylation in cells treated with tunicamycin for 32 h over 3 h. However, a difference of 2.7–2.9-fold has been observed in the ratio of phosphorylated VEGFR1 and VEGFR2 to total VEGFR1 and VEGFR2 between cells treated with tunicamycin for 3 h and 32 h (Table 1). It would have been ideal if the cells would have maintained a steady level of total VEGFR1 and VEGFR2 receptors throughout. The apparent changes are believed to be physiological and did not alter our conclusion. In fact, irrespective of the levels of total VEGFR1 and VEGFR2, the levels of phosphorylated VEGFR1 and VEGFR2 are reduced when the cells were treated with tunicamycin for either 3 h or 32 h compared with the untreated control; thus, strongly supporting that down-regulation of phosphorylated VEGFR1 and VEGFR2 in tunicamycin-treated cells is primarily due to a reduced phosphotyrosine kinase activity in these cells. We anticipate that phosphorylated VEGFR1 and VEGFR2 would be much higher in VEGF-stimulated cells. Our primary reason not to use the VEGF-stimulated cells is that we have observed upr-mediated apoptosis in tunicamycin-treated cells in the absence of VEGF. The kinase activity was VEGF-specific because no additive or synergistic reduction was observed in the presence of the VEGF-receptor antagonist, CBO-II. Higher basal levels of phosphotyrosine kinase activity may be due to the presence of VEGF-like molecule in the serum because the cells were cultured in the presence of fetal bovine serum or due to an endogenous VEGF acting in a paracrine fashion.3 Any unparallel changes in VEGFR1 and VEGFR2 observed here may be due to the fact that activation and signaling of the VEGFR2 receptor may be positively or negatively influenced by the co-expression and activation of VEGFR1 receptor as proposed earlier (42). However, it has not been verified independently in this study.
When tested, tunicamycin reduced microvessel density by ∼75% (Fig. 2B) as well as the expression of CD34 and CD144 in MatrigelTM plugs in athymic mice (Fig. 2, C and D). TSP-1 is a known natural inhibitor of angiogenesis, and its down-regulation plays a critical role in the angiogenic switch in several tumor types (30). In this study, high expression of Tsp-1 gene in MatrigelTM plugs correlated with the TSP-1 protein and gene expression in tunicamycin-treated capillary endothelial cells (Fig. 3). The anti-angiogenic effect of TSP-1 has been proposed to mediate in part by the CD36 (TSP-1) receptor, which triggers a signaling cascade that leads to apoptosis in activated endothelial cells via the CD95 (Fas ligand) death receptor. There are no Fas ligand receptors detected in our capillary endothelial cell model.3 Up-regulation of TSP-1 expression in tunicamycin-treated capillary endothelial cells as well as in MatrigelTM implants supports inhibition of angiogenesis, but the mechanism through which TSP-1 is exerting its anti-angiogenic effect in our system is currently unknown and warrants future studies to delineate the molecular details. Based on the above in vitro and in vivo studies, tunicamycin was used as a therapeutic for treating a double negative (ER−/PR−/EGFR+) and a triple negative (ER−/PR−/EGFR−) breast tumor in nude mice. These results are shown in Figs. 4 and 5. The tumor volume was reduced ∼55–65% in 1–3 weeks irrespective of the tumor type or the mode of administration of the therapeutic. Taxol was used as an internal control, and to see an effect similar to that of tunicamycin (i.e. 1.0 mg/kg) 15 times more taxol was needed. The reduction of tumor growth correlated well with reduced Ki-67 and VEGF expression, microvascular density, and decreased mitotic index of the tumor cells in paraffin sections (Fig. 4). Most importantly, the animals showed no sign of abnormal behavior. There was no weight loss, and the animals exhibited normal intake of food and water.
The origin of the MDA-MB-435 cell line has been questioned by comparative genomic hybridization studies and claimed that both MDA-MB-435 and M14 melanoma are identical lines (43). However, as reviewed (44), both cell lines are of breast cancer origin rather than of melanoma origin because of the following rationale. The MDA-MB-435 cell line was isolated from a pleural effusion of a female patient with breast cancer and still has two X chromosomes; express milk proteins and lipids; and when transfected with the mm23 metastasis suppressor gene, MDA-MB-435 cells show the morphologic feature of normal breast epithelial cells, including acinus formation in three-dimensional culture.
Apart from the loss in cellular proliferation and induction of cell death due to apoptosis, tunicamycin blocked cellular invasion through MatrigelTM as well as their chemotactic activity (Fig. 6, B and C). Cumulatively, these processes are required for active angiogenesis during tumor progression, invasion, and metastasis. We have taken an approach here that develops ER stress in the tumor microvasculature mediated by unfolded protein response. It has been a challenge to image such a process because the tumor is highly heterogeneous. Identifying the microvascular endothelial cells by staining for CD144 followed by imaging the expression of GRP-78 turned out to be an excellent tool. Using the dual imaging technique our study has convincingly and unequivocally supported that tunicamycin reduces the breast tumor growth by triggering the unfolded protein response in the tumor microvasculature (Fig. 7, C and D). The microvessels from the treated groups are thin and smaller. In addition, quantification of WGA fluorescence intensity by IMAGE J program indicates that the expression of WGA-positive glycans per vessel was reduced as the dose of tunicamycin was increased (Figs. 7A and 8). Tumor epithelial cells also react to WGA staining, giving a distinct structural appearance in untreated control, but both the staining intensity and the structural integrity seemed to be collapsing with morphological changes as the tunicamycin dose was increased (Fig. 7B). Increased GRP-78 staining of tumor cells in tunicamycin-treated tissue (Fig. 7E) may indicate the presence of an ER stress developed indirectly as a result of nutritional deprivation because of reduced blood flow and not necessarily due to the induction of upr. This is also supported by an earlier report claiming that tunicamycin does not induce ER stress or develop upr in tumor cells (45). It is obviously impossible to settle this question in paraffin sections of breast tumor tissue and needs to be addressed with breast cancer cells in culture in the future.
In view of these results we conclude that (i) anti-angiogenic action of tunicamycin survives in tumor microenvironment; (ii) tumor associated high-density neo-vascularization responsible for the development of tumor growth is blocked by tunicamycin through a distinct mechanism of unfolded protein response mediated by ER stress: and (iii) tunicamycin itself could develop into a new generation anti-angiogenic therapeutic treating breast cancer in the clinic. Down-regulation of protein tyrosine kinase activity as well as reduced phosphorylated VEGFR1 and VEGFR2 receptors levels as early as 3 h of tunicamycin treatment supports the initiation of the apoptotic process. Furthermore, strengthening of apoptosis through a 1.6–2.4-fold down-regulation of phosphoVEGFR1 and VEGFR2 receptors in 32 h over that of 3 h, and/or a 2.7–2.9-fold difference (i.e. down-regulation) in the ratio of phosphorylated VEGFR1 and VEGFR2 to that of the total receptors between 3 h and 32 h of tunicamycin treatment may indicate that recruiting other downstream pathways remains a strong possibility.
Acknowledgments
We thank María Marcos, M.D. and María Almira, M.D. for pathological consultation, Laura M Bretana for editorial assistance, and Meriandrys Miller Burgos, Frances Candelas, and Weiya Xia for technical help.
This work was supported, in whole or in part, by Grant U54-CA096297 from the National Institutes of Health (NIH) and Susan G. Komen for the Cure BCTR0600582 (to D. K. B.), a VA Merit Grant (to S. K. B.), and NIH/NCRR/RCMI Grant G12-RR03035 (to K. B.).
D. K. Banerjee, unpublished observation.
- LLO
- lipid-linked oligosaccharide
- TSP-1
- thrombospondin-1
- PKA
- cAMP-dependent protein kinase
- ER
- endoplasmic reticulum
- UPR
- unfolded protein response
- VEGFR
- vascular endothelial growth factor receptor
- ELISA
- enzyme-linked immunosorbent assay
- WGA
- wheat germ agglutinin
- GRP-78
- glucose-responsive protein
- HRP
- horseradish peroxidase
- qRT-PCR
- quantitative real time PCR
- GAPDH
- glyceraldehyde-3-phosphate dehydrogenase
- ANOVA
- analysis of variance
- H&E
- hematoxylin and eosin.
REFERENCES
- 1. Schneider B. P., Miller K. D. (2005) J. Clin. Oncol. 23, 1782–1790 [DOI] [PubMed] [Google Scholar]
- 2. Hanahan D., Weinberg R. A. (2000) Cell 100, 57–70 [DOI] [PubMed] [Google Scholar]
- 3. Folkman J. (1994) J. Clin. Oncol. 12, 441–443 [DOI] [PubMed] [Google Scholar]
- 4. Vartanian R. K., Weidner N. (1994) Am. J. Pathol. 144, 1188–1194 [PMC free article] [PubMed] [Google Scholar]
- 5. Banerjee D. K., Vendrell-Ramos M. (1993) Ind. J. Biochem. Biophys. 30, 389–394 [PubMed] [Google Scholar]
- 6. Banerjee D. K., Martinez J. A., Baksi K. (2008) in Angiogenesis: Basic Science and Clinical Applications (Maragoudakis M. E., Papadimitriou E. eds) pp. 287–308, Transworld Research Network, Trivandrum, Kerala, India [Google Scholar]
- 7. Nguyen M., Folkman J., Bischoff J. (1992) J. Biol. Chem. 267, 26157–26165 [PubMed] [Google Scholar]
- 8. Nguyen M., Strubel N. A., Bischoff J. (1993) Nature 365, 267–269 [DOI] [PubMed] [Google Scholar]
- 9. Oliveira C. M., Banerjee D. K. (1990) J. Cell Physiol. 144, 467–472 [DOI] [PubMed] [Google Scholar]
- 10. Pili R., Chang J., Partis R. A., Mueller R. A., Chrest F. J., Passaniti A. (1995) Cancer Res. 55, 2920–2926 [PubMed] [Google Scholar]
- 11. Tiganis T., Leaver D. D., Ham K., Friedhuber A., Stewart P., Dziadek M. (1992) Expt. Cell Res. 198, 191–200 [DOI] [PubMed] [Google Scholar]
- 12. Das S. K., Mukherjee S., Banerjee D. K. (1994) Mol. Cell Biochem. 140, 49–54 [DOI] [PubMed] [Google Scholar]
- 13. Martínez J. A., Tavárez J. J., Oliveira C. M., Banerjee D. K. (2006) Glycoconj. J. 23, 209–220 [DOI] [PubMed] [Google Scholar]
- 14. Banerjee D. K., Oliveira C. M., Tavárez J. J., Katiyar V. N., Saha S., Martínez J. A., Banerjee A., Sánchez A., Baksi K. (2011) Adv. Exp. Med. Biol. 705, 453–464 [DOI] [PMC free article] [PubMed] [Google Scholar]
- 15. Baksi K., Tavárez-Pagán J. J., Martinez J. A., Banerjee D. K. (2008) Curr. Drug Targets 9, 262–271 [DOI] [PubMed] [Google Scholar]
- 16. Orlean P., Albright C., Robbins P. W. (1988) J. Biol. Chem. 263, 17499–17507 [PubMed] [Google Scholar]
- 17. Banerjee D. K., Carrasquillo E. A., Hughey P., Schutzbach J. S., Martínez J. A., Baksi K. (2005) J. Biol. Chem. 280, 4174–4181 [DOI] [PubMed] [Google Scholar]
- 18. Kornfeld R., Kornfeld S. (1985) Annu. Rev. Biochem. 54, 631–664 [DOI] [PubMed] [Google Scholar]
- 19. Zhang K., Kaufman R. J. (2004) J. Biol. Chem. 279, 25935–25938 [DOI] [PubMed] [Google Scholar]
- 20. Brewer J. W., Hendershot L. M., Sherr C. J., Diehl J. A. (1999) Proc. Natl. Acad. Sci. U.S.A. 96, 8505–8510 [DOI] [PMC free article] [PubMed] [Google Scholar]
- 21. Banerjee D. K., Ornberg R. L., Youdim M. B., Heldman E., Pollard H. B. (1985) Proc. Natl. Acad. Sci. U.S.A. 82, 4702–4716 [DOI] [PMC free article] [PubMed] [Google Scholar]
- 22. Martínez J. A., Torres-Negrón I., Amigó L. A., Banerjee D. K. (1999) Cell Mol. Biol. 45, 137–152 [PubMed] [Google Scholar]
- 23. Zwick E., Bange J., Ullrich A. (2001) Endocr. Relat. Cancer 8, 161–173 [DOI] [PubMed] [Google Scholar]
- 24. Zhang Z., Banerjee A., Baksi K., Banerjee D. K. (2010) Biocatal. Biotransform. 28, 90–98 [DOI] [PMC free article] [PubMed] [Google Scholar]
- 25. Robinson D. R., Wu Y. M., Lin S. F. (2000) Oncogene 20, 5548–5557 [DOI] [PubMed] [Google Scholar]
- 26. Shibuya M. (2001) Cell Struct. Funct. 26, 25–35 [DOI] [PubMed] [Google Scholar]
- 27. Kerbel R. S. (2000) Carcinogenesis 21, 505–515 [DOI] [PubMed] [Google Scholar]
- 28. Weidner N., Folkman J. (1996) Important Adv. Oncol. 167–190 [PubMed] [Google Scholar]
- 29. Dass C. R., Tran T. M., Choong P. F. (2007) J. Dental Res. 86, 927–936 [DOI] [PubMed] [Google Scholar]
- 30. Grossfeld G. D., Ginsberg D. A., Stein J. P., Bochner B. H., Esrig D., Groshen S., Dunn M., Nichols P. W., Taylor C. R., Skinner D. G., Cote R. J. (1997) J. Natl. Cancer Inst. 89, 219–227 [DOI] [PubMed] [Google Scholar]
- 31. Singh R. P., Gu M., Agarwal R. (2008) Cancer Res. 68, 2043–2050 [DOI] [PubMed] [Google Scholar]
- 32. Bornstein P. (1995) J. Cell Biol. 130, 503–506 [DOI] [PMC free article] [PubMed] [Google Scholar]
- 33. Singh R. P., Deep G., Chittezhath M., Kaur M., Dwyer-Nield L. D., Malkinson A. M., Agarwal R. (2006) J. Natl. Cancer Inst. 98, 846–855 [DOI] [PubMed] [Google Scholar]
- 34. Kim K. J., Li B., Winer J., Armanini M., Gillett N., Phillips H. S., Ferrara N. (1993) Nature 362, 841–844 [DOI] [PubMed] [Google Scholar]
- 35. Brooks P. C., Strömblad S., Klemke R., Visscher D., Sarkar F. H., Cheresh D. A. (1995) J. Clin. Invest. 96, 1815–1822 [DOI] [PMC free article] [PubMed] [Google Scholar]
- 36. Ferrara N., Davis-Smyth T. (1997) Endocr. Rev. 18, 4–25 [DOI] [PubMed] [Google Scholar]
- 37. Erlichman C., Adjei A. A., Alberts S. R., Sloan J. A., Goldberg R. M., Pitot H. C., Rubin J., Atherton P. J., Klee G. G., Humphrey R. (2001) Ann. Oncol. 12, 389–395 [DOI] [PubMed] [Google Scholar]
- 38. Hidalgo M., Eckhardt S. G. (2001) J. Natl. Cancer Inst. 93, 178–193 [DOI] [PubMed] [Google Scholar]
- 39. Fotsis T., Zhang Y., Pepper M. S., Adlercreutz H., Montesano R., Nawroth P. P., Schweigerer L. (1994) Nature 368, 237–239 [DOI] [PubMed] [Google Scholar]
- 40. Munoz R., Shaked Y., Bertolini F., Emmenegger U., Man S., Kerbel R. S. (2005) Breast 14, 466–479 [DOI] [PubMed] [Google Scholar]
- 41. McMahon G. (2000) Oncologist 5, 3–10 [DOI] [PubMed] [Google Scholar]
- 42. Hicklin D. J., Ellis L. M. (2005) J. Clin. Oncol. 23, 1011–1027 [DOI] [PubMed] [Google Scholar]
- 43. Sellappan S., Grijalva R., Zhou X., Yang W., Eli M. B., Mills G. B., Yu D. (2004) Cancer Res. 15, 3479–3485 [DOI] [PubMed] [Google Scholar]
- 44. Chambers A. F. (2009) Cancer Res. 69, 5292–5293 [DOI] [PubMed] [Google Scholar]
- 45. Contessa J. N., Bhojani M. S., Freeze H. H., Rehemtulla A., Lawrence T. S. (2008) Cancer Res. 15, 3803–3809 [DOI] [PMC free article] [PubMed] [Google Scholar]