Abstract
Development of tumor-specific probes for imaging by positron emission tomography has broad implications in clinical oncology, such as diagnosis, staging, and monitoring therapeutic responses in patients, as well as in biomedical research. Thymidylate synthase (TSase)-based de novo biosynthesis of DNA is an important target for drug development. Increased DNA replication in proliferating cancerous cells requires TSase activity, which catalyzes the reductive methylation of dUMP to dTMP using (R)-N5,N10-methylene-5,6,7,8-tetrahydrofolate (MTHF) as a cofactor. In principle, radiolabeled MTHF can be used as a substrate for this reaction to identify rapidly dividing cells. In this proof-of-principle study, actively growing (log phase) breast cancer (MCF7, MDA-MB-231, and hTERT-HME1), normal breast (human mammary epithelial and MCF10A), colon cancer (HT-29), and normal colon (FHC) cells were incubated with [14C]MTHF in culture medium from 30 min to 2 h, and uptake of radiotracer was measured. Cancerous cell lines incorporated significantly more radioactivity than their normal counterparts. The uptake of radioactively labeled MTHF depended upon a combination of cell doubling time, folate receptor status, S phase percentage, and TSase expression in the cells. These findings suggest that the recently synthesized [11C]MTHF may serve as a new positron emission tomography tracer for cancer imaging.
Keywords: Cancer, Cancer Biology, Colon Cancer, Folate, Folate Metabolism, Imaging, Folate Receptors, Radiotracer, Thymidylate Biosynthesis
Introduction
Molecular imaging technologies are the most widely used clinical tools for diagnosis, staging, and monitoring therapeutic response in cancer patients (1–3). Many different technologies have been developed to image the structure and function of systems, such as autoradiography, optical imaging, positron emission tomography (PET),2 magnetic resonance imaging, and x-ray computed tomography (4). Among those, PET is the only non-invasive technology that can measure metabolic, biochemical, and functional activity in vivo. Because morphological response to chemotherapy or radiation therapy lags behind the course of the treatment, analysis of PET images can potentially detect pathological features and therapeutic response before they are visible on computed tomography and magnetic resonance images (5, 6), and PET is thus emerging as a valuable clinical tool to monitor therapeutic responses in patients.
PET imaging requires positron-emitting radioisotopes, such as oxygen (14O, 15O) (7, 8) nitrogen (13N) (9), fluorine-18 (18F) (10–12), and carbon (11C) (13–15), incorporated into pharmaceutical probes to observe selective accumulation in a tissue of interest (16, 17). Two of the most extensively used PET probes for cancer are [18F]fluorodeoxyglucose (18–20) and [18F]fluorothymidine (21–24). The [18F]fluorodeoxyglucose probe targets metabolic activity in a nonspecific way, resulting in high background labeling of normal tissues, such as brain, and areas of inflammation. On the other hand, [18F]fluorothymidine is a proliferation marker and targets thymidylate kinase 1, which is a scavenging pathway used by some cells when dTMP is required for DNA synthesis. The [18F]fluorothymidine activity in tumors is not always reliable in the detection of viable residuals in patients with viable carcinoma or mature teratoma in histology (34). False negative and false positive rates for these probes limit their accuracy in monitoring cancer therapy (23, 25–33). We have therefore undertaken to develop an improved PET proliferative tracer with different uptake and/or therapeutic response prediction.
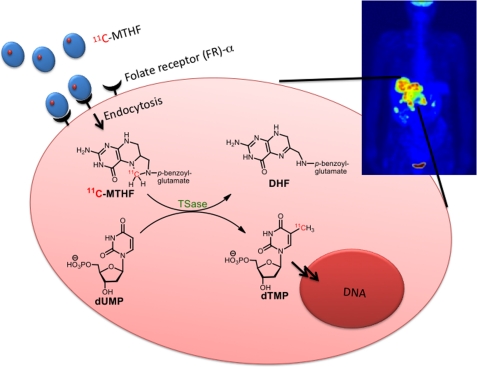
Thymidylate synthase (TSase; EC 2.1.1.45) plays a central role in the de novo biosynthesis of the DNA base thymine in humans. It is overexpressed in many cancers, making it a good target for a diagnostic probe to detect rapidly growing cells (34–38). It catalyzes the reductive methylation of dUMP to dTMP, where the methyl group is provided by the methylene from its cofactor, (R)-N5,N10-methylene-5,6,7,8-tetrahydrofolate (MTHF) (39, 40). We incorporated a radionuclide (11C or 14C) into the methylene carbon of MTHF so that the radiolabeled methylene would be incorporated into dTMP and its downstream products toward DNA. If selectively incorporated into cancerous cells, [11C]MTHF could be used as a PET imaging probe (Fig. 1). The synthesis of [11C]MTHF is presented elsewhere,3 but because of the short half-life of the 11C radionuclide (20.4 min), we have used the chemically equivalent [14C]MTHF for the in vitro studies with cell culture presented here. Our results suggest that the radioactivity is selectively incorporated in cancerous cells, paving the way for further development of MTHF as a cancer detection probe.
FIGURE 1.
Schematic representation of a designed trapping 11C-labeled radiotracer in a typical cancerous cell. [11C]MTHF is sequestered and taken up by FR-α, and the radionuclide (11C) is then transferred to dTMP by TSase and thus retained in the cell by metabolic conversion of dUMP to dTMP.
EXPERIMENTAL PROCEDURES
Materials
14CH2O (50 mCi/mmol, 1–3% aqueous solution) was purchased from Moravek Biochemicals (Brea, CA). Folic acid, TES, dUMP, and dTMP were purchased from Sigma. Recombinant Escherichia coli TSase was expressed and purified from E. coli culture according to the procedures reported by Changchien et al. (41). 5,6-Dihydrofolate, (S)-5,6,7,8-tetrahydrofolate (THF), MTHF, and [14C]MTHF were prepared from folic acid as reported previously (42).
HPLC Analysis
Analytical HPLC was conducted on a System Gold® 126 solvent module connected to a System Gold® 168 detector (Beckman Coulter) for UV monitoring and a series 500TR flow scintillation analyzer (PerkinElmer Life Sciences) for 14C radionuclide monitoring.
Stability of MTHF in Culture Medium
Folate-free RPMI 1640 medium (Invitrogen) with 10% FBS (heat inactivated and sterile filtered, 1 ml; Sigma) in an Eppendorf tube (1.5 ml) was supplemented with MTHF (10 nm to 100 μm) containing ∼0.05 μCi (∼1 × 10⁵ dpm) of [14C]MTHF as a radiotracer and incubated under normal culture conditions (see below) for 0, 5, 30, 60, and 120 min. At a desired time point, an aliquot of the culture medium (100 μl) was removed and mixed with 100 μl of TES containing 1 mm dUMP and 10 units of E. coli TSase to convert the radiotracer from MTHF to the more stable dTMP (39–40, 42). The mixture was incubated at 30 °C for 15 min and then filtered through a 10-kDa molecular mass cutoff filter to remove protein. A 100-μl filtrate was analyzed by HPLC to determine the amount of dTMP formed from MTHF. A Zorbax column (4.6 mm × 15 cm) was eluted with a gradient of 2–5% methanol in 100 mm potassium phosphate (pH 6) over 2 min. The isocratic elution at this composition was conducted for 3 min and then changed linearly to 50% methanol in the next 5 min. The system was held at this composition for the next 5 min and then increased up to 95% methanol to clean the column. Under these conditions, dUMP eluted at 3.2 min, dTMP eluted at 5.8 min, and MTHF/5,6-dihydrofolate eluted at 16 min. Identification and quantitation of dTMP were accomplished by comparing the retention time and area under the peak of the standard solutions of dTMP.
Cell Culture
Breast cancer (MCF7, hTERT-HME1, and MDA-MB-231), normal breast (human mammary epithelial cell (HMEC) and MCF10A), and colon cancer (HT-29) cell lines were kindly provided by Douglas Spitz (University of Iowa). Primary human colon (FHC) cells were purchased from American Type Culture Collection. All cell cultures except HMEC were conducted in an incubator maintained at 37 °C under an atmosphere of 5% CO2 and 95% air. HMEC were maintained in a low oxygen (4%) incubator at 37 °C and 5% CO2. All cell cultures except HMEC were split when 70–80% confluent. MCF10A and hTERT-HME1 cells were grown in DMEM/F-12 medium (Invitrogen) supplemented with 10% heat-inactivated FBS, 1× mammary epithelial growth supplement (containing bovine pituitary extract, bovine insulin, hydrocortisone and recombinant human epidermal growth factor), 50 IU/ml penicillin, and 50 μg/ml streptomycin. The culture was replenished with medium after every 72 h. Cells at 70–80% confluency were used for uptake experiments. MCF7, MDA-MB-231, and HT-29 cells were grown in RPMI 1640 medium supplemented with 10% heat-inactivated FBS, 50 IU/ml penicillin, and 50 μg/ml streptomycin. The culture was replenished with medium after every 72 h. Cells at 70–80% confluency were used for uptake experiments. FHC cells were maintained in DMEM/F12 medium supplemented with 10% heat-inactivated FBS, 10 ng/ml cholera toxin (Sigma), 5 μg/ml insulin (Sigma), 5 μg/ml transferrin (Sigma), 100 ng/ml hydrocortisone (Sigma), 50 IU/ml penicillin, and 50 μg/ml streptomycin. The medium was replaced after every 72 h. Cells at ∼100% confluency were used for uptake experiments. HMEC were grown in basal medium (MEBM®, Lonza) supplemented with SingleQuots® (MEGM® BulletKit®, Lonza). Cells were passaged at 1 × 10⁵/ml. The medium was replaced after every 48 h. To mimic the slow growth in normal mammary gland, HMEC were grown up to 100% confluence, maintained in the same medium for 24 h, and then used for uptake experiments.
Uptake of [14C]MTHF
Cancerous cells were grown to 70–80% confluency. Before the start of uptake experiments, the normal medium was replaced with folate-free RPMI 1640 medium for 30 min. Labeling medium consisted of folate-free RPMI 1640 supplemented with 5% dialyzed FBS, 1× glutamine, 50 IU/ml penicillin, and 50 μg/ml streptomycin. One volume of prewarmed uptake medium (30 ml) was supplemented with MTHF (20 μm final concentration) containing ∼0.5 μCi of [14C]MTHF. The old medium from the cells was aspirated, and 3 ml of labeling medium was added per 10-cm2 plate. The cells were incubated at 37 °C for 30, 60, 90, 120, and 180 min. After treatment, the medium was removed, and cells were washed twice with cold PBS. The cells were detached with 0.25% trypsin/EDTA solution and counted using a Coulter Counter (Beckman Coulter). The cell pellet was lysed in 0.5 ml of 0.5% SDS, mixed with scintillation fluid, and counted in a scintillation counter for 5 min using the 14C window.
Washout of Label from Cells
After labeling cells grown in four plates as described above, one culture plate was processed, and total incorporation was measured by liquid scintillation counting (LSC). This uptake was regarded as 100%. From the remaining three culture plates, the medium was removed, cells were washed twice with cold PBS, and normal growth medium (5 ml) was then added at 37 °C for 30 min. The radiotracer released in the medium after 30 min was measured by LSC in triplicate, and cells were replenished with 5 ml of fresh medium for the next 30 min of washing. The release of radiotracer was followed up to 120 min.
Measurement of Cell Growth Rate
The cells were seeded at a density of 4 × 10⁴ cells/cm2 in each of four 6-cm (20-cm2) plates containing 5 ml of medium and placed in an incubator maintained under the conditions described above. Once the cells were in log phase (48 h post-plating), two plates were processed to count the total cells. The average number of cells from these plates was regarded as p1. After the next 24 h, the remaining two plates were processed, and the total cells were counted again (p2). The doubling time was then calculated using the following formula: doubling time (h) = 24 × ln 2/ln(p2/p1).
Western Blot Analysis of Folate Receptor-α and TSase Enzyme
The culture medium of the cells in log phase was aspirated and washed twice with cold PBS. The cells were then harvested on ice with 200 μl of cold lysis buffer containing 1% Triton X-100, 0.5% sodium deoxycholate, 0.1% SDS, 1 mm sodium orthovanadate, and 1 tablet of Complete mini EDTA-free mixture. The extract was incubated on ice for 20 min, passed through a 25-gauge needle, and finally centrifuged (Eppendorf 5403 centrifuge) at 15,000 × g for 20 min at 4 °C. The supernatant was removed in a 1.5-ml tube, and protein concentrations were measured using a BCA protein kit. A protein sample of 50 μg was loaded and electrophoresed in 10% SDS-polyacrylamide gels. Size standards from 10 to 250 kDa (Bio-Rad Kaleidoscope) were included. Polypeptides were electrotransferred to nitrocellulose membranes. The membranes were blocked with 5% nonfat milk in 3% BSA and 0.2% Tween 20 in PBS. The membranes were then exposed to anti-human folate receptor or anti-human TSase antibody (Santa Cruz Biotechnology) and treated with antibodies labeled with Alexa Fluor 680 or Alexa Fluor 800. The membranes were blotted on a LI-COR Odyssey scanner.
Cell Cycle Analysis
Cells in log phase at the same confluency used for uptake experiments or growth-inhibited cells (treated with aphidicolin) were harvested using trypsin and washed twice with cold PBS. The cells were suspended at a density of 1 × 10⁶ cells/ml in PBS and fixed with 70% ethanol at −20 °C. The DNA content of the cells was stained with 1 ml of staining buffer containing propidium iodide (5 μg/ml), RNase A (1 mg/ml), and glucose (1 mg/ml) in PBS. The stained cells were filtered through 70-μm nylon strainer and then analyzed for DNA content on a FACScan flow cytometer (BD Biosciences) using FlowJo software.
RESULTS AND DISCUSSION
Stability of MTHF in Culture Medium
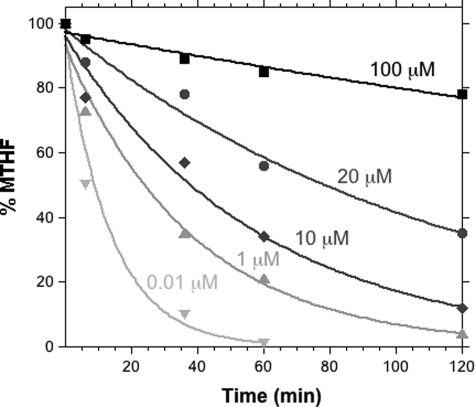
The stability of MTHF might limit its pharmaceutical use. In most part, that stability is determined by the hydrolysis of the methylene as formaldehyde and the sensitivity of the product THF to oxygen. We therefore measured the stability of MTHF in culture medium. Concentrations of MTHF ranging from 10 nm to 100 μm containing a fixed amount of radiotracer (14C) were incubated in culture medium under the conditions used for cell incorporation experiments. MTHF remaining in the medium at different time points was measured by quantitatively converting dUMP + [14C]MTHF to [14C]dTMP by the E. coli TSase-catalyzed reaction. The amount of [14C]dTMP formed was then analyzed in an HPLC system connected to a radioactive flow detector (Fig. 2). Data were fitted to a single exponential decay. The analytical assay in which [14C]MTHF is quantitatively converted to [14C]dTMP was developed, tested, and used in many of our kinetic isotope effect measurements while studying TSase (39–40, 42). In this case, 10 nm to 100 μm MTHF was measured with 10 units of E. coli TSase for 15 min, and we found that all the [14C]MTHF radioactivity had been converted to [7-14C]dTMP (>99.9%). Because the lower range was not found stable, we did not test amounts <10 nm.
FIGURE 2.
Stability profile of MTHF in culture medium. MTHF in medium after a specific time point was used to convert dUMP to dTMP catalyzed by E. coli TSase, and the amount of dTMP was analyzed by HPLC.
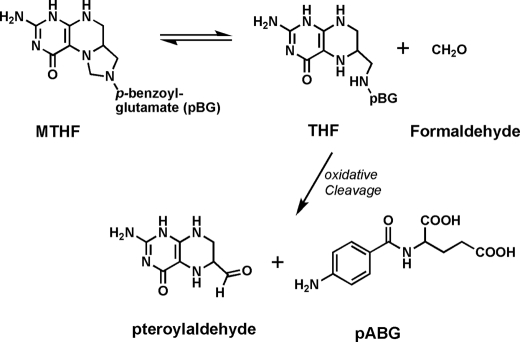
From Fig. 2, it is clear that the decomposition of MTHF does not follow first-order kinetics, and its rate is concentration-dependent. The rate of decomposition (kdec) is 7.27 × 10⁻²/min at 10 nm MTHF, and this rate decreases to 1.94 × 10⁻³/min with increasing concentrations of MTHF up to 100 μm. The concentration-dependent stability of MTHF up to 330 min at 100 μm is sufficient for labeling cell cultures. Although the mechanism of concentration-dependent MTHF stability is not clear, it may be related to equilibrium with formaldehyde in the solution. Because MTHF in aqueous solution hydrolyzes to formaldehyde and THF (Fig. 3), the reverse reaction is in competition with irreversible C9-N10 oxidative cleavage of THF into pteridine-6-aldehyde and p-aminobenzoyl-l-glutamate (43, 44), as well as oxidation of THF to 5,6-dihydrofolate and other oxidation derivatives. At very low concentrations of MTHF, the released formaldehyde diffuses into solution, leaving THF unprotected, and oxidative cleavage reactions quickly shift the equilibrium toward further hydrolysis.
FIGURE 3.
Equilibrium between THF and formaldehyde and the irreversible oxidative cleavage of THF. Other oxidative paths (e.g. to 5,6-dihydrofolate or hydroxylation of C-4) are also likely to contribute to irreversible decomposition of MTHF. pABG, p-aminobenzoyl-l-glutamate.
To obtain sufficient MTHF for labeling with a sufficiently long half-life and yet not risk overdose of folate in the medium, we selected a concentration of 20 μm to be a suitable dose of MTHF with a reasonable stability (half-life ∼ 78 min). This choice was made so that the time scale of the in vitro experiments described below is relevant to the short-lived 11C to be used in vivo.
Uptake of MTHF by Normal and Cancerous Cell Lines
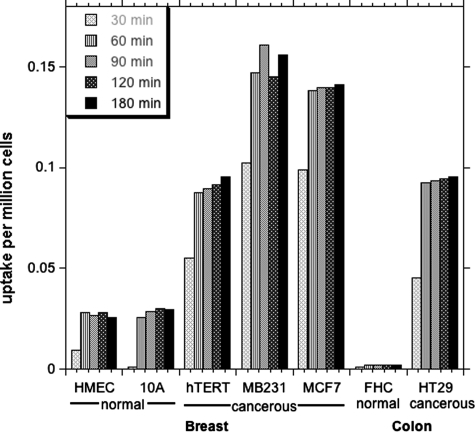
We proposed that cancerous cell lines may be inherently more capable of incorporating exogenous MTHF than their normal cell counterparts. To test this proposal, different cell lines derived from breast (MCF7, MDA-MB-231, and hTERT-HME1) and colon (HT-29) cancers and their normal counterparts (HMEC and MCF10A for breast and FHC for colon) were grown in their respective growth media and maintained in log phase. Before the start of uptake experiments, the normal growth medium was removed and replaced with folate-free medium for 30 min to remove any folate attached to the receptors on the membrane and to allow the cell to slightly “starve” of folates. It should be noted that this short folate starvation does not significantly deplete intracellular polyglutaminated folate reserves, which may last for several days under these conditions (data not shown). Cells were incubated with 20 μm MTHF containing 0.05 μCi of 14C tracer for different time periods (0.5, 1, 1.5, and 2 h). The radiotracer taken up by the cells was determined by LSC and normalized to the total cell numbers and the initial dose of radioactivity as calculated by the following formula: normalized uptake = (cpm recorded in cells)/(cpm added × total cells in millions).
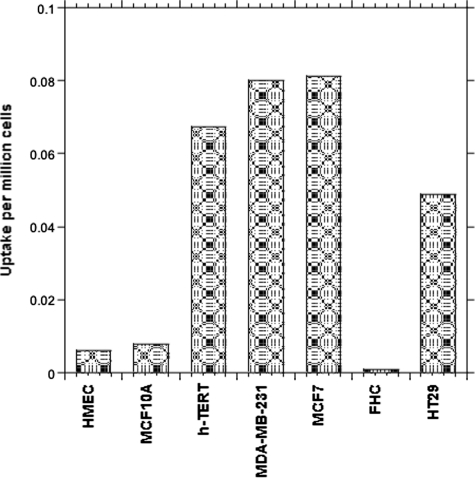
As shown in the Fig. 4, cancerous cells lines (hTERT-HME1, MCF7, and MDA-MB-231) took up >3-fold the amount of label incorporated into non-cancerous control cell lines (HMEC and MCF10A). In the case of the colon cancer cell line (HT-29), the uptake was at least 30 times more predominant than in normal FHC cells, for which uptake was not higher than the background. Interestingly, the spontaneous immortalized “normal” cell line (MCF10A) also showed less uptake compared with the cancerous cells.
FIGURE 4.
Incorporation of [14C]MTHF by normal and cancerous cells derived from breast and colon tissues. The uptake is in cpm/million cells. The cells in log phase were placed in labeling medium containing 20 μm MTHF, and the amount of tracer retained in the cells was measured by LSC and normalized to total cell numbers and the amount of radiotracer added in the medium. Measurements were conducted in triplicates or duplicates, and the variation was <5%.
MTHF can be both taken up by the cell and, to an extent, lost from the internal pool to the cell culture medium. The time taken to reach steady state reflects the relative rates of these two processes. Uptake of label by cancerous cell lines reached a maximum level after 60 min. Incubation for longer than 60 min did not change the amount of label incorporated into the cell, indicating that the intracellular pool was saturated and at steady state.
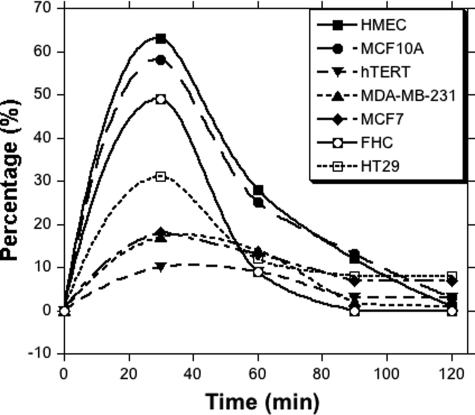
To examine the release of radioactivity from these cells, the [14C]MTHF-loaded cells (after 2 h of uptake) were placed in fresh complete medium containing an excess of unlabeled folate at 37 °C. The medium was replaced after every 30 min, and the radiotracer released in the medium was measured by LSC. As shown in Fig. 5, the highest release of radiotracer was observed in the normal cells, in which >50% of the tracers were released in the first 30 min of incubation. In the cancerous cell lines, the release of the radiotracer was not >20%. After 30 min, the release of radioactivity in the medium was slow and reached the background value after two successive washings. After washing, the label retained in each cell line was determined and is plotted in Fig. 6. The breast cancer (hTERT-HME1, MDA-MB-231, and MCF7) and colon cancer (HT-29) cell lines retained the highest amount of tracer, whereas their non-cancerous counterparts retained a much lower, near-background amount of label. This suggests that the label associated with cancerous cell lines is significantly more likely to be retained than that in non-cancerous cell lines.
FIGURE 5.
Percentage release of radioactivity after cells were placed in fresh growth medium and subjected to successive post-incubation washes. The culture medium was changed after every 30 min and analyzed for radioactive release by LSC. Measurements were conducted in triplicates or duplicates, and the variation was <5%.
FIGURE 6.
Retention of radioactivity in cells. The cells were successively washed by placing in fresh medium for 30 min/wash. After 2 h, the cells were harvested, and radiotracer retained by cells was measured by LSC after lysing the cells. Measurements were conducted in triplicates or duplicates, and the variation was <5%.
To better understand why cancerous cell lines take up and retain more MTHF, three cellular parameters were examined and correlated with the amount of radiotracer retained by the cells. These included cell doubling time, plasma membrane folate receptor status, and TSase enzyme protein level.
Doubling Time Versus [14C]MTHF Uptake
40,000 cells/cm2 from each line were grown in 6-cm (20-cm2) plates in their recommended media. As the doubling time is more reliably measured in log phase, the cells were recounted 48 h after splitting to establish population p1 and again at 72 h to establish population p2. Breast (HMEC) and colon (FHC) primary cells were the slowest growing cells, with doubling times of 124.2 ± 5.5 and 76.2 ± 8.5 h, respectively. Spontaneously immortalized breast MCF10A cells doubled in 24 h. On the other hand, the cancerous cell lines, once in log phase, had doubling times ranging from 20 to 31 h (Table 1). A negative correlation (r = −0.63) was observed between the doubling time of cells and MTHF uptake. This observation is in accordance with the fact that the cells having a short doubling time need enhanced synthesis of thymine base and thus indicated enhanced MTHF uptake. Because the intracellular thymine base pool can be replenished by two distinct and unique pathways, namely the salvage pathway and de novo synthesis, the information of cell doubling time is not sufficient to show the dependence of MTHF uptake on cell proliferation rate. Therefore, we examined the FR-α status and TSase protein expression level in the treated cells.
TABLE 1.
Doubling time, percent age of S + G2M phase, and uptake of MTHF in normal and growth-inhibited cells
| Cell type | Doubling time | Normal growing cells |
Aphidicolin-arrested cells |
||
|---|---|---|---|---|---|
| Proliferation index (S + G2M) | MTHF uptake | Proliferation index (S + G2M) | MTHF uptake | ||
| h | % | ×10−3/106 cells | % | ×10−3/106 cells | |
| HMEC | 124.2 ± 5.5 | 11 | 5.98 | 4 | 1.23 |
| MCF10A | 24.1 ± 1.5 | 12 | 7.79 | 3 | 2.34 |
| hTERT-HME1 | 20.4 ± 2.5 | 23 | 67.3 | 6 | 5.74 |
| MDA-MB-231 | 27.8 ± 1.3 | 25 | 81.3 | 6 | 3.45 |
| MCF7 | 31.0 ± 1.6 | 24 | 80.0 | 5 | 4.92 |
| FHC | 76.2 ± 8.5 | 9 | 0.94 | 3 | 0.54 |
| HT-29 | 22.4 ± 2.5 | 19 | 48.9 | 6 | 3.82 |
Western Blot Analyses of Folate Receptor and TSase Protein Expression
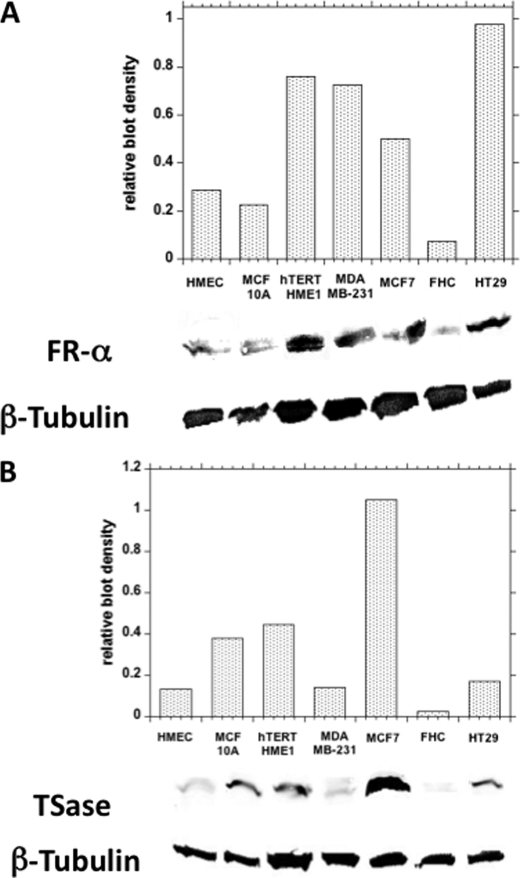
Folic acid and reduced folates are transported across the plasma membrane via the folate receptor. A number of human cancers are reported to overexpress folate receptor-α (FR-α) and cytosolic TSase protein (34–38). To observe the dependence of uptake of [14C]MTHF on FR-α expression, a Western blot for FR-α was performed on all cell lines (Fig. 7).
FIGURE 7.
Western blot analysis of folate receptors (A) and TSase (B) in cell pellets. Measurements were conducted in triplicates or duplicates, and the variation was <5%.
All cell lines used in this study showed the presence of FR-α; however, the level of protein expression was different for each cell line (Fig. 7A). Cancerous cell lines had approximately twice as much FR-α protein expression as observed in non-cancerous cell lines. The density of the blots due to FR-α was determined and normalized to that of β-tubulin and then plotted for each cell line (Fig. 7A, upper panel). A good correlation (r = 0.74) between the level of FR-α protein expressed on the membrane and the level of MTHF uptake suggested that at least part of the increased incorporation of label by cancerous cell lines could be attributed to FR-α expression.
Because MTHF is a cofactor of TSase that converts dUMP to dTMP, induction of the de novo pathway for DNA synthesis may render the expression of this enzyme, which could be another important parameter for the retention of [14C]MTHF radioactivity in cells. Therefore, we sought to find a correlation between MTHF tracer uptake in the cells and TSase enzyme expression levels. The levels of TSase enzyme were determined by Western blot analyses (Fig. 7B). Apparently, TSase tends to be more highly expressed in cancerous cell lines. For example, cancerous MCF7 cells expressed far more than normal breast (HMEC) and colon cells. However, only a fair correlation between TSase and label incorporation was observed (r = 0.54). Interestingly, when taken together, the total effects of expression of FR-α and TSase protein correlated strongly (r = 0.86) with MTHF uptake. This indicated that, for a predominant and specific MTHF uptake, overexpression of both FR-α οn the plasma membrane and TSase in the cytoplasm is required. The cancerous cell lines exhibiting overexpression of both proteins compared with their normal counterparts tended to incorporate more MTHF.
Cell Cycle Versus MTHF Uptake
Biosynthesis of DNA and its precursor bases increases during S phase of the cell cycle. Therefore, we sought to explore the correlation between MTHF uptake and the proliferation index (percentage of cells in S + G2M phase) exhibited by each cell line. Unsynchronized cells, as used for labeling, were alcohol-fixed, and the DNA was stained with propidium iodide. DNA content can be used as a proxy for determining cell cycle stage. The DNA content was then analyzed using a FACScan flow cytometer, and data were processed using FACSCalibur software. As shown in the Table 1, the cells grown in normal growth medium showed a high proliferation index, which is highly correlated (r = 0.99) with the uptake levels exhibited by these cells. Alternatively, when the cells were treated with aphidicolin, an inhibitor of DNA polymerase-α, the proliferation index was reduced by up to 4-fold. Labeling of cells arrested in S phase by aphidicolin showed a marked reduction in the tracer retained in these cells (Table 1). These results suggest that cells passing through S phase take up most of the MTHF, linking the radioactivity uptake to enhanced cell proliferation. In another experiment, we treated cells with a chemotherapeutic agent (methotrexate) for 24 h and then incubated them with [14C]MTHF for 1 h, and we observed a 90–95% decline in uptake relative to cells not treated with methotrexate.
In conclusion, the findings presented here demonstrate that radioactivity from labeled MTHF is incorporated and retained more by cancerous cell lines than by non-cancerous cell lines. This labeling is dependent primarily on higher expression of the folate receptor in the cancerous cell lines and, to a lesser extent, on the higher level of TSase. The possibility that correlation with TSase expression is suppressed under the current conditions by the high levels of folates in the media is under investigation. Moreover, the cells exhibiting a higher proliferation index (portion of cells in S + G2M phase) take up more MTHF than the non-proliferating cells. Together, these results suggest that methylene-labeled MTHF likely may be used as a specific and unique probe for the labeling of cancerous cells. Further studies are under way to test the biostability and biodistribution of [14C]MTHF in rodents. The current results support the development of the [11C]MTHF radiotracer3 to further determine the feasibility of MTHF-based PET for imaging cancers in vivo. An additional application that would be affected by the current study is the use of stable [13C]MTHF for magnetic resonance imaging analysis of cancer.
This work was supported by a pilot grant from the Institute of Clinical and Translational Science and a Biological Science Funding Program grant from the University of Iowa.
M. Saeed, T. J. Tewson, E. Colbin, and A. Kohen, submitted for publication.
- PET
- positron emission tomography
- TSase
- thymidylate synthase
- MTHF
- (R)-N5,N10-methylene-5,6,7,8-tetrahydrofolate
- TES
- N-tris(hydroxymethyl)methyl-2-aminoethanesulfonic acid
- THF
- (S)-5,6,7,8-tetrahydrofolate
- HMEC
- human mammary epithelial cell(s)
- LSC
- liquid scintillation counting
- FR-α
- folate receptor-α.
REFERENCES
- 1. van der Meel R., Gallagher W. M., Oliveira S., O'Connor A. E., Schiffelers R. M., Byrne A. T. (2010) Drug Discov. Today 15, 102–114 [DOI] [PubMed] [Google Scholar]
- 2. Perrone A. (2008) J. Nucl. Med. 49, 25N [PubMed] [Google Scholar]
- 3. McEwan A. J., Van Brocklin H. F., Divgi C. (2008) J. Nucl. Med. 49, 37N–40N [PubMed] [Google Scholar]
- 4. Hayat M. A. (ed) (2008) Cancer Imaging, Volumes 1 and 2, Academic Press, New York [Google Scholar]
- 5. Juweid M. E., Cheson B. D. (2006) N. Engl. J. Med. 354, 496–507 [DOI] [PubMed] [Google Scholar]
- 6. Bouchelouche K., Capala J., Oehr P. (2009) Curr. Opin. Oncol. 21, 469–474 [DOI] [PMC free article] [PubMed] [Google Scholar]
- 7. Sajjad M., Zaini M. R., Liow J. S., Rottenberg D. A., Strother S. C. (2002) Appl. Radiat. Isot. 57, 607–615 [DOI] [PubMed] [Google Scholar]
- 8. Lodge M. A., Jacene H. A., Pili R., Wahl R. L. (2008) J. Nucl. Med. 49, 1620–1627 [DOI] [PMC free article] [PubMed] [Google Scholar]
- 9. Xiangsong Z., Xinjian W., Yong Z., Weian C. (2008) Nucl. Med. Commun. 29, 1052–1058 [DOI] [PubMed] [Google Scholar]
- 10. Timmers H. J., Chen C. C., Carrasquillo J. A., Whatley M., Ling A., Havekes B., Eisenhofer G., Martiniova L., Adams K. T., Pacak K. (2009) J. Clin. Endocrinol. Metab. 94, 4757–4767 [DOI] [PMC free article] [PubMed] [Google Scholar]
- 11. Drzezga A. (2009) Behav. Neurol. 21, 101–115 [DOI] [PMC free article] [PubMed] [Google Scholar]
- 12. Yoshida Y., Kurokawa T., Tsujikawa T., Okazawa H., Kotsuji F. (2009) J. Ovarian Res. 2, 7 [DOI] [PMC free article] [PubMed] [Google Scholar]
- 13. Ullrich R. T., Kracht L., Brunn A., Herholz K., Frommolt P., Miletic H., Deckert M., Heiss W. D., Jacobs A. H. (2009) J. Nucl. Med. 50, 1962–1968 [DOI] [PubMed] [Google Scholar]
- 14. Song W. S., Nielson B. R., Banks K. P., Bradley Y. C. (2009) Nucl. Med. Commun. 30, 462–465 [DOI] [PubMed] [Google Scholar]
- 15. Hooker J. M., Schönberger M., Schieferstein H., Fowler J. S. (2008) Angew. Chem. Int. Ed. Engl. 47, 5989–5992 [DOI] [PMC free article] [PubMed] [Google Scholar]
- 16. Phelps M. E. (2000) J. Nucl. Med. 41, 661–681 [PubMed] [Google Scholar]
- 17. Phelps M. E. (2000) Proc. Natl. Acad. Sci. U.S.A. 97, 9226–9233 [DOI] [PMC free article] [PubMed] [Google Scholar]
- 18. Nair V. S., Krupitskaya Y., Gould M. K. (2009) J. Thorac. Oncol. 4, 1473–1479 [DOI] [PubMed] [Google Scholar]
- 19. Miele E., Spinelli G. P., Tomao F., Zullo A., De Marinis F., Pasciuti G., Rossi L., Zoratto F., Tomao S. (2008) J. Exp. Clin. Cancer Res. 27, 52 [DOI] [PMC free article] [PubMed] [Google Scholar]
- 20. Pelosi E., Deandreis D. (2007) Eur. J. Surg. Oncol. 33, 1–6 [DOI] [PubMed] [Google Scholar]
- 21. Bradbury M. S., Hambardzumyan D., Zanzonico P. B., Schwartz J., Cai S., Burnazi E. M., Longo V., Larson S. M., Holland E. C. (2008) J. Nucl. Med. 49, 422–429 [DOI] [PMC free article] [PubMed] [Google Scholar]
- 22. Chao K. S. (2006) Semin. Oncol. 33, S59–S63 [DOI] [PubMed] [Google Scholar]
- 23. Saga T., Kawashima H., Araki N., Takahashi J. A., Nakashima Y., Higashi T., Oya N., Mukai T., Hojo M., Hashimoto N., Manabe T., Hiraoka M., Togashi K. (2006) Clin. Nucl. Med. 31, 774–780 [DOI] [PubMed] [Google Scholar]
- 24. Shields A. F., Briston D. A., Chandupatla S., Douglas K. A., Lawhorn-Crews J., Collins J. M., Mangner T. J., Heilbrun L. K., Muzik O. (2005) Eur. J. Nucl. Med. Mol. Imaging 32, 1269–1275 [DOI] [PubMed] [Google Scholar]
- 25. Been L. B., Suurmeijer A. J., Cobben D. C., Jager P. L., Hoekstra H. J., Elsinga P. H. (2004) Eur. J. Nucl. Med. Mol. Imaging 31, 1659–1672 [DOI] [PubMed] [Google Scholar]
- 26. Troost E. G., Vogel W. V., Merkx M. A., Slootweg P. J., Marres H. A., Peeters W. J., Bussink J., van der Kogel A. J., Oyen W. J., Kaanders J. H. (2007) J. Nucl. Med. 48, 726–735 [DOI] [PubMed] [Google Scholar]
- 27. Honer M., Ebenhan T., Allegrini P. R., Ametamey S. M., Becquet M., Cannet C., Lane H. A., O'Reilly T. M., Schubiger P. A., Sticker-Jantscheff M., Stumm M., McSheehy P. M. (2010) Transl. Oncol. 3, 264–275 [DOI] [PMC free article] [PubMed] [Google Scholar]
- 28. Buck A. K., Hetzel M., Schirrmeister H., Halter G., Möller P., Kratochwil C., Wahl A., Glatting G., Mottaghy F. M., Mattfeldt T., Neumaier B., Reske S. N. (2005) Eur. J. Nucl. Med. Mol. Imaging 32, 525–533 [DOI] [PubMed] [Google Scholar]
- 29. van Westreenen H. L., Cobben D. C., Jager P. L., van Dullemen H. M., Wesseling J., Elsinga P. H., Plukker J. T. (2005) J. Nucl. Med. 46, 400–404 [PubMed] [Google Scholar]
- 30. Yap C. S., Czernin J., Fishbein M. C., Cameron R. B., Schiepers C., Phelps M. E., Weber W. A. (2006) Chest 129, 393–401 [DOI] [PubMed] [Google Scholar]
- 31. Bading J. R., Shields A. F. (2008) J. Nucl. Med. 49, 64S–80S [DOI] [PubMed] [Google Scholar]
- 32. Wang W., Cassidy J., O'Brien V., Ryan K. M., Collie-Duguid E. (2004) Cancer Res. 64, 8167–8176 [DOI] [PubMed] [Google Scholar]
- 33. van Waarde A., Elsinga P. H. (2008) Curr. Pharm. Des. 14, 3326–3339 [DOI] [PubMed] [Google Scholar]
- 34. Lindebjerg J., Nielsen J. N., Hoeffding L. D., Bisgaard C., Brandslund I., Jakobsen A. (2006) Appl. Immunohistochem. Mol. Morphol. 14, 37–41 [DOI] [PubMed] [Google Scholar]
- 35. Yu Z., Sun J., Zhen J., Zhang Q., Yang Q. (2005) Histol. Histopathol. 20, 871–878 [DOI] [PubMed] [Google Scholar]
- 36. Yasumatsu R., Nakashima T., Uryu H., Ayada T., Wakasaki T., Kogo R., Masuda M., Fukushima M., Komune S. (2009) Chemotherapy 55, 36–41 [DOI] [PubMed] [Google Scholar]
- 37. Kiss-László Z., Nagy B., Thurzó L., Szabó J. (2006) Magy. Onkol. 50, 33–37 [PubMed] [Google Scholar]
- 38. Shimoda M., Sawada T., Kubota K. (2009) Pathobiology 76, 193–198 [DOI] [PubMed] [Google Scholar]
- 39. Hong B., Maley F., Kohen A. (2007) Biochemistry 46, 14188–14197 [DOI] [PMC free article] [PubMed] [Google Scholar]
- 40. Agrawal N., Hong B., Mihai C., Kohen A. (2004) Biochemistry 43, 1998–2006 [DOI] [PubMed] [Google Scholar]
- 41. Changchien L. M., Garibian A., Frasca V., Lobo A., Maley G. F., Maley F. (2000) Protein Expr. Purif. 19, 265–270 [DOI] [PubMed] [Google Scholar]
- 42. Agrawal N., Mihai C., Kohen A. (2004) Anal. Biochem. 328, 44–50 [DOI] [PubMed] [Google Scholar]
- 43. Murphy M., Keating M., Boyle P., Weir D. G., Scott J. M. (1976) Biochem. Biophys. Res. Commun. 71, 1017–1024 [DOI] [PubMed] [Google Scholar]
- 44. Verlinde P. H., Oey I., Deborggraeve W. M., Hendrickx M. E., Van Loey A. M. (2009) J. Agric. Food Chem. 57, 6803–6814 [DOI] [PubMed] [Google Scholar]


