

Abstract
Invasive cancers use pericellular proteolysis to breach the extracellular matrix and basement membrane barriers and invade the surrounding tissue. Proinvasive membrane type-1 matrix metalloproteinase (MT1-MMP) is the primary mediator of proteolytic events on the cancer cell surface. MT1-MMP is synthesized as a zymogen. The latency of MT1-MMP is maintained by its N-terminal inhibitory prodomain. In the course of MT1-MMP activation, the R108RKR111↓Y112 prodomain sequence is processed by furin. The intact prodomain released by furin alone, however, is a potent inhibitor of the emerging MT1-MMP enzyme. Evidence suggests that the prodomain undergoes intradomain cleavage at the PGD↓L50 site followed by the release of the degraded prodomain by furin cleavage that finalizes the two-step activation event. These cleavages, only if combined, cause the activation of MT1-MMP. The significance of the intradomain cleavage in the protumorigenic program of MT1-MMP, however, remained unidentified. To identify this important parameter, in our current study, we used the cells that expressed the wild-type prodomain-based fluorescent biosensor and the mutant biosensor with the inactivated PGD↓L50 cleavage site (L50D mutant) and also the cells with the enforced expression of the wild-type and L50D mutant MT1-MMP. Using cell-based tests, orthotopic breast cancer xenografts in mice, and genome-wide transcriptional profiling of cultured cells and tumor xenografts, we demonstrated that the intradomain cleavage of the PGD↓L50 sequence of the prodomain is essential for the protumorigenic function of MT1-MMP. Our results emphasize the importance of the intradomain cleavages resulting in the inactivation of the respective inhibitory prodomains not only for MT1-MMP but also for other MMP family members.
Keywords: Fusion Protein, Metalloprotease, Protease, Secretion, Trafficking, Tumor, Furin, MT1-MMP, Prodomain Cleavage
Introduction
Normal and malignant cells rely on pericellular proteolysis to penetrate through tissue barriers (1–3). The invasive phenotype is frequently associated with the cellular matrix metalloproteinase (MMP)2 activity (4). The human MMP family comprises 24 individual enzymes (5). Six membrane type MMPs (MT-MMPs) are distinguished from soluble MMPs by an additional transmembrane domain and a short cytoplasmic tail (MT1-, MT2-, MT3-, and MT5-MMP) or by a glycosylphosphatidylinositol anchor (MT4- and MT6-MMPs) (6, 7). There is compelling evidence that MT1-MMP functions as a proinvasive factor (8–10). MT1-MMP is the primary mediator of proteolytic events on the cell surface (11). MT1-MMP is directly involved in the pericellular proteolysis of the ECM proteins, activation of soluble MMPs, and cleavage of adhesion and signaling cell receptors (12–14). Although MT1-MMP is ubiquitously expressed, its activity is elevated in metastatic malignancies (15), a cause of mortality and morbidity in cancer patients.
MT1-MMP is synthesized de novo as a latent proenzyme (16). Proteolytic removal of the N-terminal prodomain is required for the proenzyme conversion into the functionally active MT1-MMP enzyme. It is established that in the course of the secretion pathway of the MT1-MMP proenzyme through the cell compartment the R108RKR111↓Y112 prodomain sequence is processed by furin (17, 18). We demonstrated, however, that the intact prodomain released by furin alone is a potent inhibitor of the emerging MT1-MMP enzyme. Evidence suggests that the activation of cellular MT1-MMP represents a stepwise process (19, 20). In this stepwise process, the PGD↓L50 sequence of the prodomain “bait region” is cleaved intracellularly either by MMPs, which are distinct from MT1-MMP, or by autocatalysis if cellular MT1-MMP is overexpressed. Intradomain cleavage results in the activation intermediate commencing from the N-terminal Leu50. Furin proteolysis then follows to complete both the degradation and removal of the residual prodomain sequence, thus transforming the activation intermediate into the mature, proteolytically active MT1-MMP enzyme commencing from the N-terminal Tyr112 (13, 21, 22).
We used mutagenesis to inactivate the PGD↓L50 cleavage site in the prodomain and to generate the MT1-MMP L50D mutant that was processed by furin alone. Because of its continuing non-covalent association with the intact inhibitory prodomain, the L50D mutant enzyme appeared functionally silenced (20). These earlier biochemical studies shed light on the mechanistic aspects of MT1-MMP activation. The functional significance of these mechanistic findings to malignancy, however, remained unidentified.
Here, we provide evidence that the PGD↓L50 interdomain cleavage of the prodomain is a decisive parameter for exposing the protumorigenic function of MT1-MMP. If the interdomain cleavage is inactivated by the L50D mutation and, as a result, the prodomain is released by furin cleavage alone, the protumorigenic function of cellular MT1-MMP is significantly reduced in vivo.
MATERIALS AND METHODS
Antibodies, Reagents, and Cells
Reagents were from Sigma unless indicated otherwise. The V5 and Golgin-97 monoclonal antibodies were from Invitrogen. A rabbit polyclonal Ki-67 antibody was from NeoMarkers. A rabbit antibody against human type I collagen was from Novus Biologicals. A murine monoclonal GFP antibody was from Biopioneer. Breast carcinoma MCF7 and fibrosarcoma HT1080 cells were obtained from the ATCC (Manassas, VA). Highly metastatic breast carcinoma MDA-MB-435/melanoma M14 cells (M4A4 clone) (23) were a gift from Virginia Urquidi (University of California, San Diego, CA). Cells were routinely grown in DMEM, 10% FBS.
Cloning and Mutagenesis
The cDNA fragments encoding the full-length wild-type human MT1-MMP (MT1) and the L50D and E240A mutants were generated by PCR mutagenesis (20, 24). The amplified fragments were cloned into the pLenti6/V5-D-TOPO vector (Invitrogen). MCF7 cells were transfected with the MT1, L50D, and E240A constructs to generate MCF7-MT1, MCF7-L50D, and MCF7-E240A cells, respectively. The stable transfectants were selected in DMEM supplemented with 10 μg/ml blasticidin.
To construct the fluorescent biosensors, monomeric red fluorescent protein 1 (called RFP in the text below) (25) was inserted between Ser24 and Leu25 of the prodomain construct. Enhanced green fluorescent protein (called GFP in the text below) was then fused with the C-terminal Val107 of the prodomain and followed by the MT1-MMP 509–582 sequence including the transmembrane domain and the cytoplasmic tail. As a result, the biosensor constructs did not include the R108RKR↓Y112 furin cleavage site. The specific primers are listed in Table 1. MCF7, HT1080, and MDA-MB-435 cells were transfected with the biosensor constructs in the pLenti6/V5-D-TOPO vector.
TABLE 1.
Oligonucleotide primers used to construct RFP-PRO-GFP biosensor
SP, signal peptide; TM, transmembrane domain of MT1-MMP.
| Description | MT1-MMP site | Forward primer (5′–3′) | Reverse primer (5′–3′) |
|---|---|---|---|
| SP/RFP junction | Ser24 | GCGCTCGCCTCCGCGGCCGCAGCCTCCTCCGAG | CTCGGAGGAGGCTGCGGCCGCGGAGGCGAGCGC |
| RFP/PRO junction | Leu25 | CTCCACCGGCGCCGGAGGAGGAGGGCGCGCCCTCGGCTCGGCC | GGCCGAGCCGAGGGCGCGCCCTCCTCCTCCGGCGCCGGTGGAG |
| PRO/GFP junction | Val107 | GATCAAGGCCAATGTTGCGGGAGGAGGAGTGAGCAAGGGCGAGGAG | CTCCTCGCCCTTGCTCACTCCTCCTCCCGCAACATTGGCCTTGATC |
| GFP/TM junction | Pro509 | GGATCCACCGGATCTAGAGGAGGAGGGCCATCGGGAGGCCGGCCGGATGAG | CTCATCCGGCCGGCCTCCCGATGGCCCTCCTCCTCTAGATCCGGTGGATCC |
Cell Surface Biotinylation
The MCF7-MT1, MCF7-L50D, MCF7-E240A, and original MCF7 cells were biotinylated for 1 h on ice in PBS using membrane-impermeable EZ-Link sulfo-NHS-LC-biotin (sulfosuccinimidyl-6-(biotinamido)hexanoate; 0.1 mg/ml; Pierce). Cells were lysed in 20 mm Tris-HCl, 150 mm NaCl, 1% deoxycholate, 1% IGEPAL, pH 7.4, supplemented with protease inhibitor mixture set III, 1 mm phenylmethylsulfonyl fluoride, and 10 mm EDTA. Biotinylated proteins were precipitated from cell lysates using streptavidin-agarose beads.
Biosensor Imaging in Cells
Cells were grown on glass coverslips for 16–18 h, fixed for 10 min using 4% p-formaldehyde, and analyzed using an Olympus BX51 fluorescence microscope with an attached MagnaFire camera (Olympus). For the observation of the green GFP fluorescence of the biosensor, a 470–490-nm excitation filter and a 520-nm barrier filter were used. For the observation of the red RFP fluorescence of the biosensor, we used a 530–550-nm excitation filter and a 590-nm barrier filter.
For the quantitative analysis of the biosensor fluorescence, the cells were plated in a well of a 96-well plate. The images were then acquired using an Opera QEHS High Content Screening System with a 20× air objective. Four fields were acquired at multiple wavelengths for each well. 4′,6-Diamidino-2-phenylindole (DAPI)-stained nuclei were imaged using a xenon lamp (λex = 365 nm) and a 450/50-nm emission filter. GFP was imaged using a 488 nm laser and a 540/75-nm emission filter. FRET was monitored simultaneously using a 600/40-nm emission filter. RFP was imaged using a 561 nm laser and a 600/40-nm emission filter. A special image analysis protocol was developed using PerkinElmer Life Sciences Acapella 2.0 HCS software (supplemental Fig. S1). DAPI-stained nuclei were detected using the Acapella “nucleus detection B” algorithm. Cell bodies and the cytoplasm were detected using DAPI images and the Acapella “cytoplasm detection A” algorithm. Multiple parameters including cell count per well and well average of cell-by-cell metrics, nucleus area, total intensity of the nuclei, average intensity of the nuclei, nucleus roundness, average cell intensity for GFP and RFP channels, total cell intensity for GFP and RFP channels, average cytoplasm intensity for GFP and RFP channels, and total cytoplasm intensity for GFP and RFP channels were extracted from the nucleus, cytoplasm, and cell masks. An average cell intensity of the GFP and RFP channels and a GFP-RFP intensity ratio were also calculated.
In Vivo Tumorigenicity Assay and Immunohistochemistry
MCF7-MT1, MCF7-L50D, and MCF7-E240A cells (1 × 10⁷ each) were resuspended in 0.1 ml of ice-cold DMEM containing 3 mg/ml Matrigel (BD Biosciences) and injected in the mammary fat pad of athymic female BALB/c nu/nu 4-week-old mice (eight mice/group). Tumor xenograft growth was monitored weekly by caliper measurements of two perpendicular diameters of xenografts (D1 and D2). Tumor volume was calculated by the following formula: π/6(D1 × D2)3/2. In 10 weeks, animals were sacrificed according to the National Institutes of Health guidelines. Tumors were excised free of connective tissue, washed in ice-cold PBS, and cut. Certain tumor portions were fixed overnight in 4% paraformaldehyde, embedded in paraffin, and sectioned. Sections (7 μm) were stained with hematoxylin-eosin (H&E). In addition, tumor portions were freeze molded in Optimum Cutting Temperature (OCT) compound (Sakura Finetek USA, Torrance, CA) and freeze sectioned. The sections (>10 μm) were stained with the primary antibodies followed by the species-specific secondary antibodies conjugated with green Alexa Fluor 488 or red Alexa Fluor 594 (Molecular Probes). Nuclear DNA was stained with DAPI. The H&E slides were scanned using a ScanScope microscope slide scanner. The fluorescence images were acquired using an Olympus BX51 fluorescence microscope with an attached MagnaFire camera (Olympus).
Additionally, a portion of tumor xenografts was extracted in 20 mm Tris-HCl, 150 mm NaCl, 1% deoxycholate, 1% IGEPAL, pH 7.4 supplemented with protease inhibitor mixture set III, 1 mm phenylmethylsulfonyl fluoride, and 10 mm EDTA. The solubilized material was separated from the pellet by centrifugation at 14,000 × g for 30 min. The protein concentration was then equalized among the extracts (1 mg/ml). Aliquots of supernatants (10 μg of total protein each) were separated using gradient 4–12% Bis-Tris acrylamide gels (Invitrogen) and analyzed by Western blotting with the Ki-67 and V5 antibodies. To determine the status of MMP-2, the samples were also analyzed by gelatin zymography using 0.1% gelatin, 10% acrylamide gels. The purified MMP-2 proenzyme was used as a control.
Genome-wide Transcriptional Profiling of Cultured Cells and Xenograft Tumors
Total RNA was extracted from cultured cells and xenograft tumors using TRIzol reagent and purified using the RNeasy columns (Qiagen). The RNA purity was estimated by measuring the A260/280 and the A260/230 ratios. The integrity of the RNA samples was validated using an Experion automated electrophoresis system (Bio-Rad). The samples were processed further by the Microarrays-QPCR Core facility at the Sanford-Burnham Medical Research Institute. The samples of total RNAs (500 ng) were labeled using an Illumina RNA Amplification kit (Ambion). The obtained labeled copy RNA samples (1,500 ng) were hybridized 18 h at 58 °C to a HumanHT-12 v4 Expression BeadChip Array (Illumina) according to the manufacturer's instructions. The array targets more than 47,000 probes derived from the National Center for Biotechnology Information Reference Sequence (NCBI) RefSeq Release 38 (November 7, 2009) and other sources. BeadChips were then washed and developed using FluoroLink streptavidin-Cy3 (GE Healthcare). BeadChips were scanned using an Illumina Bead Array Reader. The raw data were processed using Feature Extraction software version 10.5. The initial analysis and normalization to the median were performed using GeneSpring GX software (Agilent). Differentially expressed mRNAs with signal intensities higher than 2-fold over the background standard deviation were filtered by t test with p < 0.05. Only the statistically significant data (p < 0.05) were used to calculate gene expression ratios in the samples. The individual genes with a 2-fold difference in their expression levels were analyzed using Ingenuity software IPA 9.0 (Ingenuity Systems) and NextBio knowledge databases to determine the regulatory and signaling pathways. The gene expression data have been deposited in the Gene Expression Omnibus (GEO) database under accession number GSE28655.
In addition, the expression levels of MT1-MMP and Ki-67 were examined in the cells and tumors by RT-PCR. The forward and reverse primers for the amplification of MT1-MMP were 5′-GCCATGCAGAAGTTTTACGG-3′ and 5′-CTTGGGGGTGTAATTCTGGA-3′, respectively. The forward and reverse primers for Ki-67 were 5′-CCACACTGTGTCGTCGTTTG-3′ and 5′-CCGTGCGCTTATCCATTCA-3′, respectively. Human glyceraldehyde-3-phosphate dehydrogenase (GAPDH)-specific primers were used as a control. RT-PCR analysis was performed using the OneStep RT-PCR system (Qiagen). The 25-μl reactions each included total RNA (100 ng) and the respective primers (0.6 μm). After the completion of the first strand synthesis, RT-PCRs (30 cycles) were performed using denaturation at 95 °C for 30 s, annealing at 55 °C for 30 s, and elongation at 72 °C for 1 min. The products were separated using 2% agarose gel electrophoresis.
RESULTS
MT1-MMP in Cancer Cells
Earlier studies by us and others have revealed that enforced expression of MT1-MMP leads to its multiple, cell surface forms (26–28). These forms of MT1-MMP include the 63-kDa proenzyme, 54-kDa enzyme, and 39–45-kDa degradation products. Autoproteolysis releases the N-terminal catalytic domain portion of MT1-MMP from the cell surface. The residual C-terminal 39–45-kDa fragments represent the membrane-tethered, catalytically inactive, degraded MT1-MMP (27).
In the study reported here, we used MCF7-MT1, MCF7-L50D (the prodomain mutant with the inactivated intradomain cleavage site) (20), and MCF7-E240A cells, which expressed catalytically inactive MT1-MMP with the mutated active site Glu240 (26). The MT1-MMP constructs were tagged with a C-terminal V5 tag. To measure the levels of cellular MT1-MMP, the cells were surface-labeled using membrane-impermeable biotin. The cell surface biotin-labeled proteins were then isolated from the cell lysates using streptavidin beads. The biotin-labeled cell surface proteins were analyzed by Western blotting with the V5 antibody (Fig. 1).
FIGURE 1.
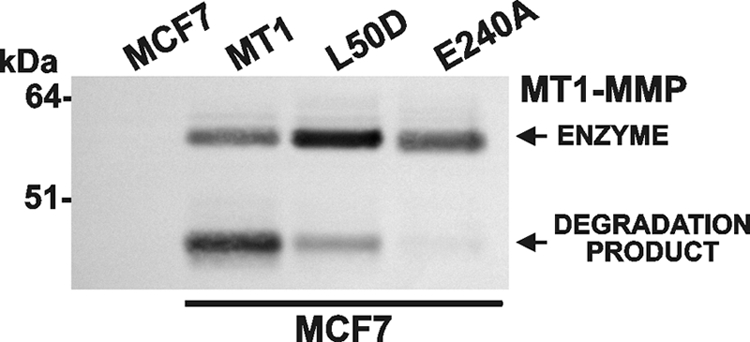
MT1-MMP cell surface forms. The MCF7-MT1, MCF7-L50D, MCF7-E240A, and original MCF7 cells were surface-biotinylated and then lysed. Biotin-labeled proteins were isolated from the lysate aliquots (1 mg/ml total protein each) using streptavidin beads. Biotin-labeled cell surface proteins were analyzed by Western blotting with the V5 antibody to detect the MT1-MMP-V5 constructs.
Consistent with the previous observations by us and others, both the 54-kDa enzyme and degraded species of MT1-MMP were detected in the cell surface samples. Minor levels of the degraded MT1-MMP species were observed in the MCF7-L50D cell surface samples. In MCF7-L50D cells, MT1-MMP autoproteolysis was repressed, and as a result, the levels of the 54-kDa MT1-MMP enzyme on the cell surface were increased. Autoproteolysis leading to degraded MT1-MMP was not recorded in MCF7-E240A cells (Fig. 1).
Intradomain Cleavage of MT1-MMP Prodomain in Cancer Cells
To corroborate the role of the PGD↓L50 cleavage in the processing of the prodomain, we constructed the prodomain-based fluorescent biosensor red fluorescent protein-prodomain-green fluorescent protein (RFP-PRO-GFP). This biosensor includes the signal peptide of MT1-MMP followed by RFP (red), the prodomain, GFP (green), the transmembrane domain, and cytoplasmic tail of MT1-MMP (Fig. 2A). To prevent the cleavage of the biosensor by furin, the furin cleavage site was not included in the construct.
FIGURE 2.

RFP-PRO-GFP biosensor is cleaved in cancer cells. A, the prodomain-based RFP-PRO-GFP and mutant RFP-L50D-GFP fluorescent biosensors were expressed in HT1080, MCF7, and MDA-MB-435 cells. The biosensor structure is shown at the top. Red fluorescence alone indicates the intact biosensor. If the biosensor is cleaved, the green fluorescence is merged with the red fluorescence, resulting in an orange-yellow color. Nuclei are DAPI-stained. S, signal peptide; CT, cytoplasmic tail; TM, transmembrane domain. B, the RFP-PRO-GFP biosensor is cleaved in the Golgi compartment in HT1080 cells. The Golgi was stained using a Golgin-97 antibody followed by the secondary Alexa Fluor 350-conjugated antibody.
Because of the additional absorption peak (λabs = 503 nm) of the RFP spectra (25), the emission of GFP (λem = 507 nm) is greatly reduced in the intact biosensor. Following the prodomain cleavage and RFP dissociation, the green GFP fluorescence becomes readily visible. The analysis of the fluorescence spectra of the individual GFP (λex = 488 nm; λem = 507 nm) and RFP domains (λex = 584 nm; λem = 607 nm) clearly indicated that both fluorescent moieties were properly folded in the intact biosensor and that they functioned normally and as expected (supplemental Fig. S1). We also analyzed the trafficking to and the presentation of the biosensor at the cell surface. For this purpose, HT1080 cells expressing the RFP-PRO-GFP construct were cell surface-biotinylated. Biotin-labeled proteins were pulled down using streptavidin beads. The pulldown results demonstrated that both the intact full-length and the cleaved biosensor species were presented at the cell surface. Both forms of the biosensor were also detected in the total cell lysate. The band intensity clearly indicated that the cleavage of the biosensor takes place primarily inside the cell rather than at the cell surface (supplemental Fig. S1).
In addition, we constructed the RFP-L50D-GFP mutant biosensor that was resistant to cleavage by MMPs including MT1-MMP (Fig. 2). In HT1080, MCF7, and MDA-MB-435 cancer cells, the RFP-PRO-GFP biosensor was readily processed in the Golgi compartment. Because several individual MMPs rather than MT1-MMP alone can contribute to the PGD↓L50 intradomain cleavage (20) and because MCF7 cells synthesize at least several individual MMPs including MT2-MMP, MT3-MMP, MT4-MMP, and MT6-MMP (29), it is not surprising that the RFP-PRO-GFP biosensor was cleaved in these cells. In turn, the RFP-L50D-GFP mutant biosensor remained unprocessed, leading to red fluorescence alone in the cells. These data confirmed the importance of the PGD↓L50 cleavage in the initiation of the prodomain degradation. Our results clearly demonstrate that this cleavage takes place intracellularly and in the course of the secretion pathway of the MT1-MMP prodomain mimic and that this cleavage is independent of and additional to furin cleavage of the prodomain.
Physiological Significance of Intradomain Cleavage
There is a consensus among scientists that MT1-MMP activity is essential for tumor growth in vivo. To assess the importance of the intradomain processing of the prodomain in the tumorigenic program of MT1-MMP in vivo, MCF7-MT1, MCF7-L50D, and MCF7-E240A cells were orthotopically xenografted into immunodeficient mice (Fig. 3A). The size of the developing tumors was measured at 1-week intervals for 10 weeks. Following a 4-week lag period, MCF7-MT1 xenografts acquired a growth rate that far exceeded that of the MCF7-L50D tumors. The MCF7-L50D cells formed small tumors that reached a ∼25-mm3 volume at week 4 and then ceased growing. At week 10 postimplantation, there was a 20-fold size difference between MCF7-MT1 tumors and MCF7-L50D tumors (Fig. 3B). MCF7-E240A cells did not form detectable tumors.
FIGURE 3.

Tumorigenicity of MCF7-MT1, MCF7-L50D, and MCF7-E240A cells. Xenografts were induced by injection of cells in the mammary fat pad of nude mice. A, mice 10 weeks postinjection. Arrows point to the tumors. B, tumor growth in mice. Tumor size is expressed as mean tumor volume ±S.D. (error bars). C, H&E staining of tumor sections. White arrows, tumor stroma; black arrows, infiltrating immune cells; yellow arrows, mammary epithelial cells; red arrows, blood capillaries. MMTV-PyMT, murine mammary tumor virus-polyoma virus middle T-antigen.
Histological analysis of tissue sections stained with H&E demonstrated the presence of the undifferentiated dense cancerous tissue with inflammatory lymphocyte infiltration and desmoplastic reaction resulting in tumor stroma in MCF7-MT1 tumors (Fig. 3C). In turn, the acinus-like structures of the clustered cancerous cells were observed in MCF7-L50D tumors. There was no detectable cancerous tissue at the fat pad inoculation site in MCF7-E240A xenografts. Overall, MCF7-MT1 tumors appear to be comparable with the murine mammary tumor virus-polyoma virus middle T-antigen-induced, spontaneous, fast growing mammary tumors in mice (30). Murine mammary tumor virus-polyoma virus middle T-antigen tumors also show high tumor cell density and inflammatory lymphocyte infiltration (31), and they also express high levels of MT1-MMP activity (10).
Immunostaining of tumor sections with the V5 antibody confirmed the presence of high levels of MT1-MMP immunoreactivity in both the MCF7-MT1 and the MCF7-L50D xenografts (Fig. 4). Immunostaining with the type I collagen antibody corroborated the presence of the dense collagen bundles within the MCF7-MT1 tumor stroma. Similar bundles were absent in the MCF7-L50D xenografts. Notably, type I collagen, a substrate for the MT1-MMP collagenolytic activity, largely accumulated at a distance from the MT1-MMP-expressing cancer cells in the tumor stroma, which is formed by the infiltrating host (murine) connective tissue cells.
FIGURE 4.

Immunostaining of tumor xenografts. Immunostaining of the MCF7-MT1 and MCF7-L50D frozen tumor sections using the V5 (MT1-MMP), Ki-67, and type I collagen (Col1A) antibodies is shown. Nuclei are DAPI-stained.
A high growth rate of MCF7-MT1 xenografts correlated with the high nuclear Ki-67 immunoreactivity, a marker for cell proliferation. In contrast, reduced levels of the Ki-67 immunoreactivity were observed in MCF7-L50D tumors. As detected by Western blotting, the enhanced Ki-67 immunoreactivity correlated with the high expression of Ki-67 in MCF7-MT1 tumors (Fig. 5A). In turn, the levels of Ki-67 in MCF7-L50D tumors were significantly lower compared with those observed in the cultured cells including MCF7-L50D, MCF7-MT1, MCF7-E240A, and original MCF7 cells.
FIGURE 5.

Characterization of MCF7-L50D cells and tumors. A, Western blotting of cell and tumor extracts with a Ki-67 antibody. An equal amount of total protein (50 μg) was loaded for each sample we analyzed. B, gelatin zymography of MMP-2 and Western blotting of the tumor extract samples with the V5 antibody (top and bottom panel, respectively). ProMMP-2, proMMP-2 alone; no extract. * indicates the extract of the inoculation site tissue because MCF7-E240 tumors did not emerge in mice. MMTV-PyMT, murine mammary tumor virus-polyoma virus middle T-antigen.
To corroborate the repression of cell proliferation/cell cycle events in MCF7-L50D xenografts, we performed genome-wide transcriptional profiling of xenograft tumors and corresponding cultured cells (supplemental Table S1). Tumor tissue predominantly free from the contaminating host tissue (as judged by H&E staining) was used for the transcriptional profiling.
To identify the affected regulatory pathways, the gene profiling results were analyzed further using Ingenuity software. A subset of these results is shown in Fig. 6A. The analysis clearly indicated that as compared with MCF7-L50D cultured cells the genes involved in the regulation of cell cycle were repressed the most significantly in MCF7-L50D tumor xenografts relative to other pathways. Thus, a total of 71 cell cycle-related genes were affected in all of the cell and tumor samples combined. From these 71 genes, 49 genes (69%) were affected in MCF7-L50D tumor as compared with MCF7-L50D cells (Fig. 6B and supplemental Table S2). From these 49 affected genes, 33 genes (67%) were down-regulated. The top 20 down-regulated cell cycle-related genes are shown in Table 2.
FIGURE 6.

Genome-wide transcriptional profiling of MCF7 xenograft tumors and cultured cells. A, an Ingenuity analysis of the genome-wide transcriptional profiling of the MCF7-L50D cultured cells and tumor xenografts. The line indicates a threshold value. B, cell cycle-related genes, the expression of which was affected in the tumor and cell samples. The number of affected genes is shown above each bar. The compared samples are indicated below the bars. C, RT-PCR of MT1-MMP, Ki-67, and GAPDH (control) in MCF7 cell and tumor xenograft samples. D, Ingenuity network analysis of differentially expressed cell cycle-related genes in MCF7-L50D tumors versus MCF7-L50D cultured cells. Up-regulated and down-regulated genes are shown in red and green, respectively. Genes that are not user-specified but are incorporated into the network through their relationship with other genes are shown in white. Continuous and discontinuous lines represent direct and indirect functional and physical interaction between genes from the literature.
TABLE 2.
Top 20 cell cycle-associated genes that are down-regulated in MCF7-L50D tumors compared with MCF7-L50D cells
A comparison of other tumors and respective cultured cells is also shown. A minus sign indicates down-regulation. Only a 2-fold difference or higher is shown.
| Gene | L50D tumor vs. L50D cells | MT1 tumor vs. MT1 cells | L50D cells vs. MT1 cells | MT1 cells vs. MCF7 cells | L50D cells vs. MCF7 cells | E240A cells vs. MCF7 cells |
|---|---|---|---|---|---|---|
| CENPA | −3.8 | |||||
| CCNB2 | −3.7 | −2.1 | ||||
| KIF20A | −3.7 | 2 | ||||
| FAM83D | −3.7 | |||||
| NUSAP1 | −3.5 | |||||
| UBB | −3.3 | −3 | 2.6 | 3.7 | 4.1 | |
| CCNA2 | −3.3 | |||||
| CDKN3 | −3.1 | −2.1 | 2 | |||
| NDC80 | −3.1 | 2.1 | ||||
| CDC25C | −3 | |||||
| TUBA1A | −2.9 | −3.2 | ||||
| MAD2L1 | −2.9 | |||||
| CDC20 | −2.7 | |||||
| CCNB1 | −2.6 | 2.1 | ||||
| CCDC5 | −2.6 | |||||
| PSMA4 | −2.6 | |||||
| RRM2 | −2.5 | −3 | ||||
| LOC643668 | −2.5 | −2.3 | ||||
| ASPM | −2.5 | |||||
| CCDC99 | −2.4 |
The RT-PCR results also demonstrated low levels of Ki-67 in MCF7-L50D tumors relative to the MCF7-L50D cells. MT1-MMP and GAPDH were used as controls in these RT-PCR experiments (Fig. 6C). Further analysis of the differentially expressed genes using Ingenuity software readily identified the cell cycle network as the primary gene network affected in MCF7-L50D tumors relative to the MCF7-L50D cells (Fig. 6D).
The down-regulation of cell cycle genes explains both the reduced Ki-67 immunoreactivity and slow growth of MCF7-L50D tumors. The repression of cell cycle genes was less prominent in MCF7-MT1 tumors as compared with MCF7-MT1 cells. The cell cycle genes were not significantly affected in the other cell samples we analyzed (Fig. 6B). There was also an up-regulation of 11 and nine apoptosis genes in MCF7-L50D and MCF7-MT1 xenograft tumors, respectively, as compared with the corresponding cells (Table 3).
TABLE 3.
Apoptosis genes that are affected in xenograft tumors compared with cultured cells
A minus sign indicates down-regulation. Only a 2-fold difference or higher is shown.
| Gene | L50D tumor vs. L50D cells | MT1 tumor vs. MT1 cells |
|---|---|---|
| IER3 | 11.9 | 2.9 |
| BNIPL | 3.5 | 3.2 |
| TNFSF14 | 3.3 | 2.8 |
| TNFRSF25 | 3.2 | 3.1 |
| CGB8 | 2.7 | 3.6 |
| CGB5 | 2.4 | 3.5 |
| NISCH | 2.4 | |
| BIRC3 | 2.4 | 3 |
| MX1 | 2.2 | 2.2 |
| SYCP2 | 2.2 | |
| PDCD7 | 2.2 | 2.8 |
| FASTK | −2.1 | |
| TPX2 | −3.4 |
Because the presence of the cellular MT1-MMP activity is critical for the activation of MMP-2, gelatin zymography was performed to identify the status of MMP-2 in tumors (Fig. 5C). The latent MMP-2 proenzyme alone was detected in the extracts of the normal mammary fat pad tissue and MCF7-E240A xenografts. In MCF7-L50D tumors, MMP-2 was largely represented by the proenzyme. In turn, MCF7-MT1 and murine mammary tumor virus-polyoma virus middle T-antigen tumors exhibited high levels of the active enzyme of MMP-2 and also minor, residual levels of the MMP-2 proenzyme. According to the Western blotting analysis of the tumor extracts, the V5-tagged proenzyme and the enzyme of MT1-MMP were observed in MCF7-MT1 xenografts. Importantly, comparable levels of the MT1-MMP enzyme alone were present in MCF7-MT1 and MCF7-L50D tumors. These observations are consistent with the presence of the functionally inert MT1-MMP enzyme that remained inhibited by its non-covalently associated, intact prodomain in MCF7-L50D tumors. Overall, our data suggest that the PGD↓L50 site cleavage of the prodomain is required for the functional, protumorigenic activity of MT1-MMP in the orthotopic MCF7 tumor xenografts in mice.
DISCUSSION
The protumorigenic MT1-MMP activity stimulates cell migration and invasion, usurps tumor growth control, and contributes to malignant transformation and incipient cancer (32, 33). MT1-MMP is synthesized as a latent proenzyme. For the active enzyme to emerge, the MT1-MMP proenzyme requires proteolytic removal of the N-terminal inhibitory prodomain. Cleavage of the R108RKR111↓Y112 motif by furin plays a vital role in the prodomain removal (17, 34). However, the intact prodomain released by furin cleavage alone retains its inhibitory capacity and remains non-covalently associated with the emerging enzyme (19, 20). To inactivate the excised inhibitory prodomain and to liberate the processed active enzyme species from inhibition by the prodomain, MT1-MMP adopted a stepwise mechanism.
The first step of the stepwise activation of MT1-MMP involves the intracellular processing of the PGD↓L50 sequence of the prodomain bait region (19, 20). This cleavage destroys the prodomain structure, generates the activation intermediate, and initiates the further intradomain cleavages. The remaining C-terminal portion of the prodomain is then removed by furin. These events when combined result in the active MT1-MMP enzyme. The insertion of the MCF7-L50D mutation inactivates the PGD↓L50 cleavage site in the prodomain. As a result, the intact, full-length mutant prodomain liberated by the furin cleavage alone functions as an inhibitor of the emerging MT1-MMP enzyme.
Our current experimental results directly support this hypothesis. Thus, the cellular wild-type MT1-MMP, but not the inert E240A mutant and the L50D prodomain mutant, underwent the extensive intracellular self-proteolysis in MCF7 cells. Our experiments using the RFP- and GFP-tagged fluorescent biosensors also clearly demonstrated the prodomain cleavage in mammary carcinoma MCF7 and MDA-MB-435/melanoma M14 cells (23) and fibrosarcoma HT1080 cancer cells.
Our tumor xenograft studies in mice that used MCF7 cells with enforced expression of the wild-type MT1-MMP and the L50D and E240 mutant constructs directly confirmed this suggestion. Although the expression of the wild-type MT1-MMP in MCF7 cells resulted in rapidly proliferating cancer cells and seemed to usurp tumor growth control, the L50D mutation in the prodomain did not efficiently support MCF7 cell proliferation and as a result inactivated the tumorigenic potential of the proteinase to levels that were comparable with the catalytically inactive E240A MT1-MMP mutant. These data correlate well with our earlier findings that MCF7 cells can be made more tumorigenic if MT1-MMP expression is increased (35, 36).
The immunostaining and biochemical analyses confirmed that MCF7-L50D cells expressed the MT1-MMP mutant enzyme in tumors. In contrast with the wild-type MT1-MMP, the L50D enzyme could not activate MMP-2, an activation target of MT1-MMP. We conclude that because of its inhibitory complex with the non-covalently associated, intact prodomain (excised by furin cleavage alone), the L50D mutant was largely functionally inactive in MCF7 cells.
Obviously, the multistep activation mechanism requires the action of at least two distinct proteinases rather than a single proteinase. This mechanism leads to both inactivation and then release of the inhibitory prodomain, thereby making the catalytic domain of the emerging enzyme available for proteolytic activity. It is highly likely that the multistep activation mechanism is not unique for MT1-MMP alone, but instead, this multistep activation leading to the prodomain degradation is common for the membrane type MMP subfamily and also for other members of the MMP family (19, 20).
Overall, tumor cells appear to uniformly exploit a multistep mechanism that leads to the complete inactivation of the autoinhibitory prodomain of MT1-MMP. The existence of this multistep mechanism is linked to the general increase of the proteolytic activity in cancer. The execution of this mechanism greatly increases the overall proteolytic arsenal of malignant cells.
Supplementary Material
Acknowledgments
We thank Dr. Krissa Gibby (Sanford-Burnham Medical Research Institute) for providing us with the murine mammary tumor virus-polyoma virus middle T-antigen breast tumor samples and Drs. Susanne Heynen-Genel, Loribelle Milan, and Santosh Hariharan (Conrad Prebys Center for Chemical Genomics, Sanford-Burnham Medical Research Institute) for help with our biosensor studies.
This work was supported, in whole or in part, by National Institutes of Health Grants CA83017 and CA77470 (to A. Y. S.).

The on-line version of this article (available at http://www.jbc.org) contains supplemental Fig. S1 and Tables S1 and S2.
- MMP
- matrix metalloproteinase
- MT-MMP
- membrane type matrix metalloproteinase
- PRO
- prodomain
- RFP
- monomeric red fluorescent protein 1
- Bis-Tris
- 2-[bis(2-hydroxyethyl)amino]-2-(hydroxymethyl)propane-1,3-diol.
REFERENCES
- 1. Friedl P., Wolf K. (2009) Cancer Metastasis Rev. 28, 129–135 [DOI] [PubMed] [Google Scholar]
- 2. Egeblad M., Nakasone E. S., Werb Z. (2010) Dev. Cell 18, 884–901 [DOI] [PMC free article] [PubMed] [Google Scholar]
- 3. Murphy G., Nagase H. (2011) FEBS J. 278, 2–15 [DOI] [PMC free article] [PubMed] [Google Scholar]
- 4. Rowe R. G., Weiss S. J. (2009) Annu. Rev. Cell Dev. Biol. 25, 567–595 [DOI] [PubMed] [Google Scholar]
- 5. Egeblad M., Werb Z. (2002) Nat. Rev. Cancer 2, 161–174 [DOI] [PubMed] [Google Scholar]
- 6. Nagase H., Visse R., Murphy G. (2006) Cardiovasc. Res. 69, 562–573 [DOI] [PubMed] [Google Scholar]
- 7. Sohail A., Sun Q., Zhao H., Bernardo M. M., Cho J. A., Fridman R. (2008) Cancer Metastasis Rev. 27, 289–302 [DOI] [PMC free article] [PubMed] [Google Scholar]
- 8. Sabeh F., Shimizu-Hirota R., Weiss S. J. (2009) J. Cell Biol. 185, 11–19 [DOI] [PMC free article] [PubMed] [Google Scholar]
- 9. Ota I., Li X. Y., Hu Y., Weiss S. J. (2009) Proc. Natl. Acad. Sci. U.S.A. 106, 20318–20323 [DOI] [PMC free article] [PubMed] [Google Scholar]
- 10. Szabova L., Chrysovergis K., Yamada S. S., Holmbeck K. (2008) Oncogene 27, 3274–3281 [DOI] [PubMed] [Google Scholar]
- 11. Seiki M. (2003) Cancer Lett. 194, 1–11 [DOI] [PubMed] [Google Scholar]
- 12. Hotary K. B., Allen E. D., Brooks P. C., Datta N. S., Long M. W., Weiss S. J. (2003) Cell 114, 33–45 [DOI] [PubMed] [Google Scholar]
- 13. Strongin A. Y., Collier I., Bannikov G., Marmer B. L., Grant G. A., Goldberg G. I. (1995) J. Biol. Chem. 270, 5331–5338 [DOI] [PubMed] [Google Scholar]
- 14. Strongin A. Y. (2010) Biochim. Biophys. Acta 1803, 133–141 [DOI] [PMC free article] [PubMed] [Google Scholar]
- 15. Rowe R. G., Weiss S. J. (2008) Trends Cell Biol. 18, 560–574 [DOI] [PubMed] [Google Scholar]
- 16. Nagase H., Woessner J. F., Jr. (1999) J. Biol. Chem. 274, 21491–21494 [DOI] [PubMed] [Google Scholar]
- 17. Pei D., Weiss S. J. (1995) Nature 375, 244–247 [DOI] [PubMed] [Google Scholar]
- 18. Seidah N. G., Mayer G., Zaid A., Rousselet E., Nassoury N., Poirier S., Essalmani R., Prat A. (2008) Int. J. Biochem. Cell Biol. 40, 1111–1125 [DOI] [PubMed] [Google Scholar]
- 19. Golubkov V. S., Chekanov A. V., Shiryaev S. A., Aleshin A. E., Ratnikov B. I., Gawlik K., Radichev I., Motamedchaboki K., Smith J. W., Strongin A. Y. (2007) J. Biol. Chem. 282, 36283–36291 [DOI] [PubMed] [Google Scholar]
- 20. Golubkov V. S., Cieplak P., Chekanov A. V., Ratnikov B. I., Aleshin A. E., Golubkova N. V., Postnova T. I., Radichev I. A., Rozanov D. V., Zhu W., Motamedchaboki K., Strongin A. Y. (2010) J. Biol. Chem. 285, 27726–27736 [DOI] [PMC free article] [PubMed] [Google Scholar]
- 21. Pei D., Weiss S. J. (1996) J. Biol. Chem. 271, 9135–9140 [DOI] [PubMed] [Google Scholar]
- 22. Sato H., Takino T., Okada Y., Cao J., Shinagawa A., Yamamoto E., Seiki M. (1994) Nature 370, 61–65 [DOI] [PubMed] [Google Scholar]
- 23. Chambers A. F. (2009) Cancer Res. 69, 5292–5293 [DOI] [PubMed] [Google Scholar]
- 24. Golubkov V. S., Chekanov A. V., Cieplak P., Aleshin A. E., Chernov A. V., Zhu W., Radichev I. A., Zhang D., Dong P. D., Strongin A. Y. (2010) J. Biol. Chem. 285, 35740–35749 [DOI] [PMC free article] [PubMed] [Google Scholar]
- 25. Campbell R. E., Tour O., Palmer A. E., Steinbach P. A., Baird G. S., Zacharias D. A., Tsien R. Y. (2002) Proc. Natl. Acad. Sci. U.S.A. 99, 7877–7882 [DOI] [PMC free article] [PubMed] [Google Scholar]
- 26. Rozanov D. V., Deryugina E. I., Ratnikov B. I., Monosov E. Z., Marchenko G. N., Quigley J. P., Strongin A. Y. (2001) J. Biol. Chem. 276, 25705–25714 [DOI] [PubMed] [Google Scholar]
- 27. Hernandez-Barrantes S., Toth M., Bernardo M. M., Yurkova M., Gervasi D. C., Raz Y., Sang Q. A., Fridman R. (2000) J. Biol. Chem. 275, 12080–12089 [DOI] [PubMed] [Google Scholar]
- 28. Remacle A. G., Chekanov A. V., Golubkov V. S., Savinov A. Y., Rozanov D. V., Strongin A. Y. (2006) J. Biol. Chem. 281, 16897–16905 [DOI] [PubMed] [Google Scholar]
- 29. Chernov A. V., Baranovskaya S., Golubkov V. S., Wakeman D. R., Snyder E. Y., Williams R., Strongin A. Y. (2010) J. Biol. Chem. 285, 19647–19659 [DOI] [PMC free article] [PubMed] [Google Scholar]
- 30. Fantozzi A., Christofori G. (2006) Breast Cancer Res. 8, 212 [DOI] [PMC free article] [PubMed] [Google Scholar]
- 31. Grum-Schwensen B., Klingelhöfer J., Grigorian M., Almholt K., Nielsen B. S., Lukanidin E., Ambartsumian N. (2010) Cancer Res. 70, 936–947 [DOI] [PubMed] [Google Scholar]
- 32. Soulié P., Carrozzino F., Pepper M. S., Strongin A. Y., Poupon M. F., Montesano R. (2005) Oncogene 24, 1689–1697 [DOI] [PubMed] [Google Scholar]
- 33. Golubkov V. S., Chekanov A. V., Savinov A. Y., Rozanov D. V., Golubkova N. V., Strongin A. Y. (2006) Cancer Res. 66, 10460–10465 [DOI] [PubMed] [Google Scholar]
- 34. Thomas G. (2002) Nat. Rev. Mol. Cell Biol. 3, 753–766 [DOI] [PMC free article] [PubMed] [Google Scholar]
- 35. Deryugina E. I., Ratnikov B., Monosov E., Postnova T. I., DiScipio R., Smith J. W., Strongin A. Y. (2001) Exp. Cell Res. 263, 209–223 [DOI] [PubMed] [Google Scholar]
- 36. D'Alessio S., Ferrari G., Cinnante K., Scheerer W., Galloway A. C., Roses D. F., Rozanov D. V., Remacle A. G., Oh E. S., Shiryaev S. A., Strongin A. Y., Pintucci G., Mignatti P. (2008) J. Biol. Chem. 283, 87–99 [DOI] [PubMed] [Google Scholar]
Associated Data
This section collects any data citations, data availability statements, or supplementary materials included in this article.