Abstract
Cellular and mitochondrial metabolite levels were measured in yeast TCA cycle mutants (sdh2Δ or fum1Δ) lacking succinate dehydrogenase or fumarase activities. Cellular levels of succinate relative to parental strain levels were found to be elevated ∼8-fold in the sdh2Δ mutant and ∼4-fold in the fum1Δ mutant, and there was a preferential increase in mitochondrial levels in these mutant strains. The sdh2Δ and fum1Δ strains also exhibited 3–4-fold increases in expression of Cit2, the cytosolic form of citrate synthase that functions in the glyoxylate pathway. Co-disruption of the SFC1 gene encoding the mitochondrial succinate/fumarate transporter resulted in higher relative mitochondrial levels of succinate and in substantial reductions of Cit2 expression in sdh2Δsfc1Δ and fum1Δsfc1Δ strains as compared with sdh2Δ and fum1Δ strains, suggesting that aberrant transport of succinate out of mitochondria mediated by Sfc1 is related to the increased expression of Cit2 in sdh2Δ and fum1Δ strains. A defect (rtg1Δ) in the yeast retrograde response pathway, which controls expression of several mitochondrial proteins and Cit2, eliminated expression of Cit2 and reduced expression of NAD-specific isocitrate dehydrogenase (Idh) and aconitase (Aco1) in parental, sdh2Δ, and fum1Δ strains. Concomitantly, co-disruption of the RTG1 gene reduced the cellular levels of succinate in the sdh2Δ and fum1Δ strains, of fumarate in the fum1Δ strain, and citrate in an idhΔ strain. Thus, the retrograde response is necessary for maintenance of normal flux through the TCA and glyoxylate cycles in the parental strain and for metabolite accumulation in TCA cycle mutants.
Keywords: Metabolism, Metabolomics, Mitochondrial Transport, Yeast Genetics, Yeast Metabolism, Fumarase, Succinate Dehydrogenase
Introduction
Intermediates of the tricarboxylic (TCA)2 cycle are believed to be present in relatively low concentrations in mitochondria of actively respiring eukaryotic cells due to rapid flux through the cycle and to alternative biosynthetic uses for many of the intermediates. Flux through the cycle thus requires anaplerotic enzymes (e.g. pyruvate carboxylase to produce oxaloacetate) or pathways (e.g. the glyoxylate pathway in yeast that produces succinate) to replenish these intermediates. Defects in a TCA cycle enzyme would be expected to result in increased mitochondrial and/or cellular concentrations of the substrate of that enzyme.
We and others (1–4) have been analyzing effects of disruptions of genes encoding TCA cycle enzymes in the yeast Saccharomyces cerevisiae. These gene disruptions are not lethal because yeast cells can survive without mitochondrial functions. However, the disruptions have quite distinct effects depending on loss of particular enzymes (5). We initiated studies of changes in metabolite profiles associated with loss of yeast TCA cycle enzymes. In a previous report (2), we described that citrate, a relatively abundant metabolite in the parental strain, accumulates to very high cellular levels in a mutant (idhΔ) lacking both Idh1 and Idh2 subunits of NAD-specific isocitrate dehydrogenase and in a mutant (aco1Δ) lacking aconitase. In addition to sharing similar gene and protein expression patterns (1, 2), these mutants exhibit similar growth phenotypes including, relative to the parental strain, an inability to grow with acetate as the carbon source and a significant increase in respiratory deficient progeny during cultivation. We found that the high cellular levels of citrate in the idhΔ and aco1Δ mutants could be reduced by co-disruption of the gene encoding mitochondrial citrate synthase (CIT1). Also, the shared patterns of gene/protein expression and unusual growth properties of idhΔ and aco1Δ mutants were eliminated or moderated toward parental strain characteristics in idhΔcit1Δ and aco1Δcit1Δ mutants. Thus, excess cellular levels of citrate affect a variety of processes in yeast cells.
The current study focuses on effects of a substantial increase in cellular succinate levels in a yeast mutant (sdh2Δ) lacking succinate dehydrogenase activity and in levels of succinate and fumarate in a mutant (fum1Δ) lacking fumarase. We present evidence suggesting that excess cellular levels of succinate in yeast cells, or aberrant transfer of this metabolite across the mitochondrial membrane, may promote changes in protein expression patterns. Also, we show that cellular levels of fumarate in the yeast mutant lacking fumarase, an enzyme localized in both mitochondrial and cytosolic cellular compartments (6), are dramatically elevated primarily outside mitochondria.
Although genetic defects in human TCA cycle enzymes are rare and would likely be embryonic lethal (7), tumor suppressor functions for several TCA cycle enzymes have been identified in recent years. For example, succinate dehydrogenase (SDH) mutations have been associated with tumors of the nervous system (paragangliomas and pheochromocytomas) (8–10) and fumarase (fumarate hydratase, FH) mutations have been linked with uterine, cutaneous, and renal carcinomas (in hereditary leiomyomatosis and renal cell cancer) (11, 12). The accumulation of succinate in SDH- or fumarate in FH-associated disorders has been proposed to be deleterious for various reasons including potential inhibitory effects on prolyl-hydroxylase enzymes (which normally utilize α-ketoglutarate as a cofactor) that regulate degradation of the HIF-1α transcription factor (13, 14). This inhibition could increase cellular levels of HIF-1α, leading to activation of the hypoxia response pathway and increased expression of genes encoding glycolytic enzymes, metabolic events that are often observed in cancer cells (15–17). Although yeast cells lack a homologue of HIF1-α, other effects associated with accumulation of these metabolites in yeast mutants may be relevant to these human disorders.
EXPERIMENTAL PROCEDURES
Strains and Growth Conditions
The parental haploid yeast strain was MMY011 (MATα ade2-1 can1–100 his3–11 leu2–3,112 trp1-1 ura3-1) (18). A diploid yeast strain MMY011/MMY030 (5) was used for mutant strain construction. The SDH2 and FUM1 genes were deleted/disrupted in diploid strains using the kanMX4 cassette (19), and SFC1 or RTG1 genes were subsequently deleted/disrupted in these diploids using loxP cassettes, respectively, carrying the Kluyveromyces lactis LEU2 gene or the Schizosaccharomyces pombe HIS5 gene (the equivalent of the S. cerevisiae HIS3 gene) (20). Diploid strains were subsequently sporulated for tetrad dissection to obtain sdh2Δ, fum1Δ, sfc1Δ, sdh2Δsfc1Δ, fum1Δsfc1Δ, rtg1Δ, sdh2Δrtg1Δ, and fum1Δrtg1Δ haploid strains. Similar methods were used to produce idh2Δ and idh2Δrtg1Δ mutants. All gene disruptions were confirmed by polymerase chain reaction using genomic DNAs as templates. A rhoo mutant of the parental strain was obtained by ethidium bromide treatment as previously described (21).
Yeast strains were cultivated using rich YP medium (1% yeast extract, 2% Bacto-peptone) containing 2% galactose as the carbon source. To assess petite frequencies, cells were cultivated in YP galactose medium to A600 nm ≅ 2.0. Diluted cells were plated on YP glucose agar plates and after 3–4 days of growth at 30 °C, the relative numbers of petite and grande cells were tabulated. The ade2-1 genetic locus in these strains permits distinction of large red grande colonies and small white petite colonies (1).
Metabolite Analyses
Methods for preparation of whole cell extracts and derivatization for metabolite analyses using gas chromatography/mass spectrometry were previously described in detail (2). Briefly, cells were cultured in YP galactose medium to A600 nm ≅ 2.0, and growth was stopped by addition of 100 μg/ml of cycloheximide and 40 mm sodium azide. Cell extracts were prepared by boiling harvested cell pellets in water. This extraction procedure and subsequent derivatization methods were empirically determined to permit reproducible and quantitative analyses of TCA cycle metabolites and related amino acids. Concentrations of denatured proteins in cell extracts were determined using a modified Bradford assay (22) following solubilization of the proteins as previously described (2).
For measurements of mitochondrial metabolites, mitochondrial fractions from cells grown and harvested as described above were obtained as previously described (23). Mitochondrial pellets were lysed, and metabolites and protein concentrations were analyzed as described above for whole cell samples. Proteins in the mitochondrial, post-mitochondrial, and whole cell samples were assessed using immunoblots for mitochondrial and cytosolic marker proteins. Mitochondrial fractions were found to be devoid of cytosolic proteins; however, post-mitochondrial fractions were found to contain some mitochondrial proteins due to some lysis of mitochondria during cellular fractionation. Therefore, we compared only total cellular and mitochondrial concentrations of metabolites.
Immunoblot Analyses
Cell cultures (50 ml) were grown in YP galactose medium to A600 nm = 1.2–2.0. Growth was stopped using cycloheximide and sodium azide as described above. Cells were harvested by centrifugation and washed once. Cell pellets were resuspended in a urea buffer (8.0 m urea, 50 mm sodium phosphate, pH 7.4, 10 mm Tris-HCl, pH 7.4). Following addition of 10 mm phenylmethylsulfonyl fluoride, the pellets were lysed by vortexing with glass beads. The lysates were cleared by centrifugation, and supernatants were removed for use in protein assays (24) or, for electrophoresis, supernatants were diluted 1:2 with 2× Laemmli sample buffer (25) and boiled for 5 min.
Electrophoresis was conducted using 10% polyacrylamide/SDS gels. Immunoblot analyses for yeast proteins were conducted using antisera specific for Cit2 (1:1000, kindly provided by Drs. Mark T. McCammon and Gyula Kispal), Fbp1 (1:500) (26), Act1 (1:1250, Abcam), Idh1 and Idh2 subunits of Idh (1:1000) (27), Aco1 (1:10,000) (28), Mdh1 (1:3600) (29), Mdh2 (1:1500) (30), and Idp1 (1:1000) (31). Immunoreactive proteins were detected by the enhanced chemiluminescent method (Amersham Biosciences) and autoradiography, and were quantified using densitometry. Immunoblots presented in this study are representative of experiments repeated two or three times.
RNA Analyses
RNA was prepared from cells cultivated in 500 ml and used for Northern blot analyses (32). Probes (intragenic 450 and 550 bp from ACT1 and CIT2 genes, respectively) were generated using polymerase chain reaction and labeled with biotin (North2South Biotin Random Prime Labeling Kit, Thermo Scientific). RNAs were detected using chemiluminescence, and levels were compared using ImageJ software.
RESULTS
Succinate Accumulation and Expression of Cit2
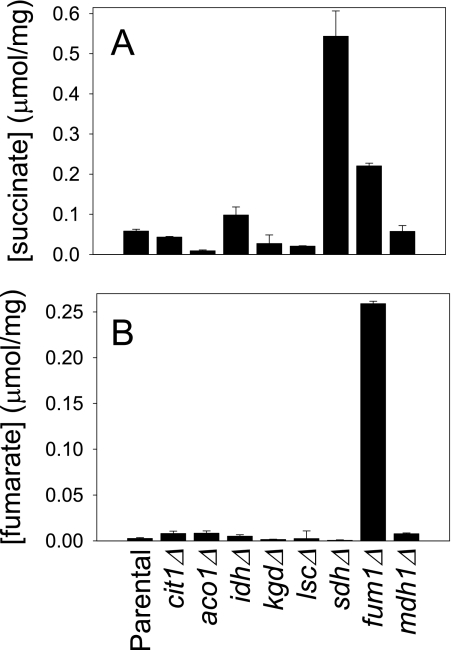
As described above, we previously reported an association between elevated cellular levels of citrate and protein expression patterns/growth phenotypes observed for yeast idhΔ or aco1Δ mutants (1, 2). To ascertain other correlates with metabolite levels, we completed analyses of TCA cycle and related metabolites for a collection of yeast mutants with disruptions in genes encoding all TCA cycle enzymes (1). These mutants were grown with permissive rich YP medium containing galactose, a fermentable carbon source that does not repress expression of mitochondrial proteins. Metabolites were quantified using gas chromatography/mass spectrometry methods as previously described (2). As would be expected, each lesion in the TCA cycle produced an increase in cellular levels of the substrate and, in most cases, a decrease in cellular levels of the product of the missing enzyme (data not shown). Apart from the elevated cellular levels of citrate (to >0.80 μmol/mg of protein) in idhΔ or aco1Δ mutants relative to the parental strain (0.06 μmol/mg of protein) as previously described (2), the metabolite that accumulated to highest cellular levels, as shown in Fig. 1A, was succinate in sdhΔ mutants (to >0.50 μmol/mg of protein) or in a fum1Δ mutant (to ∼0.22 μmol/mg of protein) relative to the parental strain (0.06 μmol/mg of protein). Also, as shown in Fig. 1B, fumarate was elevated in the fum1Δ mutant to levels of ∼0.26 μmol/mg of protein relative to <0.01 μmol/mg of protein in the parental strain. Substrates for missing enzymes in other TCA cycle mutants accumulated to levels <0.01 μmol/mg of protein (α-ketoglutarate and oxaloacetate) or <0.07 μmol/mg of protein (aconitate, isocitrate, and malate) (data not shown).
FIGURE 1.
Succinate and fumarate levels in yeast TCA cycle mutants. Cellular levels of succinate (A) and fumarate (B) in extracts from the indicated yeast strains were determined using GC/MS, as described under “Experimental Procedures.” Data were obtained from duplicate measurements in two independent experiments of mutant strains containing disruptions of genes encoding each protein component of a TCA cycle enzyme. Single genes encode citrate synthase (CIT1), aconitase (ACO1), fumarase (FUM1), and malate dehydrogenase (MDH1). Multiple genes encode subunits of NAD+-specific isocitrate dehydrogenase (IDH1 and IDH2), α-ketoglutarate dehydrogenase (KGD1, KGD2, and LPD1), succinyl-CoA ligase (LSC1 and LSC2), and succinate dehydrogenase (SDH1–4).
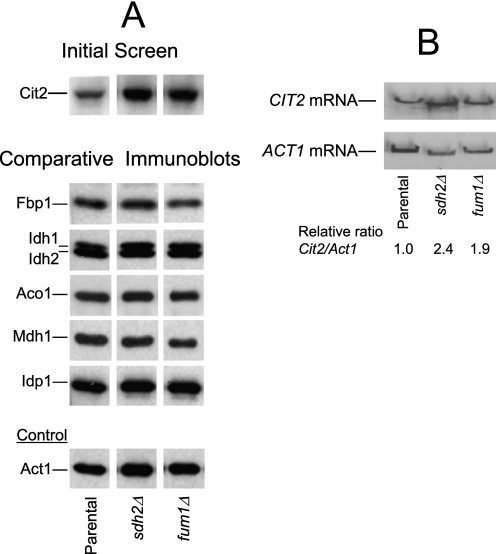
Gene array analyses were previously conducted using a similar set of yeast TCA cycle mutants (1). However, those analyses were conducted with mutants grown with glucose as the carbon source, which represses expression of mitochondrial proteins, and with an aco1Δ mutant that had lost respiratory function (2). Also, because protein levels are more likely to reflect metabolic changes, we conducted immunoblot analyses of a number of TCA cycle and related enzymes to determine, in particular, effects of elevated cellular concentrations of succinate or fumarate in sdh2Δ and fum1Δ mutants. As illustrated in Fig. 2A, an initial screen of TCA cycle gene disruption mutants showed a particular increase in levels of the glyoxylate cycle enzyme citrate synthase (Cit2) in extracts from sdh2Δ and fum1Δ mutants. Relative to the parental strain, cellular levels of Cit2 were elevated >3-fold in extracts from an sdh2Δ mutant and ∼3-fold in extracts from a fum1Δ mutant. The increased levels of Cit2 generally correlated with increased cellular levels of succinate in these mutant strains (see Fig. 1A). In contrast, comparative immunoblots (Fig. 2A) indicated that levels of many other proteins in extracts from sdh2Δ and fum1Δ mutants were similar to levels in the parental strain.
FIGURE 2.
Protein and RNA expression in yeast sdh2Δ and fum1Δ mutants. A, immunoblot analyses were conducted as described under “Experimental Procedures” using 5 μg of cellular protein samples from the indicated yeast strains grown with rich YP medium containing galactose as the carbon source. Similar amounts of each extract were electrophoresed on multiple gels for immunoblot analyses using antisera for each of the indicated proteins. Gaps between lanes from a single immunoblot indicate that the lanes were not adjacent in the immunoblot. Note: the Idh antiserum recognizes both Idh1 and Idh2 subunits (27). B, CIT2 mRNA levels in parental and mutant strains were determined relative to levels of ACT1 mRNA as described under “Experimental Procedures.”
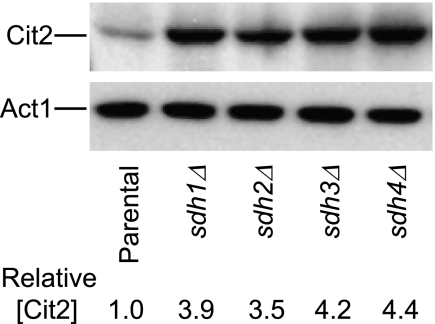
As explained in the legend for Fig. 1, metabolite data were averaged for TCA cycle mutants with disruptions in each gene encoding a subunit of a TCA cycle enzyme. For example, there is only one gene encoding fumarase, but there are four genes encoding subunits of succinate dehydrogenase. Therefore, we examined if the increase in Cit2 levels was a general trait of sdhΔ mutants. As shown in Fig. 3, increases of 3.5–4.4-fold in levels of Cit2 relative to the parental strain were observed for extracts from sdh1Δ, sdh2Δ, sdh3Δ, and sdh4Δ mutants. The four sdhΔ mutants also exhibited similar elevations in cellular succinate levels (0.45–0.58 μmol/mg of protein) relative to the parental strain (0.06 μmol/mg of protein). In subsequent experiments, we arbitrarily used the sdh2Δ mutant (which lacks the iron-sulfur protein subunit of succinate dehydrogenase) as the representative of these strains.
FIGURE 3.
Protein expression in yeast sdh1–4Δ mutants. Immunoblot analyses were conducted as described under “Experimental Procedures” using 5 μg of cellular protein samples from yeast strains containing disruptions in each gene encoding a subunit of succinate dehydrogenase. Similar amounts of each extract were electrophoresed using two gels for immunoblot analyses using antisera for Cit2 or Act1. The level of Cit2 in each sample was compared with that of β-actin (Act1) using densitometry and normalized to the parental strain level.
We also analyzed CIT2 mRNA levels (with actin mRNA as the control, Fig. 2B) in TCA cycle mutants and found similar relative levels of expression as observed for the protein (e.g. 2.4- and 1.9-fold increases in the sdh2Δ and fum1Δ mutants, respectively, relative to the parental strain), suggesting a close correspondence in expression of CIT2 at transcriptional and translational levels in these strains.
Exogenous Succinate and Expression of Cit2
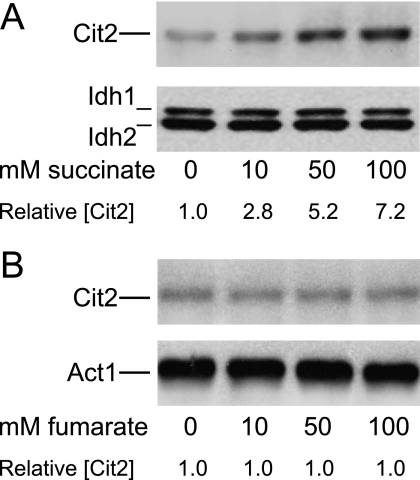
Results described above suggested that elevated endogenous cellular levels of succinate in sdh2Δ and fum1Δ mutants correlate with an increase in levels of Cit2 protein. We therefore examined if similar results could be obtained in the parental strain by adding exogenous succinate to the growth medium. As shown in Fig. 4A, cultivation of the parental strain with increasing concentrations of succinate correlated with elevated levels of Cit2 in cellular extracts (∼7-fold with 100 mm succinate relative to levels with no addition), whereas cellular levels of other proteins (e.g. Idh subunits 1 and 2 in Fig. 4A) remained unchanged. The pH values (6.7–6.9) for cultures containing different amounts of sodium succinate were similar. Also, growth rates were similar for the parental strain grown in cultures with the various amounts of exogenous succinate, and colony sizes and numbers were similar in plate assays (data not shown), suggesting no inhibition of growth by the metabolite. In contrast to the results obtained with addition of succinate to the growth medium, no effect on Cit2 protein levels was observed with cultivation of the parental strain with increasing concentrations of fumarate (Fig. 4B). Initial pH values (6.5–6.6) for cultures containing different amounts of sodium fumarate were also similar. This suggests that it is the elevated level of succinate and not fumarate in the fum1Δ mutant (see Fig. 1) that correlates with elevated Cit2 protein levels.
FIGURE 4.
Protein expression in parental cells cultivated with exogenous succinate or fumarate in the medium. Immunoblot analyses were conducted as described under “Experimental Procedures” using 5 μg of cellular protein samples from the indicated yeast strains cultivated for 18 h in the presence of the indicated concentrations of succinate (A) or fumarate (B). Similar amounts of each extract were electrophoresed on different gels for immunoblot analyses using antisera for the indicated proteins. Relative levels of Cit2 were determined by densitometry.
Compartmentalized Accumulation of Metabolites
To compare mitochondrial to cellular levels of metabolites, we used cell fractionation techniques for isolation of mitochondria (23) as described under “Experimental Procedures.” For the parental strain, we found that cellular levels of TCA cycle metabolites were 2.5–6-fold higher than mitochondrial levels.3 The one exception was succinate because the cellular level in the parental strain (∼64 nmol/mg of protein) was much higher than the mitochondrial level (∼2 nmol/mg of protein), perhaps reflecting production of the metabolite by the cytosolic glyoxylate cycle (Fig. 5).
FIGURE 5.
Sources, transport, and utilization of succinate and fumarate in yeast cells.
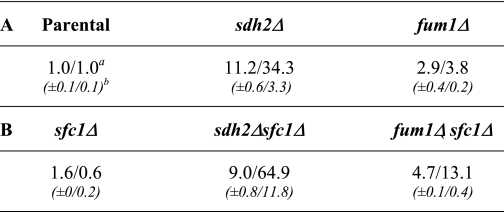
As shown in Table 1A, the relative cellular concentration of succinate in the sdh2Δ mutant was ∼11-fold higher and the relative mitochondrial level of succinate was ∼34-fold higher than parental strain levels, indicating preferential mitochondrial accumulation of the metabolite in the mutant strain. The fum1Δ mutant exhibited, respectively, ∼3- and ∼4-fold higher relative cellular and mitochondrial levels of succinate as compared with the parental strain.
TABLE 1.
Relative cellular/mitochondrial amounts of succinate
a Data represent averages from duplicate measurements of two independent experimental samples and are expressed relative to cellular/mitochondrial amounts in the parental strain.
b Standard deviations.
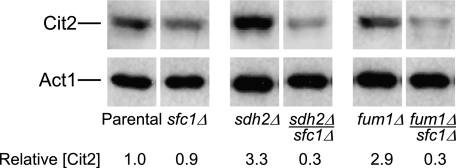
To investigate whether preferential mitochondrial accumulation of succinate in sdh2Δ and fum1Δ mutants was due to transport of the metabolite from the cytosol and if this transport correlated with increased levels of Cit2, we introduced a disruption of the gene (SFC1) encoding the mitochondrial transporter for succinate and fumarate (33) in parental and mutant strains (see Fig. 5). As illustrated in Fig. 6, Cit2 protein levels were similar in extracts from the parental strain and sfc1Δ mutant. However, remarkably, levels of Cit2 in extracts from sdh2Δsfc1Δ and fum1Δsfc1Δ strains were ∼10-fold lower than levels in extracts from the sdh2Δ and fum1Δ mutants and ∼3-fold lower than levels in the parental strain.
FIGURE 6.
Expression of Cit2 in yeast sfc1Δ mutants. Immunoblot analyses were conducted as described under “Experimental Procedures” using 5 μg of cellular protein samples from the indicated yeast strains. Similar amounts of each extract were electrophoresed on multiple gels for immunoblot analyses using antisera for each of the indicated proteins. Gaps between lanes from a single immunoblot indicate that the lanes were not adjacent in the immunoblot. Relative levels of Cit2 were determined by densitometry.
The low levels of Cit2 in sdh2Δsfc1Δ and fum1Δsfc1Δ strains suggest that transport of succinate by Sfc1 across the mitochondrial membrane in sdh2Δ and fum1Δ mutants is related to elevated levels of Cit2. To examine this possibility in more detail, we examined changes in relative compartmental levels of succinate in sfc1Δ mutant strains. As shown in Table 1B, in comparison with the parental strain, the relative cellular level of succinate in the sfc1Δ transporter mutant increased slightly, whereas the relative mitochondrial level decreased. This suggests that succinate produced in the cytosol by the glyoxylate pathway is normally transferred via Sfc1 into the mitochondrial matrix and is rapidly utilized in the TCA cycle, compatible with the reported direction of transport of succinate via Sfc1 (33) shown in Fig. 5.
We predicted that transport mediated by Sfc1 in the sdh2Δ mutant would likely be minimal because cellular levels of fumarate in this strain are very low (∼10-fold lower than in the parental strain, from data presented graphically in Fig. 1). Also, as shown in Table 1B, whereas the relative cellular levels of succinate were similar in sdh2Δsfc1Δ and sdh2Δ strains, the relative mitochondrial level of succinate in the sdh2Δsfc1Δ strain was ∼2-fold higher than that in the sdh2Δ strain. These results suggest that the high relative mitochondrial level of succinate in the sdh2Δ strain may not only block but may even result in reversal of the normal function of Sfc1 allowing succinate to exit mitochondria, and that this exit is impaired in the sdh2Δsfc1Δ strain. Similarly, as compared with levels in the fum1Δ mutant, the relative cellular level of succinate was 1.6-fold higher in the fum1Δsfc1Δ strain, whereas the mitochondrial level was almost 3-fold higher, also suggesting an impairment of succinate transport out of mitochondria in the fum1Δsfc1Δ strain.
As controls for these experiments, we examined cellular and mitochondrial levels of fumarate in comparable fum1Δ strains. For the parental strain, we found that the cellular fumarate level (∼2.7 nmol/mg of protein) was higher than the mitochondrial level (∼1.0 nmol/mg of protein).3 As shown in Table 2, in comparison with the parental strain, the relative cellular level of fumarate in the sfc1Δ mutant was similar, whereas the relative mitochondrial level increased slightly. This suggests that some fumarate produced in mitochondria by the TCA cycle is normally transferred via Sfc1 into the cytosol, also compatible with the reported direction of transport of fumarate via Sfc1 (33) (see Fig. 5). As also shown in Table 2, the fum1Δ mutant, which lacks both mitochondrial and cytosolic forms of the enzyme (6), exhibited a relative cellular fumarate level ∼100-fold higher than the parental strain level, whereas the relative mitochondrial fumarate level was <10-fold higher, suggesting a preferential accumulation of the metabolite outside mitochondria. Both cellular and mitochondrial levels of fumarate were further elevated in the fum1Δsfc1Δ strain. However, the ∼10-fold differential in relative compartmental levels was similar in fum1Δ and fum1Δsfc1Δ strains. Thus, loss of the Sfc1 transporter in the fum1Δ mutant had little effect on the cellular distribution of fumarate, and it appears that most of the excess fumarate is located in the cytosol.
TABLE 2.
Relative cellular/mitochondrial amounts of fumarate
| Parental | sfc1Δ | fum1Δ | fum1Δsfc1Δ |
|---|---|---|---|
| 1.0/1.0a | 1.0/1.6 | 99/9.3 | 166/17.3 |
| ±0.3/0.4b | ±0.1/0.2 | ±27/0.5 | ±.2.1/ 0.5 |
a Data represent averages from duplicate measurements of two independent experimental samples and are expressed relative to cellular/mitochondrial amounts in the parental strain.
b Standard deviations.
Collectively, these results suggest that excess succinate preferentially accumulates in mitochondria of sdh2Δ and fum1Δ strains, whereas excess fumarate preferentially accumulates in the cytosol of the fum1Δ strain. Also, high cellular levels of succinate do not per se correlate with increased expression of Cit2, because levels of the metabolite are comparable in sdh2Δ and sdh2Δsfc1Δ strains and in fum1Δ and fum1Δsfc1Δ strains. Instead, the data for compartmentalized succinate levels in sdh2Δ and fum1Δ strains are consistent with a relationship between a block in or aberrant Sfc1-mediated transport of excess succinate out of mitochondria into the cytosol and the increased expression of Cit2, because loss of this transport mechanism in sdh2Δsfc1Δ and fum1Δsfc1Δ strains correlates with reduced expression of Cit2 (see Fig. 6).
Effects of the Retrograde Response on Protein Expression
Expression of the yeast CIT2 gene has previously been linked to the rhoo-inducible retrograde (RTG) response in some strains of yeast (e.g. PSY142) (34, 35). In those strains, CIT2 mRNA levels are very low in parental cells but increase dramatically (up to 30-fold) in cells with compromised mitochondrial function, e.g. in rhoo cells lacking mitochondrial DNA (36). Also, in those strains, defects in the retrograde response have no effect on the parental strain but, in rhoo cells, these defects are associated with very low levels of CIT2 expression and reduced expression of CIT1, IDH, and ACO1 genes (34). The retrograde response has been described as a signal for mitochondrial dysfunction and results in changes in nuclear gene expression due to an Rtg1/Rtg3 heterodimer transcription factor that is translocated to the nucleus in an Rtg2-dependent manner (37). Similar effects on gene expression were reported for disruption of each of the three RTG genes in yeast (34).
In the current study, the parental yeast strain was originally derived from the W303 line (18) that is reported to have a constitutive or weak retrograde response (38), because CIT2 mRNA levels were reported to be only 1.5-fold higher in a rho0 mutant than in the corresponding W303 parental strain. We examined Cit2 protein expression in a respiratory deficient (rhoo) petite mutant derived from our parental strain and also found that Cit2 protein levels were similarly increased ∼1.5-fold relative to the parental strain. Thus, our results also suggest that the dramatic increase in CIT2 expression reported for rhoo mutants of yeast strains that exhibit the rhoo-inducible retrograde response does not occur in the rhoo mutant of the parental strain used in this study. However, because we observe substantial levels of Cit2 expression in our parental strain, the magnitude of the retrograde response as defined solely by levels of Cit2 is likely due to differences in constitutive levels of CIT2 mRNA or protein expression in various parental yeast strains (see the “Discussion”).
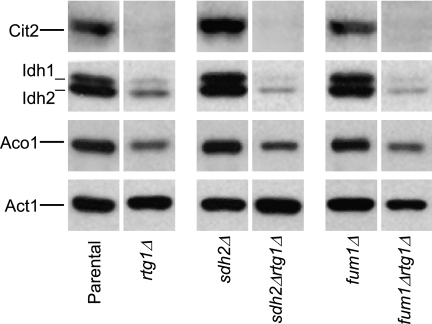
To investigate the potential involvement of the retrograde response in our parental strain and mutants, we constructed various rtg1Δ mutant strains. As shown in Fig. 7, constitutive Cit2 expression in the parental strain was eliminated in an rtg1Δ strain. Introduction of the RTG1 gene disruption into sdh2Δ and fum1Δ strains that normally exhibit elevated levels of Cit2 also eliminated expression of that protein (i.e. for sdh2Δrtg1Δ and fum1Δrtg1Δ strains in Fig. 7). Thus, expression of Cit2 in the parental strain and in sdh2Δ and fum1Δ mutants is dependent on Rtg1 and the retrograde pathway. We conducted multiple immunoblot analyses of extracts from these strains and found relatively little effect of rtg1Δ on expression of many proteins. However, as shown in Fig. 7, there were consistently low cellular levels of Idh and Aco1 in strains containing the RTG1 gene disruption. Thus, in addition to constitutive expression of Cit2, constitutive levels of Idh and Aco1 in this parental strain are also controlled by the retrograde pathway. This is not the case for a yeast strain (e.g. PSY142) (34) that has a rhoo-inducible retrograde response, because rtgΔ mutants of that strain exhibit levels of CIT2, IDH, and ACO1 (as well as CIT1) gene expression comparable with the parental stain.
FIGURE 7.
Effects on protein expression in parental and TCA cycle mutants by a defect in the retrograde response. Immunoblot analyses were conducted as described under “Experimental Procedures” using 5 μg of cellular protein samples from the indicated yeast strains. Similar amounts of each extract were electrophoresed on multiple gels for immunoblot analyses using antisera for each of the indicated proteins. Gaps between lanes from a single immunoblot indicate that the lanes were not adjacent in the immunoblot.
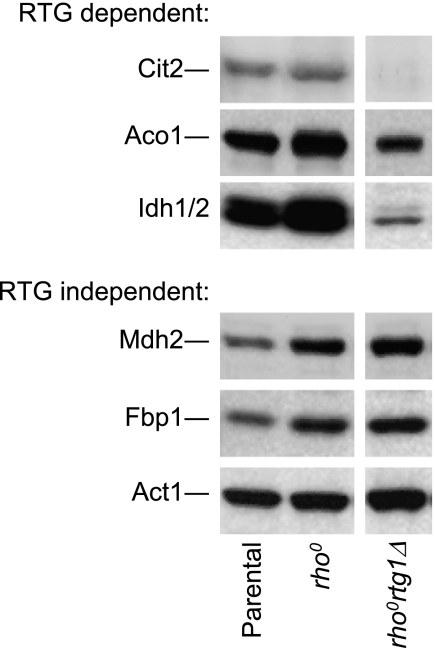
We also examined protein levels in a rhoo mutant derived from our parental strain. As shown in Fig. 8, Aco1 and Idh protein levels were elevated 2–3-fold (and Cit2 levels elevated 1.5-fold) in the rhoo mutant relative to the parental strain. Traven et al. (39) have reported similar results for expression of ACO1 and IDH genes in W303 parental and rhoo cells. To determine the effects of the retrograde pathway on these expression patterns, we deleted the RTG1 gene in our rhoo strain and found that levels of Aco1 and Idh in the rhoortg1Δ mutant were much lower than levels in the parental strain and were similar to those in the rtg1Δ strain (compare Figs. 7 and 8), and there was no expression of Cit2 in the rhoortg1Δ mutant. These data suggest that expression of these proteins in the rhoo mutant is dependent on the retrograde response. This is quite similar to results reported for expression of CIT2, IDH, and ACO1 (as well as CIT1) genes in a rhoortg1Δ mutant of PSY142 (34). As also shown in Fig. 8, not all proteins elevated in the rhoo mutant are controlled by the retrograde response. Levels of gluconeogenic enzymes Mdh2 (cytosolic malate dehydrogenase) and Fbp1 (fructose-1,6-bisphosphatase) were elevated 2–3-fold in both the rhoo mutant and in the rhoortg1Δ mutant relative to the parental strain.
FIGURE 8.
Effects on protein expression in a rhoo strain by a defect in the retrograde response. Immunoblot analyses were conducted as described under “Experimental Procedures” using 5 μg of cellular protein samples from the indicated yeast strains. Similar amounts of each extract were electrophoresed on multiple gels for immunoblot analyses using antisera for each of the indicated proteins. Gaps between lanes from a single immunoblot indicate that the lanes were not adjacent in the immunoblot.
Metabolite measurements for the rhoo mutant derived from our parental strain indicated that cellular levels of most TCA cycle intermediates were similar to or less than 2-fold different from levels in the parental strain. The exception was citrate, which exceeded the parental strain level by ∼4-fold. It may be the elevated levels of citrate in the rhoo strain that correlate with the elevated levels of Idh and Aco1 shown in Fig. 8, because we reported a similar correlation between increased levels of citrate and increased expression of Aco1 in idhΔ mutants and Idh in an aco1Δ mutant (2).
Effects of the Retrograde Response on Metabolite Levels
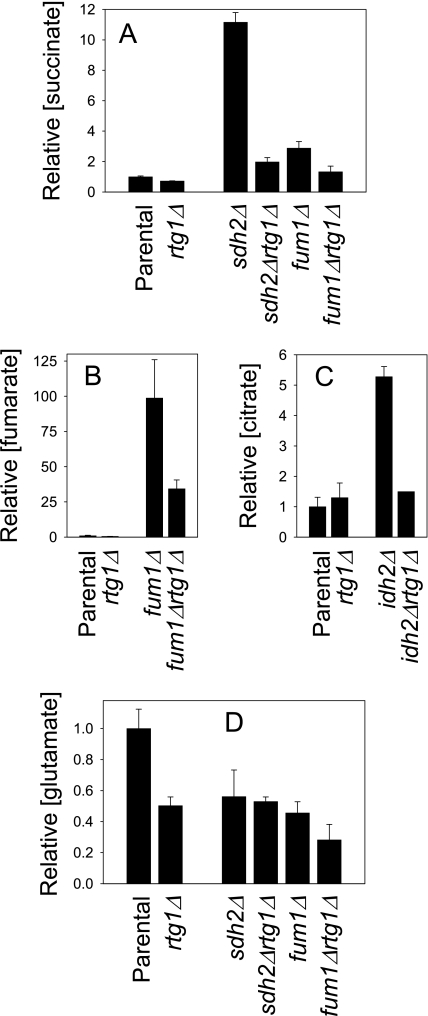
Cellular metabolite profiles for the rtg1Δ strain were found to be comparable with those of the parental strain, as shown for succinate, fumarate, and citrate in Fig. 9, A–C. Because cellular levels of Cit2, Idh, and Aco1 in sdh2Δ and fum1Δ strains were dramatically reduced by co-disruption of the RTG1 gene in sdh2Δrtg1Δ and fum1Δrtg1Δ strains (see Fig. 7), we also examined metabolite levels in these strains. As shown in Fig. 9A, the cellular level of succinate in the sdh2Δrtg1Δ strain was ∼5-fold lower than in the sdh2Δ strain and only 2-fold higher than in the parental strain. In addition, the level of succinate in the fum1Δrtg1Δ strain was >2-fold lower than in the fum1Δ strain and was comparable with that in the parental strain. Thus, introduction of RTG1 gene disruption into sdh2Δ and fum1Δ strains not only correlates with loss of Cit2 expression but also with reduction of succinate levels. Similarly, as shown in Fig. 9B, the cellular level of fumarate in the fum1Δrtg1Δ strain was ∼3-fold lower than that in the fum1Δ strain, although it still exceeded that in the parental strain. Also, the level of citrate (Fig. 9C) in an idh2Δrtg1Δ strain was ∼4-fold lower than that in an idh2Δ strain and was only 1.5-fold higher than those in the parental strain.
FIGURE 9.
Effects on levels of TCA cycle intermediates by a defect in the retrograde response. Cellular levels of succinate (A), fumarate (B), citrate (C), or glutamate (D) in extracts from the indicated yeast strains were determined using GC/MS, as described under “Experimental Procedures.” Data represent averages from duplicate measurements in two independent experiments.
Thus, Rtg1 and the retrograde response appear to be required for the excess accumulation of substrates in TCA cycle mutants. This is likely due to a general attenuation of flux through the TCA cycle in the rtg1Δ mutants because of down-regulation of expression of Aco1 and Idh proteins (see Fig. 7). Consistent with this idea, although we observed similar cellular metabolite levels, mitochondrial levels of most TCA cycle intermediates were lower in the rtg1Δ strain than in the parental strain in this study (Table 3). The exception was malate with a level 1.7-fold higher in the rtg1Δ strain than in the parental strain presumably due to reduced utilization of this metabolite in the TCA cycle.
TABLE 3.
Ratios of concentrations of mitochondrial metabolites (rtg1Δ strain/parental strain)
| Strain | Strain | ||
|---|---|---|---|
| Citrate | 0.8 | Succinate | 0.5 |
| Aconitate | 0.4 | Fumarate | 0.6 |
| Isocitrate | 0.4 | Oxaloacetate | NDa |
| α-Ketoglutarate | NDb | Malate | 1.7 |
a Levels of oxaloacetate in parental strain mitochondria were similar to levels of aconitate, but oxaloacetate was not detectable in rtg1Δ mitochondria.
b Levels of α-ketoglutarate were not detectable in mitochondria from either strain in this experiment.
Glutamate was previously proposed to be a metabolite mediator of the retrograde response in rtgΔrhoo cells from a strain with a rhoo-inducible retrograde response (36), due to down-regulation of expression of CIT1, ACO1, and IDH genes and the consequent expected reduction in levels of cellular α-ketoglutarate for glutamate synthesis, although metabolite levels were not quantified. We therefore examined cellular levels of glutamate for parental and mutant strains in this study. Glutamate was found to be an abundant metabolite in parental yeast cells (∼1 μmol/mg of protein). As shown in Fig. 9D, the cellular level of glutamate was ∼50% lower in the rtg1Δ mutant (which exhibits no Cit2 expression and low levels of Idh and Aco1) than in the parental strain. However, levels of the metabolite were similarly lower in sdh2Δ and fum1Δ strains, which exhibit higher levels of Cit2 than the parental strain and parental levels of Idh and Aco1. In addition, the glutamate level was not substantially reduced in the Δsdh2Δrtg1Δ strain (no Cit2 expression and low levels of Idh and Aco1) relative to the sdh2Δ strain. Although the glutamate level in the fum1Δrtg1Δ strain was lower than that in the fum1Δ strain, overall we do not observe any consistent correlation between relative cellular levels of glutamate and a defect in the retrograde response.
Effects of the Retrograde Response on Petite Frequencies
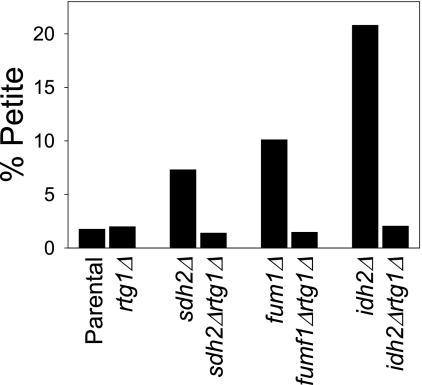
Finally, we examined the importance of Rtg1 in one of the common phenotypes associated with TCA cycle mutants, an accumulation of petite mutants with growth in culture (1). As illustrated in Fig. 10, yeast TCA cycle mutants exhibit different petite frequencies. Approximately 20% of the cells in a galactose-grown culture of an idh2Δ strain were petite. The petite frequencies of the sdh2Δ and fum1Δ strains under similar conditions were ∼7 and 10%, respectively, in contrast to petite frequencies of ∼2% for parental and rtg1Δ strains. In the TCA cycle mutants also containing a disruption of the RTG1 gene, petite frequencies were similar to those observed for the parental and rtg1Δ strains. Thus, Rtg1 and the retrograde response are also linked to phenotypes associated with dysfunctions in the TCA cycle. This may be due to reduction in accumulated metabolites in the TCA cycle mutants that results from co-disruption of the RTG1 gene as shown above.
FIGURE 10.
Effects on petite frequencies by a defect in the retrograde response. Petite frequencies of the indicated yeast strains were determined as described under “Experimental Procedures.”
DISCUSSION
Our analyses of compartmentalized levels of TCA cycle metabolites in a parental yeast strain grown with galactose as the carbon source suggest that total cellular levels substantially exceed mitochondrial levels. There are few direct studies of compartmental differences in metabolite concentrations, but Castegna et al. (40) also recently reported a substantially higher level of citrate in the cytosol than in mitochondria of a yeast strain grown in minimal medium with acetate as the carbon source. The largest differential in compartmentalized levels that we observed was for succinate, presumably due to cytosolic production of this metabolite by the glyoxylate pathway. The major fate of cytosolic succinate in yeast is assumed to be transfer into mitochondria as an anaplerotic mechanism. The transfer of succinate into mitochondria and export of fumarate into the cytosol via the yeast Sfc1 transporter (33) provides substrate for the cytosolic form of Fum1 for conversion to malate that can be used for gluconeogenesis. Succinate can also be imported into mitochondria in exchange for export of phosphate via the dicarboxylate carrier (41), which would fulfill an anaplerotic function but would not support gluconeogenesis.
It is unlikely that the Sfc1 transporter would be active in yeast sdhΔ mutants due to the absence of sufficient fumarate for countertransport. This could in part account for the higher relative (but not absolute) accumulation of succinate in mitochondria as compared with the increase in cellular levels in an sdh2Δ mutant. In fact, results obtained with an sdh2Δsfc1Δ mutant suggest that some of the mitochondrial succinate in the sdh2Δ mutant may be aberrantly transported into the cytosol. That this aberrant transport (at least partially mediated by Sfc1) may be connected with the increased expression of Cit2 in the sdh2Δ strain is suggested by decreased expression of Cit2 in the sdh2Δsfc1Δ mutant. Thus, a block in or aberrant transport of succinate by Sfc1 may impact up-regulation of Cit2 and glyoxylate cycle activity in the sdh2Δ strain.
Interestingly, others have reported that succinate is secreted into the medium during cultivation of yeast sdhΔ mutants (3, 42), and there is substantial interest in maximizing this process as a bioindustrial source of the metabolite and in some yeasts used for brewing sake (Japanese wine), in which succinate is a major taste component (43). Raab et al. (44) recently reported that excellent extracellular yields were obtained by combining disruption of SDH genes (to prevent conversion of succinate to fumarate) with disruptions of genes encoding the two mitochondrial enzymes (Idh and Idp1) that catalyze the conversion of isocitrate to α-ketoglutarate. The latter disruptions led to delivery of the excess mitochondrial isocitrate to the cytosolic glyoxylate pathway, resulting in a substantial increase in levels of succinate production and secretion relative to use of sdhΔ mutants alone.
Mammalian cells lack a glyoxylate cycle, so succinate is primarily produced in mitochondria. In human SDH mutant cells, however, the excess succinate is speculated to have potential detrimental effects on non-mitochondrial processes (14). Because there are few normal cytosolic processes that require succinate, it may be that some aberrant transport mechanism for succinate export out of mitochondria is also operative in these cells. One other important consequence of the loss of Sdh in yeast is very low cellular levels of fumarate (∼10-fold lower than parental cellular levels). Because this would likely apply to mammalian SDH mutant cells as well, there may be potential detrimental effects due to low fumarate levels.
That fumarate accumulates to high levels preferentially in the cytosol of a yeast fum1Δ mutant may be due to increased export of fumarate from mitochondria into the cytosol as well as to a block in the conversion of fumarate to malate for gluconeogenesis by the cytosolic form of this dually localized enzyme. However, the export of fumarate in the fum1Δ mutant appears to be independent of the Sfc1 transporter. Another mitochondrial carrier for citrate and α-ketoglutarate showed only a low potential for fumarate transport (40), so the mechanism for export of excess fumarate into the cytosol of the fum1Δ mutant is unknown. There are some cytosolic reactions that catalyze formation of fumarate (e.g. the reactions in the adenine biosynthetic pathway catalyzed by adenylosuccinate lyase) (45) but these are unlikely to explain the high cytosolic concentrations observed in the fum1Δ mutant. With respect to Sfc1 and other mitochondrial carriers, dysfunctions in the TCA cycle could also have deleterious effects on the electrochemical gradient and substantially alter functions of transporters dependent on this gradient.
A recent report by Yogev et al. (46) showed that the cytosolic form of fumarase can be recruited to the nucleus in both yeast and mammalian cells in response to double strand breaks in DNA, and that the conversion of malate to fumarate by the yeast nuclear form of Fum1 may, by some unknown mechanism, play a role in the DNA damage response. Thus, in addition to provision of malate for gluconeogenesis, the cytosolic form of fumarase apparently catalyzes the reverse reaction in the nucleus in response to DNA damage. Clearly, this function in yeast might be directly impacted by the substantial alterations in cellular fumarate levels, i.e. the reduction observed in an sdh2Δ mutant and the increase observed in a fum1Δ mutant, and by extrapolation to similar metabolite changes in human SDH and FH mutants.
We have not observed any changes in protein expression specifically attributable to increased fumarate levels in the fum1Δ mutant. In contrast, relative to the parental strain, an increase in cellular concentrations of citrate was previously correlated with increased levels of Idh in an aco1Δ mutant and Aco1 in an idhΔ mutant (2). This suggests that higher than normal cellular levels of citrate may impact expression of enzymes important for metabolism of that metabolite, similar to the apparent impact of aberrant succinate transport on expression of Cit2.
Our results show that the retrograde response pathway is necessary for many of the effects we observe related to metabolite changes in and phenotypes associated with yeast TCA cycle mutants. We note that differences in expression of Cit2/CIT2 in rhoo relative to parental cells are due to respiratory deficiency (34, 38) and are not per se a measure of the magnitude of the retrograde response. Instead, the overall impact of the retrograde pathway on the breadth of expression of proteins/mRNAs going from minimal expression in an rtgΔrhoo mutant to maximal expression in a rhoo mutant is similar in strains with either the W303 background (Fig. 8) or the PSY142 background (34). However, the retrograde response in W303 strains does not appear to be directly associated with mitochondrial dysfunction as suggested for strains with rhoo-inducible responses (36).
The basis for the fundamental differences in retrograde responses of W303 and PSY142 parental strains is unknown. One reported impact of these differences has to do with effects on replicative life spans determined using a fermentable, non-repressing carbon source. Kirchman et al. (38) have shown that rhoo derivatives of some yeast strains have longer life spans than respective parental strains and that this extension of life span is dependent on the retrograde response. In contrast, a rhoo derivative of W303 and the parental strain have similar life spans. However, as might be predicted for a parental strain with a constitutive retrograde response, the life span reported for the parental W303 strain was significantly longer than those reported for parental strains with rhoo-inducible retrograde responses (38).
There have been comparisons made between the retrograde response in yeast and the NF-κB stress response in mammalian cells (36, 47), because the latter can be activated by mitochondrial dysfunction and other signals. Thus, it will be of interest to determine effects on this signaling pathway associated with SDH and FH mutations in humans.
Acknowledgments
We thank Dr. Susan T. Weintraub and Kevin W. Hakala, Facility for Mass Spectrometry at the University of Texas Health Science Center, for assistance with analyses using GC/MS. We also acknowledge the Nucleic Acids Core Facility for oligonucleotide synthesis and DNA sequence analysis.
This work was supported, in whole or in part, by National Institutes of Health Grant GM051265.
These values represent nanamole/mg of cellular or mitochondrial protein. In cellular fractionation procedures, the recovery of cellular protein is ∼4.6-fold greater than the recovery of mitochondrial protein. Thus, corrections to compare values on a cellular basis would give cellular:mitochondrial levels for most TCA cycle mutants of ∼12:1 to 28:1. For succinate, this ratio is 147:1, and for fumarate, this ratio is 12:1.
- TCA
- tricarboxylic
- SDH
- succinate dehydrogenase
- Fum
- fumarase
- Idh
- NAD+-specific isocitrate dehydrogenase
- Cit
- citrate synthase
- Aco
- aconitase
- KGD
- α-ketoglutarate dehydrogenase
- Mdh
- malate dehydrogenase
- Idp
- NADP+-specific isocitrate dehydrogenase
- RTG
- retrograde.
REFERENCES
- 1. McCammon M. T., Epstein C. B., Przybyla-Zawislak B., McAlister-Henn L., Butow R. A. (2003) Mol. Biol. Cell 14, 958–972 [DOI] [PMC free article] [PubMed] [Google Scholar]
- 2. Lin A. P., Hakala K. W., Weintraub S. T., McAlister-Henn L. (2008) Arch. Biochem. Biophys. 474, 205–212 [DOI] [PMC free article] [PubMed] [Google Scholar]
- 3. Szeto S. S., Reinke S. N., Sykes B. D., Lemire B. D. (2007) J. Biol. Chem. 282, 27518–27526 [DOI] [PubMed] [Google Scholar]
- 4. Hu G., Lin A. P., McAlister-Henn L. (2006) J. Biol. Chem. 281, 16935–16942 [DOI] [PubMed] [Google Scholar]
- 5. McCammon M. T. (1996) Genetics 144, 57–69 [DOI] [PMC free article] [PubMed] [Google Scholar]
- 6. Sass E., Blachinsky E., Karniely S., Pines O. (2001) J. Biol. Chem. 276, 46111–46117 [DOI] [PubMed] [Google Scholar]
- 7. Rustin P., Bourgeron T., Parfait B., Chretien D., Munnich A., Rötig A. (1997) Biochim. Biophys. Acta 1361, 185–197 [DOI] [PubMed] [Google Scholar]
- 8. Baysal B. E., Ferrell R. E., Willett-Brozick J. E., Lawrence E. C., Myssiorek D., Bosch A., van der Mey A., Taschner P. E., Rubinstein W. S., Myers E. N., Richard C. W., 3rd, Cornelisse C. J., Devilee P., Devlin B. (2000) Science 287, 848–851 [DOI] [PubMed] [Google Scholar]
- 9. Niemann S., Müller U. (2000) Nat. Genet. 26, 268–270 [DOI] [PubMed] [Google Scholar]
- 10. Astuti D., Latif F., Dallol A., Dahia P. L., Douglas F., George E., Sköldberg F., Husebye E. S., Eng C., Maher E. R. (2001) Am. J. Hum. Genet. 69, 49–54 [DOI] [PMC free article] [PubMed] [Google Scholar]
- 11. Alam N. A., Rowan A. J., Wortham N. C., Pollard P. J., Mitchell M., Tyrer J. P., Barclay E., Calonje E., Manek S., Adams S. J., Bowers P. W., Burrows N. P., Charles-Holmes R., Cook L. J., Daly B. M., Ford G. P., Fuller L. C., Hadfield-Jones S. E., Hardwick N., Highet A. S., Keefe M., MacDonald-Hull S. P., Potts E. D., Crone M., Wilkinson S., Camacho-Martinez F., Jablonska S., Ratnavel R., MacDonald A., Mann R. J., Grice K., Guillet G., Lewis-Jones M. S., McGrath H., Seukeran D. C., Morrison P. J., Fleming S., Rahman S., Kelsell D., Leigh I., Olpin S., Tomlinson I. P. (2003) Hum. Mol. Genet. 12, 1241–1252 [DOI] [PubMed] [Google Scholar]
- 12. Tomlinson I. P., Alam N. A., Rowan A. J., Barclay E., Jaeger E. E., Kelsell D., Leigh I., Gorman P., Lamlum H., Rahman S., Roylance R. R., Olpin S., Bevan S., Barker K., Hearle N., Houlston R. S., Kiuru M., Lehtonen R., Karhu A., Vilkki S., Laiho P., Eklund C., Vierimaa O., Aittomäki K., Hietala M., Sistonen P., Paetau A., Salovaara R., Herva R., Launonen V., Aaltonen L. A. (2002) Nat. Genet. 30, 406–410 [DOI] [PubMed] [Google Scholar]
- 13. Isaacs J. S., Jung Y. J., Mole D. R., Lee S., Torres-Cabala C., Chung Y. L., Merino M., Trepel J., Zbar B., Toro J., Ratcliffe P. J., Linehan W. M., Neckers L. (2005) Cancer Cell 8, 143–153 [DOI] [PubMed] [Google Scholar]
- 14. Pollard P. J., Brière J. J., Alam N. A., Barwell J., Barclay E., Wortham N. C., Hunt T., Mitchell M., Olpin S., Moat S. J., Hargreaves I. P., Heales S. J., Chung Y. L., Griffiths J. R., Dalgleish A., McGrath J. A., Gleeson M. J., Hodgson S. V., Poulsom R., Rustin P., Tomlinson I. P. (2005) Hum. Mol. Genet. 14, 2231–2239 [DOI] [PubMed] [Google Scholar]
- 15. Warburg O. (1956) Science 123, 309–314 [DOI] [PubMed] [Google Scholar]
- 16. McKnight S. L. (2010) Science 330, 1338–1339 [DOI] [PubMed] [Google Scholar]
- 17. Levine A. J., Puzio-Kuter A. M. (2010) Science 330, 1340–1344 [DOI] [PubMed] [Google Scholar]
- 18. McCammon M. T., Veenhuis M., Trapp S. B., Goodman J. M. (1990) J. Bacteriol. 172, 5816–5827 [DOI] [PMC free article] [PubMed] [Google Scholar]
- 19. Wach A., Brachat A., Pöhlmann R., Philippsen P. (1994) Yeast 10, 1793–1808 [DOI] [PubMed] [Google Scholar]
- 20. Gueldener U., Heinisch J., Koehler G. J., Voss D., Hegemann J. H. (2002) Nucleic Acids Res. 30, e23 [DOI] [PMC free article] [PubMed] [Google Scholar]
- 21. Fox T. D., Folley L. S., Mulero J. J., McMullin T. W., Thorsness P. E., Hedin L. O., Costanzo M. C. (1991) Methods Enzymol. 194, 149–165 [DOI] [PubMed] [Google Scholar]
- 22. Gotham S. M., Fryer P. J., Paterson W. R. (1988) Anal. Biochem. 173, 353–358 [DOI] [PubMed] [Google Scholar]
- 23. Daum G., Böhni P. C., Schatz G. (1982) J. Biol. Chem. 257, 13028–13033 [PubMed] [Google Scholar]
- 24. Bradford M. M. (1976) Anal. Biochem. 72, 248–254 [DOI] [PubMed] [Google Scholar]
- 25. Laemmli U. K. (1970) Nature 227, 680–685 [DOI] [PubMed] [Google Scholar]
- 26. Bigl M., Eschrich K. (1994) Biol. Chem. Hoppe-Seyler 375, 153–160 [DOI] [PubMed] [Google Scholar]
- 27. Keys D. A., McAlister-Henn L. (1990) J. Bacteriol. 172, 4280–4287 [DOI] [PMC free article] [PubMed] [Google Scholar]
- 28. Regev-Rudzki N., Karniely S., Ben-Haim N. N., Pines O. (2005) Mol. Biol. Cell 16, 4163–4171 [DOI] [PMC free article] [PubMed] [Google Scholar]
- 29. Thompson L. M., Sutherland P., Steffan J. S., McAlister-Henn L. (1988) Biochemistry 27, 8393–8400 [DOI] [PubMed] [Google Scholar]
- 30. Minard K. I., McAlister-Henn L. (1991) Mol. Cell. Biol. 11, 370–380 [DOI] [PMC free article] [PubMed] [Google Scholar]
- 31. Haselbeck R. J., McAlister-Henn L. (1993) J. Biol. Chem. 268, 12116–12122 [PubMed] [Google Scholar]
- 32. Maniatis T., Fritsch E. F., Sambrook J. (1982) Molecular Cloning: A Laboratory Manual, Cold Spring Harbor Laboratory, Cold Spring Harbor, NY [Google Scholar]
- 33. Palmieri L., Lasorsa F. M., De Palma A., Palmieri F., Runswick M. J., Walker J. E. (1997) FEBS Lett. 417, 114–118 [DOI] [PubMed] [Google Scholar]
- 34. Liu Z., Butow R. A. (1999) Mol. Cell. Biol. 19, 6720–6728 [DOI] [PMC free article] [PubMed] [Google Scholar]
- 35. Epstein C. B., Waddle J. A., Hale W., 4th, Davé V., Thornton J., Macatee T. L., Garner H. R., Butow R. A. (2001) Mol. Biol. Cell 12, 297–308 [DOI] [PMC free article] [PubMed] [Google Scholar]
- 36. Butow R. A., Avadhani N. G. (2004) Mol. Cell 14, 1–15 [DOI] [PubMed] [Google Scholar]
- 37. Sekito T., Thornton J., Butow R. A. (2000) Mol. Biol. Cell 11, 2103–2115 [DOI] [PMC free article] [PubMed] [Google Scholar]
- 38. Kirchman P. A., Kim S., Lai C. Y., Jazwinski S. M. (1999) Genetics 152, 179–190 [DOI] [PMC free article] [PubMed] [Google Scholar]
- 39. Traven A., Wong J. M., Xu D., Sopta M., Ingles C. J. (2001) J. Biol. Chem. 276, 4020–4027 [DOI] [PubMed] [Google Scholar]
- 40. Castegna A., Scarcia P., Agrimi G., Palmieri L., Rottensteiner H., Spera I., Germinario L., Palmieri F. (2010) J. Biol. Chem. 285, 17359–17370 [DOI] [PMC free article] [PubMed] [Google Scholar]
- 41. Palmieri L., Runswick M. J., Fiermonte G., Walker J. E., Palmieri F. (2000) J. Bioenerg. Biomembr. 32, 67–77 [DOI] [PubMed] [Google Scholar]
- 42. Szeto S. S., Reinke S. N., Sykes B. D., Lemire B. D. (2010) J. Proteome Res. 9, 6729–6739 [DOI] [PubMed] [Google Scholar]
- 43. Arikawa Y., Kobayashi M., Kodaira R., Shimosaka M., Muratsubaki H., Enomoto K., Okazaki M. (1999) J. Biosci. Bioeng. 87, 333–339 [DOI] [PubMed] [Google Scholar]
- 44. Raab A. M., Gebhardt G., Bolotina N., Weuster-Botz D., Lang C. (2010) Metab. Eng. 12, 518–525 [DOI] [PubMed] [Google Scholar]
- 45. Jones E. B., Fink G. R. (1982) in The Molecular Biology of the Yeast Saccharomyces cerevisiae (Strathern J. N., Jones E. B., Broach J. R. eds) pp. 181–299, Cold Spring Harbor Laboratory Press, Cold Spring Harbor, NY [Google Scholar]
- 46. Yogev O., Yogev O., Singer E., Shaulian E., Goldberg M., Fox T. D., Pines O. (2010) PLoS Biol. 8, e1000328 [DOI] [PMC free article] [PubMed] [Google Scholar]
- 47. Srinivasan V., Kriete A., Sacan A., Jazwinski S. M. (2010) Aging Cell 9, 933–941 [DOI] [PMC free article] [PubMed] [Google Scholar]


