Abstract
Host antibody response is a crucial defense against pathogenic infection. Here, we report a novel technique allowing quantitative measurement of polyclonal antibody response in vivo. This involves expression of a combinatorial library of target proteins from a candidate pathogen on the surface of yeast Saccharomyces cerevisiae. After mixing with serum/plasma from infected or immunized subjects, positive yeast clones were isolated via fluorescence-activated cell sorting (FACS). Using this technique, we have studied mouse immunized serum with recombinant hemagglutinin (HA) protein from a human influenza H5N1 strain (A/Anhui/1/2005) and convalescent plasma from an infected human in China. Our technique has identified novel antigenic domains targeted by serum/plasma and allowed calculation of the relative proportion of the antibody response against each domain. We believe such systematic measurement of an antibody response is unprecedented, and applying this method to different pathogens will improve understanding of protective immunity and guide development of vaccines and therapeutics.
Keywords: Antibodies, Antigen, Infectious Diseases, Influenza Virus, Protein Engineering
Introduction
A major component of adaptive immunity is the antibody response (1). Polyclonal by nature, the antibody response in vivo mobilizes a dynamic and complex mixture of monoclonal antibodies (mAb) targeting various antigenic domains on the proteins of the pathogen. Although it is known that different antigenic domains trigger fundamentally different polyclonal antibody responses, existing methods have been inadequate in specifying which antigenic domains are recognized and in measuring what proportion of the overall response is attributable to each antigenic domain (1–3).
In many cases, disease status or vaccine efficacy can be predicted by enzyme-linked immunosorbent assay (ELISA) or neutralization assays (1). ELISA usually measures the concentration of binding antibodies against pathogen proteins, whereas neutralizing assays measure the capability of antibodies in suppressing pathogen replication (1). Antibody-dependent cell-mediated cytotoxicity assays can also be used to study subsets of immune effector cells (1). However, these types of assays are inherently holistic and do not identify specific antigenic domains preferentially recognized in vivo.
Recently, elegant systems for retrieving large numbers of mAbs directly from host memory B cells have been reported (4–9). There are studies in which several hundred mAbs from HIV- or influenza-infected patients have been retrieved (5–7). Analyses of these mAbs have identified several major antigenic domains in HIV-1 and influenza virus preferentially recognized in infected individuals (4–9). Yet attempts to restore broadly neutralizing serum activity by pooling these mAbs together were only partially successful (5). It is possible that antigens used to isolate these mAbs did not adequately approximate the native structure of the pathogen of interest or that the proportions of pooled antibodies were not equivalent to those in the serum. Regardless, this suggests that the polyclonal antibody response in vivo is far more complicated than simple addition of monoclonal antibodies and is beyond what the peripheral memory B cells can be accounted for in the blood.
Attempts have also been made to use either peptide fragments or whole functional domains of antigens to probe polyclonal response in vivo (5, 10, 11). However, as peptide fragments are too short and the functional domains are too long, neither of these approaches has provided comprehensive results. Thus, as routine or elegant as they are, these available measures remain inadequate. Here, we report a novel technique that provides both qualitative and quantitative measurements of polyclonal antibody response in vivo. This approach involves the construction and expression of a combinatorial library of target proteins from the pathogen of interest on the surface of yeast Saccharomyces cerevisiae (12–14). Serum/plasma from infected or immunized subjects is mixed with yeast expressing these libraries. Positive yeast clones reactive to the polyclonal serum/plasma are isolated using FACS. Sequence analysis of a sufficient number of sorted single yeast clones using algorithms for sequence scanning and clustering, the antigenic domains recognized, as well as the relative proportion of the polyclonal serum reactive to those domains, can be calculated.
EXPERIMENTAL PROCEDURES
Plasmid, Yeast Strain, and Monoclonal Antibody
The plasmid pCTCON2 for yeast surface display was kindly provided by Dr. K. Dane Wittrup, Massachusetts Institute of Technology (12, 13). Yeast clone S. cerevisiae EBY100 was from Invitrogen (catalog no. C839-00). Monoclonal antibody (mAb) AVFluigG03 recognizing a conformational epitope within the H5N1 HA region was kindly provided by Dr. Minfang Liang, Chinese Center for Disease Control and Prevention (15).
Immunization and Serum Samples
The recombinant HA was produced in insect cells using pAcGP67B baculovirus transfer vector (BD Biosciences), and peptides were synthesized at proteomic center of the Rockefeller University, New York. BALB/c mice were primed on day 0 and then boosted on day 14 and 28 intramuscularly with either peptides (ATGLRNSPLRERR-OVA, KVNSIIDKMN-KLH, and YNAELLVLMENERTLDFHD-OVA) or the ecto-domain of HA of highly pathogenic human influenza H5N1 (A/Anhui/1/2005) identified in China (16). For recombinant HA, adjuvant oil in water (Sigma adjuvant system S6322) was used throughout the immunization procedure. Approximately 20 μg/mouse was used for priming, and 10 μg/mouse was used for subsequent boosting. The serum samples were collected before and throughout the immunization procedure and stored at −80 °C until use. All procedures for animal use and care were approved by the Institutional Committee on Laboratory Animals at Tsinghua University. Convalescent plasma from H5N1 in the infected patient was obtained with informed consent (17). The study was approved by the institution's ethics committee at Shenzhen Donghu Hospital, Shenzhen, China.
Construction of H5N1-HA Combinatorial Libraries Displayed on the Surface of Yeast S. cerevisiae
The yeast surface display vector pCTCON2 was modified with additional T-overhang (pCTCON2-T) for the construction and expression of the combinatorial antigen library directly from the PCR-reassembled fragments (see below). The full-length HA gene from a human H5N1 virus in China (A/Anhui/1/2005) was PCR-amplified, purified, and then digested with DNase I to obtain fragments about 50 bp in length. These relatively small fragments were reassembled to larger 100–800-bp fragments using PCR as described previously (18). The reassembled products were A-tailed and ligated to the pCTCON2-T. The ligation products were transformed to the competent yeast cell line EBY100 using electroporation. Transformed cells were partially spread on SDCAA Amp plates and incubated overnight at 30 °C. The number of colonies was counted to estimate the library size. Conditions for yeast growing and induction of surface antigen expression in solution have been described previously (12, 13). In brief, yeasts were first grown in SDCAA media containing 20 g of dextrose, 6.7 g of Difco yeast nitrogen base, 13.6 g of Bacto casamino acids, 5.4 g of Na2HPO4·12H2O, and 8.56 g of NaH2PO4·H2O in 1 liter of deionized and sterilized H2O at 30 °C for 48 h. At the exponential growth phase, yeasts were then transferred to SGCAA media (prepared as for SDCAA, but using 20 g of galactose instead of dextrose) for induction of antigen expression at 20 °C for 36 h (12, 13).
Immunofluorescence Staining and Sorting of Positive Yeast by FACS
Induced yeast cells (106–107) were collected by centrifugation (12,000 rpm for 1 min), washed with PBS, and incubated with 50 μl of mouse sera (1:100–200 dilution), mAb AVFluIgG03, or human plasma (1:50 dilution) on ice for about 1 h with occasional agitation. Cells were washed twice with cold PBS and then incubated with fluorescently labeled anti-mouse or anti-human IgG secondary antibody (1:200 dilution) on ice for another hour with occasional agitation. Finally, cells were washed twice with cold PBS and analyzed by FACS using Aria II (Biosciences). Sorted positive yeast clones were analyzed by confocal microscopy (Olympus, Japan).
Isolation of Plasmid DNA from Positive Yeast Clones
The sorted yeast cells were transferred to SDCAA media and grown for 24 h at 30 °C before plasmids were extracted using Omega Spin Plasmid kit (Omega Bio-Tek, Inc.). Isolated plasmids were sequenced and analyzed using software Sequencher 4.9 (Gene Codes Corp., Ann Arbor, MI).
Algorithm for Sequence Scanning and Clustering
To analyze potential antigenic domains based on the overlapping fragment sequences, we have developed a novel computer algorithm. Obtained fragment sequences were first translated into amino acid sequences and aligned against the full-length H5N1 (A/Anhui/1/2005) HA amino acid sequence. A sliding window of 10 amino acids was used to scan across the entire alignment from the N to C terminus one residue at a time, although the size of the window and scanning steps can be adjusted. When a window found fragment sequences containing at least five amino acid residues or was ≥50% identical to those in the full-length sequence, the position of the given window was scored based on the number of fragment sequences identified. The window containing the highest number of fragment sequences was classified as the first antigenic domain, which was then plotted based on the frequency of amino acid residues along their corresponding positions in the full-length HA sequence. The scanning process continued again from the beginning until the entire fragment sequences had been assigned to appropriate antigenic domains. For clarity, all the antigenic domains were colored and kept consistent in all of our figures and tables.
Structure Modeling of Antigenic Domains
The H5N1 (A/Anhui/1/05) HA structure was modeled based on the crystal structure of the highly related H5N1 (A/Vietnam/1194/04) HA (PDB code 2IBX). The seven antigenic domains (D1 to D7) and the stretch of 6–23 residues at the peak of each antigenic domain (P1 to P7) as well as the previously identified antigenic domains were superimposed onto the model structure. The structure figures were made with program PyMol (DeLano Scientific, San Carlos, CA).
RESULTS
Construction of a Combinatorial Antigen Library Using Yeast Surface Display System
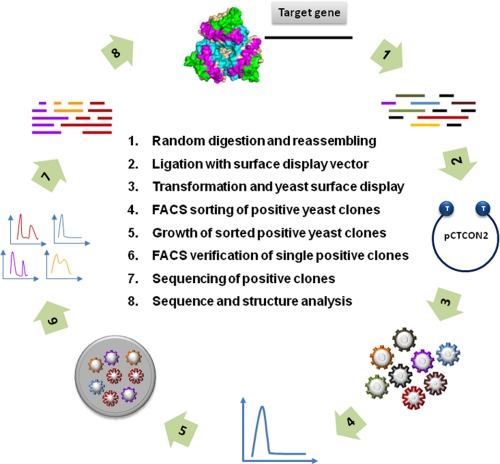
Fig. 1 illustrates the process. It starts with selection and PCR amplification of a target gene followed by DNase I treatment (Fig. 1, step 1) to generate the library of random fragments. The lengths of the fragments are critical in preserving the linear as well as conformational epitopes of the target protein. We achieve the desired lengths of random fragments through PCR-mediated reassembly of digested products as described previously (18). Once purified and provided with a 3′-A overhang, the PCR products are ligated directly (Fig. 1, step 2) to a modified yeast surface display plasmid pCTCON2-T containing a 3′-T overhang. The ligated products are then introduced into the yeast host by electroporation (Fig. 1, step 3). After mixing with serum/plasma from either infected and immunized subjects, the positive yeast clones are analyzed and sorted by FACS (Fig. 1, step 4) and then plated on agarose (Fig. 1, step 5). Single yeast clones are selected and confirmed by FACS again (Fig. 1, step 6) before they are subjected to sequencing (Fig. 1, step 7) and finally sequence and structural analysis (Fig. 1, step 8). It must be stressed why the yeast was chosen over other display systems. First, its protein expression relies on a eukaryotic host capable of post-translational modification such as glycosylation or extensive disulfide isomerization, both absent in prokaryotes. Second, it permits rapid and quantitative library screening and sorting by FACS without the need for soluble expression and purification of each individual clone. Third, it maintains the genotype-phenotype linkage allowing direct genetic characterization and manipulation of displayed proteins (12–14).
FIGURE 1.
Schematic representation of experimental process for construction, selection, and analysis of combinatorial antigen library displayed on the surface of yeast S. cerevisiae.
Construction and Characterization of a Combinatorial HA Antigen Library from a Highly Pathogenic H5N1 Influenza Strain (A/Anhui/1/2005) in China
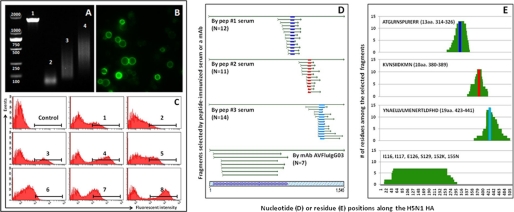
Using the above technique, we constructed a combinatorial library of HA protein from a human influenza H5N1 strain (A/Anhui/1/2005) in China (16). Fig. 2A demonstrates the PCR-amplified full-length HA gene (lane 1), DNase I-digested and purified fragments (lane 2), and reassembled library fragments through 10 (lane 3) or 15 (lane 4) cycles of PCR amplification. Two PCR products were combined to generate the library with diverse yet overlapping fragments largely ranging from 100 to 800 bases. This length range has been shown to preserve conformational as well as linear antigenic domains (18). Based on this range, the theoretical size of the yeast library would need to be on the order of 106 to sufficiently represent the entire HA protein. In fact, this falls nicely within the capacity of the yeast surface display system (12–14). Fig. 2B shows the sorted yeast clones under the confocal microscope after mixing with serum from mice immunized with recombinant H5N1 (A/Anhui/1/2005) HA. All sorted clones have bright and evenly distributed green fluorescence on their surface indicating that protein fragments expressed on the surface are recognizable by the antibodies in the polyclonal serum. There is, however, some variation in the size and fluorescence intensity of the different yeast clones. The former may reflect the natural changes during yeast replication, and the latter may indicate the level of protein expressed and/or preferential recognition by the serum. Differences in fluorescence intensity among different yeast clones are further confirmed by analyzing sorted single yeast clones as shown in Fig. 2C. All positive clones were then sequenced.
FIGURE 2.
Construction and evaluation of combinatorial library of HA protein from a human influenza H5N1 strain (A/Anhui/1/2005) in China (A–C) and confirmation of robustness and specificity of the selection process using immunized mouse serum and a human mAb with known epitope specificity (D–E). A, generation of desired length of gene fragments for library construction by PCR amplification, DNase I digestion, and reassembling PCR technique. B, evaluation of FACS-sorted positive yeast clones under the confocal microscope. C, FACS analysis of positive single yeast clones after staining with immunized mouse serum. D, overlapping nucleotide sequences of the positive yeast clones selected and aligned to the original full-length HA sequence used for the construction of combinatorial yeast library. E, number of amino acid residues among the selected fragments along their corresponding positions in the HA protein. Bars in dark blue, red, and light blue represent the initial peptide sequences (indicated at upper left corner of each graph) used to immunize the mice and their positions relative to fragment sequences from the selected positive yeast clones. Six amino acid residues in the HA1 region critical for mAb (AVFleIgG03) binding are also indicated.
Selection Process Is Robust and Highly Specific
To verify the robustness and specificity of the process, we used mouse serum immunized with three different HA peptides or a mAb (AVFluIgG03) with known epitope specificity to the H5N1 (A/Anhui/1/2005) HA protein (15). Fig. 2D demonstrates the overlapping nucleotide sequences of the positive yeast clones and their positions relative to the original full-length HA sequence used for the construction of combinatorial yeast library. The fragments selected from the peptide-immunized serum are shorter (<100 residues) compared with those selected by the mAb (≥100 residues), which recognizes a conformational rather than a linear epitope (15). We used a computer algorithm to scan the selected sequences for the most frequently recognized stretches of amino acid residues (Fig. 2E). The peptide-immunized sera yielded high frequency residues that, upon close examination, are known peptide immunogens. In contrast, the high frequency residues yielded by the mAb include a much broader range, because of its more complex structural recognition (15). These results reinforced the validity and accuracy of our approach in identifying both conformational as well as linear antigenic domains. It also verified that antibodies recognizing long fragments (≥100 residues) select conformational domains, whereas those recognizing short fragments (<100 residues) select linear domains. We have therefore used 100 residues as an arbitrary standard to distinguish linear or conformational domains selected by the polyclonal serum/plasma (see below).
Quantitative Analysis of Polyclonal Antibody Response against H5N1 (A/Anhui/1/2005) HA Protein in Immunized Mice
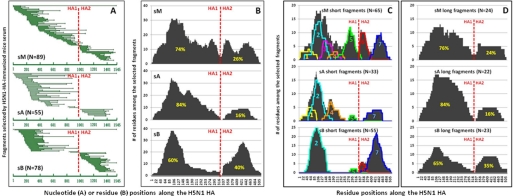
In our study, three separate mouse serum samples were used. One was a serum mix (sM) from five immunized mice, with equal contribution from each animal. The other two (sA and sB) were part of the five but unmixed. A total of 89, 55, and 78 positive yeast clones were selected and sequenced from the sM, sA, and sB samples, respectively. Fig. 3A demonstrates the overlapping nucleotide sequences obtained from the positive yeast clones and their positions along the H5N1 (A/Anhui/1/2005) HA sequence. These fragment sequences were found to represent the entire HA sequence but with clear variations among the three samples and bias toward certain regions within each. In all these samples, however, more of the fragment sequences identified were from the HA1 region than the HA2 region, suggesting more polyclonal antibody responses were against HA1 region in these animals. This finding is in complete agreement with earlier reports in which different adult BALB/C and CBA/Ca mice express distinct antibody repertoires to the same HA protein (19, 20).
FIGURE 3.
Analysis of antigenic domains based on the positive yeast clones selected by the three immunizes serum samples sM, sA, and sB. A, overlapping nucleotide sequences of the positive yeast clones selected by serum samples sM, sA, and sB and aligned to the original full-length HA sequence used for the construction of combinatorial yeast library. B, number of amino acid residues among the selected fragments along their corresponding positions in the HA protein. C, analysis of antigenic domains in HA protein based on the short fragments using algorithms for sequence scanning and clustering. Antigenic domains are numbered and highlighted in various colors. D, no discrete antigenic domains could be identified within the long fragments due to the extended length and sequence similarity of the selected sequences. The red vertical line indicates the point where HA1 and HA2 separate. The percentages highlighted in yellow represent the AUC.
To further characterize the polyclonal antibody responses against HA1 and HA2, we translated all nucleotide sequences into amino acids (Fig. 3B). In each of the three samples, the number of amino acids recognized by the serum is greater in the HA1 region than in the HA2 region, reflected by the area under the curve (AUC)2 (Fig. 3B). In sM, for example, it is estimated that 74% of AUC corresponds to HA1 and the remaining 26% to HA2. In other words, HA1 is about three times more recognizable by the serum than HA2. Similarly, the ratios of AUC between HA1 and HA2 in sA and sB were 84:16% and 60:40%, respectively (Fig. 3B). Such biased recognition is unlikely the result of HA1 merely being longer than HA2, as the ratio of AUC for each sample is significantly different from the statistically expected value of 1.8 (329 versus 186 residues).
Quantitative Analysis of Polyclonal Antibody Response against Linear and Conformational Antigenic Domains within H5N1 (A/Anhui/1/2005) HA Protein in Immunized Mice
We next analyzed the linear versus conformational antigenic domains within HA1 and HA2 based on the length of the fragments selected. The deduced amino acid sequences were separated into short (<100 residues) and the long (≥100 residues) fragments (Fig. 3, C and D) as they are likely selected out by the polyclonal antibodies recognizing either the linear or conformational epitopes, as shown above (Fig. 2, D and E). Short fragments corresponding to several discrete antigenic domains within HA1 and HA2 were identified by computer algorithm for sequence scanning and clustering (Fig. 3C). Domains 2, 5, and 7 are shared among the three samples, and domains 1, 4, and 6 are shared between sM and sA. Domain 3 was only identified in sM. This is expected as sM is the mixture, including sA and sB. In contrast, no discrete antigenic domains could be identified among long fragments, although some regions within the HA1 and HA2 are preferentially recognized (Fig. 3D).
Quantitative Analysis of Polyclonal Antibody Response in Human Recovered from H5N1 (A/Anhui/1/2005) Infection in China
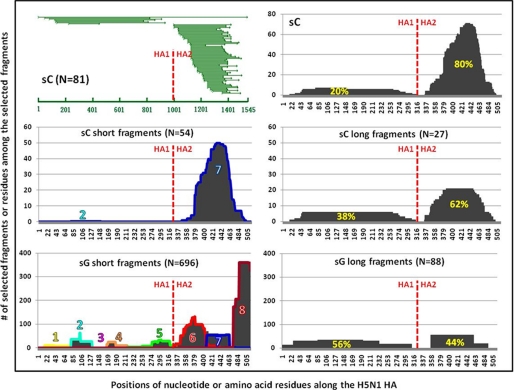
We further analyzed potential linear and conformational antigenic domains recognized by the convalescent plasma from a H5N1 (A/Anhui/1/2005)-infected human. A total of 81 positive yeast clones were selected and sequenced. The top panel in Fig. 4 demonstrates the nucleotide and amino acid data. To our surprise, significantly more fragments were identified in HA2 (80% AUC) than in HA1 (20% AUC). The deduced amino acid sequences were separated into short (<100 residues) and long (≥100 residues) fragments and subjected to sequence scanning and clustering algorithms (Fig. 4, middle panel). Within the short fragments, domain 7 was exceedingly dominant (Fig. 4, middle left panel). This dominance was partially mirrored within the long fragments, as the AUC for HA1 and HA2 regions are 38 and 62%, respectively (Fig. 4, middle right panel).
FIGURE 4.
Analysis of antigenic domains based on the positive yeast clones selected by the convalescent plasma samples from the H5N1 (A/Anhui/1/2005 or A/Vietnam/1203/04)-infected humans. Top panel shows the overlapping nucleotide sequences of the positive yeast clones (left panel) and the number of amino acid residues among the selected fragments along their corresponding positions in the HA protein (right panel) (A/Anhui/1/2005). Middle panel shows the antigenic domains in HA protein identified based on the short (left panel) and long (right panel) fragments (A/Anhui/1/2005). Bottom panel shows the antigenic domains identified based on the fragments selected from a phage display library of a different H5N1 strain (A/Vietnam/1203/04) (11). The red vertical line indicates the point where HA1 and HA2 region separate. The percentages highlighted in yellow represent the AUC.
Finally, we compared our results with those reported by Khurana et al. (11) where the antigenic fragments of a different H5N1 strain (A/Vietnam/1203/04) were studied using phage display libraries. Antigenic fragments selected by pooled convalescent sera from the five H5N1 patients were retrieved, separated into short and long fragments, and then subjected to the same analysis (Fig. 4, bottom panel). It is clear that the pattern and distribution of antigenic domains are quite distinct between the two studies. Their approach tends to select significantly more short fragments than long fragments (696 versus 88) although ours is quite balanced between the two (54 versus 27). Furthermore, an extremely dominant antigenic domain was identified near the C terminus of the HA2 in their study which is absent in ours (Fig. 4, left bottom panel). Finally, the AUC for HA1 and HA2 within the long fragments are reversed between the two studies with HA2 dominant in ours and HA1 dominant in theirs (Fig. 4, right middle and bottom panel).
Relative Proportion of Polyclonal Antibody Response against Various Regions and Antigenic Domains within HA
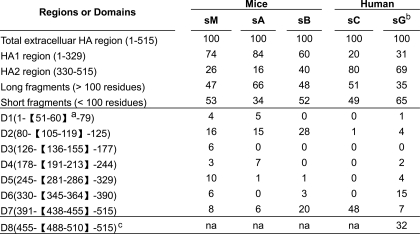
As seen in Table 1, in the sera from three mice a greater proportion of the antibody response was HA1 versus HA2 (74 versus 26%, 84 versus 16%, and 60 versus 40%), and in the recovered humans the reverse was true (20 versus 80% and 31 versus 69%). This result suggests that for the HA protein studied, HA1 is more immunogenic than HA2 in immunized mice. In recovered humans, however, the dominance of the HA2 response is likely the result of a boosting effect through multiple influenza infections where the HA2 region is more conserved than HA1 among various strains. In addition, AUC for long and short fragments in mice and humans are quite comparable with certain exceptions. For example, sA shows a larger response to the long fragments (66%), and sG shows a larger response is directed toward the short fragments (65%), suggesting a different host may mount a different proportion of polyclonal antibody response toward the linear or conformational epitopes. Furthermore, within the short fragments, domain 2 in HA1 and domain 7 in HA2 are shared by all mice and human samples, although the former is preferentially recognized in mice (16 versus 8%, 15 versus 6%, and 28 versus 20%) whereas the latter is dominant in human (1 versus 48% and 4 versus 7%). To our knowledge, this is the first time these two domains have been shown to possess the highest antigenicity in the entire HA protein. The remaining domains are variably recognized among the mice and human samples. Finally, an exceptionally dominant domain (domain 8, 31%) is identified near the C terminus of HA2 as shown by Khurana et al. (11) in a recovered human, which is distinct from those found in our study.
TABLE 1.
Percentage of antibody response against each region or domain among the total estimated by AUC
Structural Analysis of Antigenic Domains
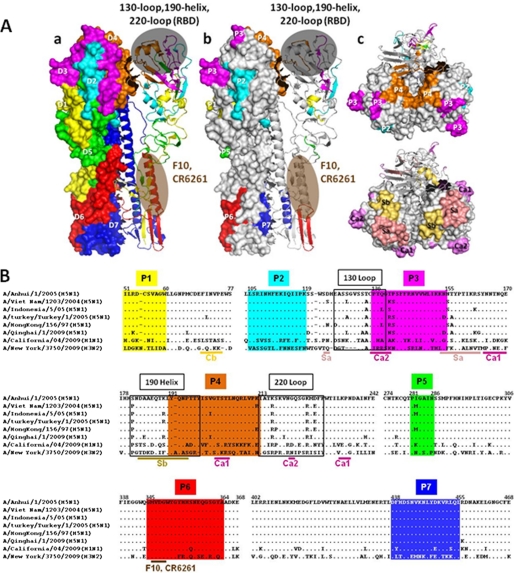
We next performed the structural analysis of the antigenic domains identified within the short fragments by superimposing each of them on a previously defined crystal structure of H5N1 HA from Vietnam (A/Vietnam/1194/04) (Fig. 5A, panel a) (21). The most strongly recognized domain 2 in mice is located in the globular head of HA1 just upstream of the receptor binding domain (21). Domain 7, which is highly recognized in both mice and recovered humans, corresponds to the helix B region in HA2 (21). Intermediately recognized domains 3 and 4 encompass the previously described 130-Loop, 190-Helix, and 220-Loop, critical for receptor binding activity (21). Domain 6 overlaps with much of the stalk of HA2 (21); this and domains 1 and 5 constitute the major epitopes recognized by several cross-reactive human antibodies with broad neutralizing activities against diverse influenza subtypes (4, 6, 9, 22, 23).
FIGURE 5.
Structural (A) and sequence (B) analysis of antigenic domains based on the short fragments and compared with those identified using other systems. Panel a, antigenic domains D1–D7 are shown in colored patches matching that in Fig. 3C on a surface-exposed and a ribbon diagram of HA monomer within the HA trimer structure (PDB code 2IBX). Receptor binding domain (RBD) was formed by 130-Loop, 190-Helix, and 220-Loop, and domains recognized by the broadly neutralizing mAb F10 and CR6261 are shaded. Panel b, stretch of 6–23 residues at the peak of each antigenic domain (P1–P7) (within dark brackets in Table 1) is shown in side view. P1–P7 reflect the strongest recognition by the polyclonal antibody response within each antigenic domain. Panel c, top view of P2–P4 on the HA trimer structure (PDB code 2IBX) (upper panel) compared with antigenic domains Ca1, Ca2, Sa, and Sb identified for H1 glycoprotein (lower panel).
We also analyzed these seven domains in relation to those previously identified (24–27). For clarity, only the stretch of 6–23 residues at the peak (P) of each antigenic domain (within a dark bracket in Table 1) is shown (Fig. 5, A, panels b and c, and B). P1 to P4 are located in the globular head of HA1 and clustered around the receptor-binding sites (Fig. 5, A and B). P1 and P2 do not overlap with any previously identified antigenic domains. P3 partially overlaps with Ca2 and Sa and P4 with Sb and Ca1 regions of H1 (Fig. 5, A, panels b and c, and B). In fact, several residues within P3 and P4 overlap with the antigenic sites identified by characterizing escape mutants of a recombinant virus against H5 (A/Vietnam/1203/04)-specific mAb (28–30). Furthermore, P5 is located at the junction of HA1 and HA2, in close proximity to the cleavage site between the two (Fig. 5B), and so far this has not been reported elsewhere. Interestingly, both P6 and P7 in HA2 are located close to the transmembrane domain (Fig. 5, A, panel b, and B) and P6 minimally overlaps with major epitopes recognized by several cross-reactive human antibodies with broad neutralizing activities against diverse influenza subtypes (Fig. 5B) (4, 22, 23). Structurally, P6 overlaps with a β-hairpin just preceding the helix A region, whereas P7 overlaps with the C terminus of the helix B region (Fig. 5A, panel b) (21). No reports have so far identified P6 and P7 as major antigenic domains except by Khurana et al. (11).
DISCUSSION
We report here the development a novel and robust technique to qualitatively and quantitatively measure polyclonal antibody response in vivo. This technique is based on the positive selection and characterization of yeast clones displaying serum/plasma-specific antigens on its surface from a large combinatorial library. Sequences obtained from the positive yeast clones are overlapping in nature and vary considerably in length and can be used to identify linear and conformational antigenic domains using algorithms for sequence scanning and clustering. The relative contribution of each antigenic domain to the overall polyclonal antibody recognition can be calculated based on the AUC. We believe that the technique provides comprehensive assessment of polyclonal antibody responses in vivo and will facilitate our better understanding of the repertoire of antibodies generated in response to infection and vaccination.
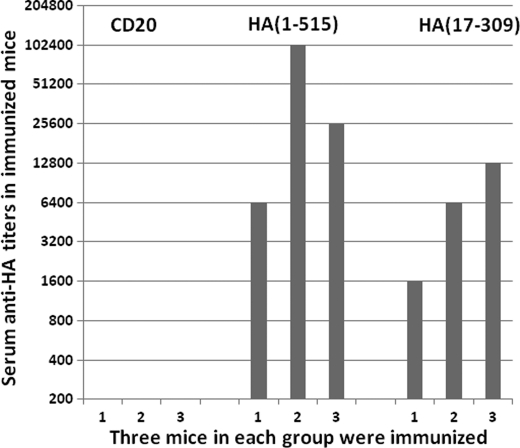
The technique and quantitative data collected here is the first of this kind for the study of polyclonal antibody response in vivo. It offers several advantages over existing techniques. First, the combinatorial antigen library displayed on the yeast surface provides substantially more antigens compared with that used in ELISA or other protein-based detection approaches. Second, the production of antigens is straightforward and cost effective through continuous culture of the yeast library. This will avoid time-consuming steps for protein production and purification. Third, as staining and detection of antigens are conducted in solution by FACS, the antigen displayed on the yeast surface and selected by the polyclonal serum would most likely reflect the intrinsic interaction between antigen and antibody within the host. This feature will minimize the confounding nonspecific interaction of polyclonal antibodies with solid surface-bound antigens used in ELISA and other assays. Fourth, the antigens displayed on the yeast surface can potentially be used to identify potential functional domains of target protein for use as an immunogen. In fact, we have used a few selected yeast clones to immunize mice and induced high levels of binding antibody responses against the full-length H5N1 HA protein (A/Anhui/1/2005) shown in Fig. 6. However, this is not to say our approach is without shortcomings. It is expected that some of the conformational epitopes, in particular those formed through inter-molecular interaction, will be lost during the fragmentation process for library construction. We have to bear this caveat in mind when we analyze the data and draw conclusions from it.
FIGURE 6.
Serum antibody responses in mice after immunization with yeast clones displaying either full-length or partial fragment of HA protein (A/Anhui/1/2005). Yeast clone displaying CD20 was used as a negative control. Numbers in parentheses indicate the starting and ending positions of displayed HA fragments (A/Anhui/1/2005).
This approach has so far been used to study only H5N1 (A/Anhui/1/2005) HA, but it is clearly applicable to proteins from various pathogens. It is therefore possible to determine the antigenic structure of a wide variety of biologically relevant antigens in infected patients or vaccine recipients. In particular, if the serum-reactive yeast clones could be formulated in an array form, it would certainly increase the throughput to analyze a large number of serum samples and to make more statistically sound conclusions. Finally, when combined with other techniques such as ELISA, neutralization, and antibody-dependent cell-mediated cytotoxicity assays, it will help us to better understand which antigenic domains are most relevant to disease progression and immune protection. This will bring us ever closer to the goal of rational vaccine and therapeutic design.
Acknowledgments
We thank Drs. K. Dane Wittrup and Annie Gai, Massachusetts Institute of Technology, for providing yeast surface display vector pCTCON2. We also thank Drs. Zhanglin Lin and Wanghui Xu, Tsinghua University, for advice and suggestions.
This work was supported, in whole or in part, by National Institutes of Health CIPRA Grant U19 AI51915. This work was also supported by National Science and Technology Major Projects 2008ZX10001-011 and 2009ZX10004-016, National Basic Research Program (also called the 973 Program) Grant 2006CB504200, the National Outstanding Youth Award 30825035, Tsinghua University Initiative Scientific Research Program, and Tsinghua Yue-Yuen Medical Sciences Fund.
- AUC
- area under the curve.
REFERENCES
- 1. Janeway C., Jr., Travers P., Walport M., Shlomchik M. (2001) in Immunobiology (Murphy M. K., Travers P. eds) Garland Science, New York [Google Scholar]
- 2. Burton D. R. (2002) Nat. Rev. Immunol. 2, 706–713 [DOI] [PubMed] [Google Scholar]
- 3. Dörner T., Radbruch A. (2007) Immunity 27, 384–392 [DOI] [PubMed] [Google Scholar]
- 4. Corti D., Suguitan A. L., Jr., Pinna D., Silacci C., Fernandez-Rodriguez B. M., Vanzetta F., Santos C., Luke C. J., Torres-Velez F. J., Temperton N. J., Weiss R. A., Sallusto F., Subbarao K., Lanzavecchia A. (2010) J. Clin. Invest. 120, 1663–1673 [DOI] [PMC free article] [PubMed] [Google Scholar]
- 5. Scheid J. F., Mouquet H., Feldhahn N., Seaman M. S., Velinzon K., Pietzsch J., Ott R. G., Anthony R. M., Zebroski H., Hurley A., Phogat A., Chakrabarti B., Li Y., Connors M., Pereyra F., Walker B. D., Wardemann H., Ho D., Wyatt R. T., Mascola J. R., Ravetch J. V., Nussenzweig M. C. (2009) Nature 458, 636–640 [DOI] [PubMed] [Google Scholar]
- 6. Wrammert J., Koutsonanos D., Li G. M., Edupuganti S., Sui J., Morrissey M., McCausland M., Skountzou I., Hornig M., Lipkin W. I., Mehta A., Razavi B., Del Rio C., Zheng N. Y., Lee J. H., Huang M., Ali Z., Kaur K., Andrews S., Amara R. R., Wang Y., Das S. R., O'Donnell C. D., Yewdell J. W., Subbarao K., Marasco W. A., Mulligan M. J., Compans R., Ahmed R., Wilson P. C. (2011) J. Exp. Med. 208, 181–193 [DOI] [PMC free article] [PubMed] [Google Scholar]
- 7. Wrammert J., Smith K., Miller J., Langley W. A., Kokko K., Larsen C., Zheng N. Y., Mays I., Garman L., Helms C., James J., Air G. M., Capra J. D., Ahmed R., Wilson P. C. (2008) Nature 453, 667–671 [DOI] [PMC free article] [PubMed] [Google Scholar]
- 8. Wu X., Yang Z. Y., Li Y., Hogerkorp C. M., Schief W. R., Seaman M. S., Zhou T., Schmidt S. D., Wu L., Xu L., Longo N. S., McKee K., O'Dell S., Louder M. K., Wycuff D. L., Feng Y., Nason M., Doria-Rose N., Connors M., Kwong P. D., Roederer M., Wyatt R. T., Nabel G. J., Mascola J. R. (2010) Science 329, 856–861 [DOI] [PMC free article] [PubMed] [Google Scholar]
- 9. Yu X., Tsibane T., McGraw P. A., House F. S., Keefer C. J., Hicar M. D., Tumpey T. M., Pappas C., Perrone L. A., Martinez O., Stevens J., Wilson I. A., Aguilar P. V., Altschuler E. L., Basler C. F., Crowe J. E., Jr. (2008) Nature 455, 532–536 [DOI] [PMC free article] [PubMed] [Google Scholar]
- 10. Khurana S., Chearwae W., Castellino F., Manischewitz J., King L. R., Honorkiewicz A., Rock M. T., Edwards K. M., Del Giudice G., Rappuoli R., Golding H. (2010) Sci. Transl. Med. 2, 15ra5 [DOI] [PubMed] [Google Scholar]
- 11. Khurana S., Suguitan A. L., Jr., Rivera Y., Simmons C. P., Lanzavecchia A., Sallusto F., Manischewitz J., King L. R., Subbarao K., Golding H. (2009) PLoS Med. 6, e1000049 [DOI] [PMC free article] [PubMed] [Google Scholar]
- 12. Boder E. T., Wittrup K. D. (1997) Nat. Biotechnol. 15, 553–557 [DOI] [PubMed] [Google Scholar]
- 13. Chao G., Lau W. L., Hackel B. J., Sazinsky S. L., Lippow S. M., Wittrup K. D. (2006) Nat. Protoc. 1, 755–768 [DOI] [PubMed] [Google Scholar]
- 14. Hoogenboom H. R. (2005) Nat. Biotechnol. 23, 1105–1116 [DOI] [PubMed] [Google Scholar]
- 15. Sun L., Lu X., Li C., Wang M., Liu Q., Li Z., Hu X., Li J., Liu F., Li Q., Belser J. A., Hancock K., Shu Y., Katz J. M., Liang M., Li D. (2009) PLoS One 4, e5476 [DOI] [PMC free article] [PubMed] [Google Scholar]
- 16. Shu Y., Yu H., Li D. (2006) N. Engl. J. Med. 354, 1421–1422 [DOI] [PubMed] [Google Scholar]
- 17. Zhou B., Zhong N., Guan Y. (2007) N. Engl. J. Med. 357, 1450–1451 [DOI] [PubMed] [Google Scholar]
- 18. Lin Z., Li S., Chen Y. (2009) Methods Mol. Biol. 515, 261–274 [DOI] [PMC free article] [PubMed] [Google Scholar]
- 19. Smith C. A., Barnett B. C., Thomas D. B., Temoltzin-Palacios F. (1991) J. Exp. Med. 173, 953–959 [DOI] [PMC free article] [PubMed] [Google Scholar]
- 20. Staudt L. M., Gerhard W. (1983) J. Exp. Med. 157, 687–704 [DOI] [PMC free article] [PubMed] [Google Scholar]
- 21. Stevens J., Blixt O., Tumpey T. M., Taubenberger J. K., Paulson J. C., Wilson I. A. (2006) Science 312, 404–410 [DOI] [PubMed] [Google Scholar]
- 22. Ekiert D. C., Bhabha G., Elsliger M. A., Friesen R. H., Jongeneelen M., Throsby M., Goudsmit J., Wilson I. A. (2009) Science 324, 246–251 [DOI] [PMC free article] [PubMed] [Google Scholar]
- 23. Sui J., Hwang W. C., Perez S., Wei G., Aird D., Chen L. M., Santelli E., Stec B., Cadwell G., Ali M., Wan H., Murakami A., Yammanuru A., Han T., Cox N. J., Bankston L. A., Donis R. O., Liddington R. C., Marasco W. A. (2009) Nat. Struct. Mol. Biol. 16, 265–273 [DOI] [PMC free article] [PubMed] [Google Scholar]
- 24. Caton A. J., Brownlee G. G., Yewdell J. W., Gerhard W. (1982) Cell 31, 417–427 [DOI] [PubMed] [Google Scholar]
- 25. Gerhard W., Yewdell J., Frankel M. E., Webster R. (1981) Nature 290, 713–717 [DOI] [PubMed] [Google Scholar]
- 26. Wiley D. C., Wilson I. A., Skehel J. J. (1981) Nature 289, 373–378 [DOI] [PubMed] [Google Scholar]
- 27. Wilson I. A., Skehel J. J., Wiley D. C. (1981) Nature 289, 366–373 [DOI] [PubMed] [Google Scholar]
- 28. Kaverin N. V., Rudneva I. A., Govorkova E. A., Timofeeva T. A., Shilov A. A., Kochergin-Nikitsky K. S., Krylov P. S., Webster R. G. (2007) J. Virol. 81, 12911–12917 [DOI] [PMC free article] [PubMed] [Google Scholar]
- 29. Kaverin N. V., Rudneva I. A., Ilyushina N. A., Varich N. L., Lipatov A. S., Smirnov Y. A., Govorkova E. A., Gitelman A. K., Lvov D. K., Webster R. G. (2002) J. Gen. Virol. 83, 2497–2505 [DOI] [PubMed] [Google Scholar]
- 30. Philpott M., Easterday B. C., Hinshaw V. S. (1989) J. Virol. 63, 3453–3458 [DOI] [PMC free article] [PubMed] [Google Scholar]


