

Abstract
Hyaluronan, a high molecular mass polysaccharide on the vertebrate cell surface and extracellular matrix, is produced at the plasma membrane by hyaluronan synthases using UDP-GlcNAc and UDP-GlcUA as substrates. The availability of these UDP-sugar substrates can limit the synthesis rate of hyaluronan. In this study, we show that the cellular level of UDP-HexNAc also controls hyaluronan synthesis by modulating the expression of HAS2 (hyaluronan synthase 2). Increasing UDP-HexNAc in HaCaT keratinocytes by adding glucosamine down-regulated HAS2 gene expression, whereas a decrease in UDP-HexNAc, realized by mannose treatment or siRNA for GFAT1 (glutamine:fructose-6-phosphate amidotransferase 1), enhanced expression of the gene. Tracing the UDP-HexNAc-initiated signal to the HAS2 promoter revealed no change in the binding of STAT3, NF-κB, and cAMP response element-binding protein, shown previously to mediate growth factor and cytokine signals on HAS2 expression. Instead, altered binding of SP1 and YY1 to the promoter correlated with cellular UDP-HexNAc content and inhibition of HAS2 expression. siRNA silencing of YY1 and SP1 confirmed their inhibitory effects on HAS2 expression. Reduced and increased levels of O-GlcNAc-modified SP1 and YY1 proteins were associated with stimulation or inhibition of HAS2 expression, respectively. Our data are consistent with the hypothesis that, by regulating the level of protein O-GlcNAc modifications, cellular UDP-HexNAc content controls HAS2 transcription and decreases the effects on hyaluronan synthesis that would result from cellular fluctuations of this substrate.
Keywords: Cell Signaling, Glucose Metabolism, Hyaluronate, O-GlcNAcylation, siRNA, Transcription Regulation, SP1, UDP-glucuronic Acid, UDP-N-acetylglucosamine, YY1
Introduction
Hyaluronan, a non-sulfated glycosaminoglycan present on the vertebrate cell surface and extracellular matrix, is involved in cellular functions, including migration, proliferation, adhesion, and various signaling systems, by its unique physicochemical properties and interactions with specific cell surface receptors (1). Hyaluronan is synthesized by HAS1–3, integral plasma membrane proteins that use cytosolic UDP-GlcNAc and UDP-GlcUA as substrates to produce the long linear hyaluronan chains. During its synthesis, the growing hyaluronan chain runs through a pore in the plasma membrane into the extracellular matrix (2).
Changes in hyaluronan production have been associated mostly with the expression level of HAS genes (3–6), especially in keratinocytes (7–13). Of the three genes, particularly HAS2 is subject to regulation by growth factors, cytokines, and hormones (4, 14, 15). In keratinocyte cultures, EGF, keratinocyte growth factor, TNFα, and retinoic acid induce, whereas TGFβ inhibits, HAS2 expression (8, 10, 13, 16). Accordingly, the HAS2 promoter has been shown to contain functional response elements (REs)3 for different transcription factors, including retinoid acid receptor, NF-κB, CREB1 (cAMP response element-binding protein 1), and SP1 (specificity protein 1) (7, 11, 16).
Besides by the protein expression of hyaluronan synthase (HAS) enzymes, hyaluronan synthesis is also controlled by the availability of the hyaluronan precursors, the substrates of HAS. Raising cellular UDP-GlcUA content stimulates hyaluronan synthesis, whereas a low concentration of UDP-GlcUA can limit the synthesis (12, 17). We have shown that the same applies to UDP-GlcNAc: limiting or increasing its content stimulates and inhibits, respectively, the synthesis of hyaluronan (18).
The cellular content of UDP-GlcNAc makes an interesting connection between hyaluronan synthesis and cellular energy metabolism. UDP-GlcNAc is a product of the hexosamine synthesis pathway, into which 2–5% of the cellular influx of glucose is shunted (19). The rate-limiting step in hexosamine synthesis from glucose to UDP-GlcNAc is considered to be the GFAT1 (glutamine:fructose-6-phosphate amidotransferase 1) and GFAT2 isoenzymes (20). The flux of glucose through the hexosamine pathway serves as a cellular sensor of glucose availability, and it regulates the expression of a number of genes probably through the cellular content of UDP-GlcNAc (19, 21). Cytosolic UDP-GlcNAc is a substrate for UDP-GlcNAc:peptide βGlcNAc-transferase, an enzyme that adds a single GlcNAc sugar unit to –OH groups of selected Thr and Ser residues of cytosolic and nuclear proteins (22). These O-GlcNAc moieties change protein functions, similar to other signaling modifications of intracellular proteins, and eventually change also gene expression (23). Indeed, a number of the dynamically O-GlcNAc-modified proteins are transcription factors (24–27). Thus, fluctuation in the content of UDP-GlcNAc substrate is supposed to change both hyaluronan synthesis and O-GlcNAc signaling of proteins.
This work was initiated following the unexpected finding that the cellular level of UDP-GlcNAc appeared to influence hyaluronan synthesis of keratinocytes not only by its serving as an essential substrate for HAS enzymes but also through regulation of HAS2 transcription. Although transcription factors shown earlier to control expression of the HAS2 gene in these cells turned out not to be involved, promoter binding of the transcription factors SP1 and YY1 (Yin-Yang 1) correlated with UDP-GlcNAc content and HAS2 gene expression.
To bind to their REs on chromatin, transcription factors need to associate with a range of transcriptional co-regulators whose functions either activate the basal transcriptional machinery or repress it. The importance of changes in primary transcription factor binding is therefore supported when co-activators such as cAMP response element-binding protein-binding protein (CBP) and p300/CBP-associated factor (PCAF) or a co-repressor such as NCoR1 (nuclear receptor co-repressor 1) is recruited to the transcription complex.
In this study, regulation of the HAS2 gene by YY1 and SP1 was further supported by the associations and dissociations of the co-activators CBP and PCAF and the co-repressor NCoR1. Furthermore, SP1 and YY1 binding to the HAS2 promoter correlated with the level of their O-GlcNAc modifications, obviously enhanced by UDP-GlcNAc, and the suppression of HAS2 expression by SP1 and YY1 was relieved by siRNA-mediated silencing of these transcription factors. The data suggest that the feedback function of UDP-GlcNAc on keratinocyte hyaluronan synthesis, through HAS2 down-regulation, is mediated by dynamic protein O-GlcNAc modifications.
EXPERIMENTAL PROCEDURES
Cell Culture
The human immortalized epidermal keratinocyte cell line HaCaT (28) was cultured in DMEM (Sigma) supplemented with 10% FBS (HyClone, Logan, UT), 2 mm l-glutamine (EuroClone, Milan, Italy), 50 units/ml penicillin (EuroClone), and 50 μg/ml streptomycin (EuroClone). Mannose and glucosamine were purchased from Sigma.
Anion Exchange HPLC
Cells were seeded on 6-cm plates and cultured until 80% confluent. After different treatments, cells from one plate were counted for normalization of the results, whereas cells from parallel plates were used to isolate and measure UDP-sugars. Cultures were washed with cold PBS on ice. Cold acetonitrile (3 ml) was added to precipitate proteins and extract the UDP-sugars, followed by the addition of 1 ml of deionized water. Cells were scraped off, and after centrifugation at 6000 × g for 20 min, the supernatant was transferred to a clean tube evaporated in a vacuum centrifuge. The dry residue was suspended in ethanol, centrifuged, supernatant saved, and dried. The samples were dissolved in water for anion exchange HPLC with a CarboPacTM PA1 column (4 × 250 mm; Dionex, Sunnyvale, CA) and eluted at 1 ml/min with a gradient of 1 mm NaOH (solvent A) and 1 m sodium acetate in 1 mm NaOH (solvent B) with detection at 260 nm. The column was equilibrated with a 80:20 (v/v) mixture of solvents A and B. Elution was performed with the following percentages of solvent B: T0 = 20%, T10 = 55%, T25 = 55%, T35 = 80%, T40 = 100%, and T50 = 100%. Integrated peak areas were measured and compared with those given by standard UDP-sugars. Because the UDP-GalNAc and UDP-GlcNAc isomers were incompletely separated in part of the samples, the results are presented as UDP-HexNAc, which includes both. Because these isomers are in an equilibrium strongly dominated by UDP-GlcNAc, the values of UDP-HexNAc reflect the changes in UDP-GlcNAc.
ELISA for Hyaluronan
Media from the cultures were assayed for the concentration of hyaluronan using a sandwich-type ELISA as described previously (13, 18).
RNA Extraction and Quantitative PCR
For the time series of HAS2 expression, total RNA was extracted with a mini RNA isolation II kit (HiSS Diagnostics GmbH, Freiburg, Germany). cDNA was prepared using 1 μg of total RNA as a template for 1 h at 37 °C with 100 pmol of oligo(dT)18 primers and 40 units of reverse transcriptase (Fermentas, Sankt Leon-Rot, Germany). Quantitative PCR was performed in an iQ cycler (Bio-Rad) using the dye SYBR Green I (Molecular Probes, Leiden, The Netherlands). Per reaction, 1 unit of Hot Start Taq polymerase and 3 mm MgCl2 were used, and the PCR cycling conditions were 40 cycles of 30 s at 95 °C, 30 s at 56 °C, and 30 s at 72 °C. Other quantitative PCR analyses were done with total RNA extracted with Eurozol (EuroClone), and quantitative PCR was performed in an MX3000P thermal cycler (Stratagene, La Jolla, CA) using an ABsoluteTM MAX two-step quantitative RT-PCR SYBR® Green kit (ABgene, Epsom, Surrey, United Kingdom). -Fold inductions were calculated using the formula 2−(ΔΔCt), where ΔΔCt is ΔCtstimulus − ΔCtsolvent, ΔCt is Ctgene of interest − CtRPLP0, and Ct is the cycle at which the threshold is crossed. The gene-specific primers for the genes analyzed are shown in supplemental Table S1. PCR product quality was monitored using post-PCR melting curve analysis.
In Silico Promoter Analysis
The first 2250 bp of the human HAS2 promoter were screened in silico for putative binding sites of different transcription factors. We have previously characterized the NF-κB, STAT3, and SP1 sites on the HAS2 promoter (7, 16). The CREB1- and YY1-binding sites on the HAS2 promoter were identified using the net-based program ConSite applying a transcription factor binding search cutoff of 85% and our own software for modified hexamer-binding site searching (retinoid acid receptor REs) (29).
ChIP Assay
Nuclear proteins were cross-linked to DNA by adding formaldehyde directly to the medium to a final concentration of 1% for 7 min at room temperature. Cross-linking was stopped by the addition of glycine to a final concentration of 0.15 m and incubation for 5 min at room temperature on a rocking platform. The medium was removed, and the cells were washed twice with ice-cold PBS and then collected in ice-cold PBS. After centrifugation, the cell pellets were resuspended in lysis buffer (1% SDS, 10 mm EDTA, protease inhibitors, and 50 mm Tris-HCl, pH 8.1), and the lysates were sonicated to obtain DNA fragments with average lengths of 300 bp. Cellular debris was removed by centrifugation at 16,000 × g for 15 min. At this step, 25 μl of the supernatant was taken as the input sample. 5 volumes of 1× immunoprecipitation dilution buffer (20 mm Tris-HCl pH 7.5, 2 mm EDTA, 1% Triton X-100, 150 mm NaCl) with protease inhibitors (Roche Applied Science) was added to the aliquots. Chromatin solutions were incubated with 5 μl of the indicated antibodies (2.5 μl of control IgG (sc-2027, Santa Cruz Biotechnology)), 25 μl of BSA (10 mg/ml), and 2.4 μl of sonicated salmon sperm (10 mg/ml) overnight at 4 °C with rotation. The antibodies against CBP (sc-369), NCoR1 (sc-8994), SMRT (sc-1610), PCAF (sc-8999), YY1 (sc-1703), p65 (sc-372), and CREB1 (sc-58) were obtained from Santa Cruz Biotechnology. The immunocomplexes were collected with 25 μl of protein G magnetic beads (Bio-Nobile, Turku, Finland) supplemented with 1 mm PMSF for 1 h at room temperature with rotation. The beads were separated from the supernatant using a magnetic rack. The pellets were resuspended in 700 μl of ChIP Wash 1 (20 mm Tris-HCl, pH 8, 2 mm EDTA, 1% Triton X-100, 150 mm NaCl, and 1 mm PMSF) and incubated on a rotating platform at room temperature for 1 min, and the beads were separated from the supernatant with the magnetic rack. This step was repeated. Next, the beads were washed with 700 μl of ChIP Wash 2 (20 mm Tris-HCl, pH 8, 2 mm EDTA, 1% Trion X-100, 0.1% SDS, 500 mm NaCl, and 1 mm PMSF) on a rotating platform for 5 min and separated by the magnetic rack, and the wash was repeated. The beads were further washed with 700 μl of ChIP Wash 3 (0.25 m LiCl, 1% Nonidet P-40, 1% deoxycholate, 1 mm EDTA, and 10 mm Tris-HCl, pH 8) for 5 min and finally washed twice with 700 μl of buffer containing 10 mm Tris-HCl and 1 mm EDTA, pH 8, for 1 min. The immunocomplexes were eluted by the addition of 200 μl of elution buffer (25 mm Tris-HCl, pH 7.5, 10 mm EDTA, and 0.5% SDS) and incubation for 30 min at 65 °C. After magnetic separation, the beads were extracted again with 200 μl of elution buffer on a rotating platform for 2 min. This 400-μl sample was the enriched output sample. Immunoprecipitation dilution buffer (370 μl) was added to the input samples, and 2.5 μl of proteinase K (Fermentas) was added to both the input and output samples and incubated overnight at 64 °C. The DNA was recovered by phenol/chloroform/isoamyl alcohol (25:24:1) extractions and precipitated with 0.1 volume of 3 m sodium acetate, pH 5.2, and 2 volumes of ethanol using glycogen as a carrier. Immunoprecipitated DNAs were then used as a template for PCR. The PCR cycling conditions were 40 cycles of 30 s at 95 °C, 30 s at the primer-specific temperature, and 30 s at 72 °C. The annealing temperature for all nine HAS2 PCR primers was 60 °C (for their sequences, see supplemental Table S2). The resulting PCR products were quantified and expressed as percent of the input control. -Fold inductions were calculated using the formula 2−(ΔCt), where ΔCt is Ctoutput − Ctinput and Ct is the cycle at which the threshold is crossed. The results are presented as -fold changes over the value of samples precipitated with normal rabbit IgG. Inputs were diluted 13.3 times compared with outputs.
Gene Silencing with siRNA
The siRNA oligosaccharides (Eurogentec, Liege, Belgium) used are listed in supplemental Table S3. Three siRNA sequences were tested, and the most effective combinations were selected. The resulting inhibition efficiencies are shown in supplemental Fig. S1. The siRNAs (30 nm) were transfected with Lipofectamine 2000 (Invitrogen) according to the instructions provided by the manufacturer, and 6 h after transfection, fresh medium was used. The siRNA-transfected cells were cultured for 24 h before the assays.
SP1 and YY1 O-GlcNAc Assay
Cells were seeded on 10-cm plates, cultured to ∼80% confluence, and treated with 20 mm mannose or 6 mm glucosamine for 6 h before total protein extraction with radioimmune precipitation assay buffer (PBS, pH 7.4, 1% Nonidet P-40, 0.5% sodium deoxycholate, 0.1% SDS, 100 μg/ml PMSF, 10 μg/ml sodium orthovanadate, and 100 μg/ml aprotinin). Total protein (500–900 μg) was incubated with 1.5 μg of anti-SP1 antibody (Santa Cruz Biotechnology or Abcam, Cambridge, United Kingdom) or anti-YY1 antibody (Cell Signaling Technology, Danvers, MA) linked to 20 μl of Protein AG magnetic beads (Ademtech, Pessac, France) or protein A/G-agarose (Santa Cruz Biotechnology) overnight at 4 °C. The beads were washed three times with PBS, and proteins were eluted by boiling in SDS sample buffer, separated by SDS-PAGE, and transferred to nitrocellulose membrane (Whatman, Dassel, Germany) by 35-mA/cm2 constant current with a semidry blotter (Biometra, Göttingen, Germany). The membrane was blocked with 3% BSA; washed with TBS and 0.1% Tween; and incubated with the primary antibody against SP1 (1:1500), YY1 (1:1500), or CTD110.6 (anti-O-GlcNAc; 1:1500; Hart laboratory). After washing, the membrane was incubated with DyLight 680-conjugated anti-rabbit (Pierce) or DyLight 800-conjugated anti-mouse (1:5000) fluorescent secondary antibody (Pierce) and visualized and quantified with Odyssey® as described above. Membranes were stripped and reprobed with either anti-SP1 or anti-CTD110.6 antibody and the corresponding secondary antibody as described above. The intensities of O-GlcNAc-modified protein and total protein were used to calculate the levels of modified SP1 and YY1 proteins.
Statistical Analysis
The general significance of differences between groups was tested using univariate analysis of variance and, if the data allowed, appropriate post hoc tests (Tukey's or Dunnett's) to compare each experimental group with its control group.
RESULTS
Mannose and Glucosamine Regulate the Content of UDP-sugars
In epidermal keratinocytes, the cellular UDP-HexNAc content responds rapidly to changes in culture conditions (18). Therefore, the medium was changed 22 h prior to the experiments to allow stabilization of the basal UDP-HexNAc content. As expected, no change was found in controls between 0 and 2 h (data not shown), whereas in just 2 h following the introduction of mannose, cellular UDP-HexNAc content was significantly depleted (Fig. 1A). However, the content of UDP-HexNAc appeared to recover nearing 24 h (Fig. 1A). The change in HexNAc by 6 mm glucosamine was also rapid; a significant increase was noted at the 2-h time point, and a further increase was observed after 6- and 24-h incubations (Fig. 1A).
FIGURE 1.

Effect of mannose and glucosamine on the dynamics of UDP-HexNAc and UDP-GlcUA content in keratinocytes. 24 h after changing to fresh medium, concentrated mannose and glucosamine were added to HaCaT cell cultures, resulting in 20 and 6 mm final concentrations, respectively. UDP-HexNAc (A) and UDP-GlcUA (B) content was analyzed in the treated and control (with no addition) cultures after 2, 6, and 24 h. The data represent means ± S.E. of five independent experiments. *, p < 0.05 (by F-test univariate analysis of variance).
Although not a direct precursor of UDP-GlcUA, glucosamine also increased this nucleotide sugar. However, the accumulation of UDP-GlcUA by glucosamine was slow, significant only at 6 h, and continued to increase until at least 24 h (Fig. 1B). The content of UDP-GlcUA was increased by mannose. This change was rapid, reaching its full effect after 2 h (Fig. 1B).
The mannose-induced depletion of UDP-HexNAc was dose-dependent, with the content gradually decreasing to ∼50% of controls at 20 mm mannose (Fig. 2A). The dose response curve of UDP-HexNAc for glucosamine showed that even 0.25 mm glucosamine significantly increased UDP-HexNAc, the content of which reached its maximum at 1 mm glucosamine (Fig. 2B).
FIGURE 2.

Concentration dependence of mannose and glucosamine modulation of UDP-HexNAc contents and hyaluronan synthesis. HaCaT cells were incubated with 0–20 mm mannose (A and C) and 0–6 mm glucosamine (B and D) for 6 h and analyzed for UDP-HexNAc content (A and B). Hyaluronan secreted in the culture medium during a 24-h period is shown in C and D. The data represent means ± S.E. of three (A and B) and five (C and D) independent experiments (each experiment with one or more replicates). Statistical significance between control and mannose- or glucosamine-treated cultures is as follows: *, p < 0.05; **, p < 0.01; ***, p < 0.001 (by Dunnett's test).
Hyaluronan Synthesis Responds to Changes in UDP-sugars
The synthesis of hyaluronan was dose-dependently reduced by mannose, down to 50–60% of the reference level at 10 mm mannose, with little further change at 15–20 mm (Fig. 2C). Notably, although mannose increased the content of UDP-GlcUA, this could not prevent the decreased synthesis of hyaluronan caused by UDP-HexNAc depletion because equimolar amounts of each substrate are needed (18).
Glucosamine stimulated hyaluronan synthesis at concentrations between 0.5 and 6 mm. The maximum increase (53%) was obtained at 1 mm glucosamine, whereas a smaller stimulation was noted at 6 mm, the difference between 1 and 6 mm being statistically significant (p = 0.04, Tukey's test) (Fig. 2D). Thus, despite the robust increase in both UDP-HexNAc and UDP-GlcUA precursors, glucosamine induced a relatively smaller increase in hyaluronan synthesis, and the increase declined at the highest glucosamine concentrations. This suggests that there are regulatory functions in the cells that counteract the surge of hyaluronan synthesis that would result from the abundance of UDP-HexNAc.
Mannose and Glucosamine Regulate the Levels of HAS2 mRNA
Because the synthesis of hyaluronan showed an attenuated response to substrate supply, we measured the expression level of HAS2 mRNA, the dominant HAS isoenzyme in these cells (16). Quantitative RT-PCR indicated that enhanced HAS2 expression took place at 20 mm mannose already after 2 h, reached a 90% increase at 6 h, and decreased to 15% after 24 h (Fig. 3). Whereas HAS2 expression increased by 120% after 2 h of stimulation with 6 mm glucosamine, incubations for 6 and 24 h revealed a steady decline to 60 and 50%, respectively, compared with untreated controls (Fig. 3). This result indicates that HAS2 mRNA has a relatively rapid turnover and suggests that the influence of UDP-sugar level on HAS2 expression is time-dependent. Nevertheless, it was evident that mannose increased the expression of HAS2 mRNA during the 24-h period examined, and the level of HAS2 mRNA was below the control level most of the time in cells treated with glucosamine.
FIGURE 3.
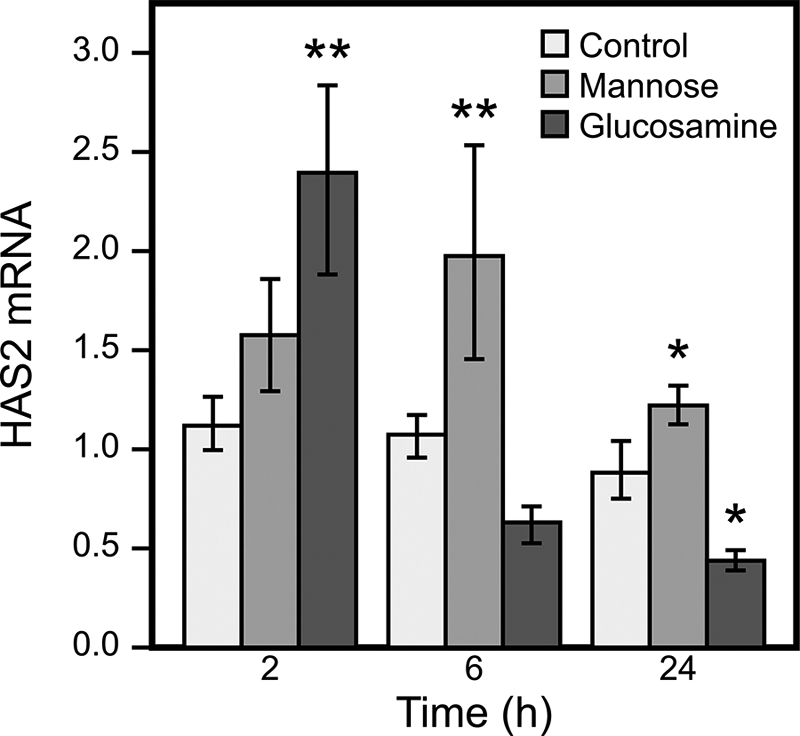
Time-dependent effects of mannose and glucosamine on HAS2 gene expression. HaCaT cell cultures were incubated with 20 mm mannose and 6 mm glucosamine for 2, 6, and 24 h, and HAS2 mRNA was analyzed by quantitative RT-PCR. The data represent means ± S.E. of three experiments (each with one or more replicates). Statistical significance between control and mannose- or glucosamine-treated cultures is as follows: *, p < 0.05; **, p < 0.01 (by Dunnett's test).
Silencing of GFAT1 Increases HAS2 Expression
The above results suggested that the concentration of UDP-HexNAc regulates HAS2 expression in a way that counterbalances its direct effect as a substrate for hyaluronan synthesis. However, mannose and glucosamine could have influences other than those on UDP-HexNAc that cause their effects on HAS2 expression. Therefore, we specifically targeted the cellular level of UDP-HexNAc by blocking the synthesis of GFAT, the enzyme considered to be most important in the pathway leading to UDP-GlcNAc production. Because HaCaT cells did not express the GFAT2 gene (data not shown), siRNA against GFAT1 was expected to inhibit the synthesis of UDP-HexNAc and reduce its content. Silencing with siRNA reduced GFAT1 mRNA very efficiently (85–90%) (supplemental Fig. 1E) and resulted in an ∼34% reduction in the content of UDP-HexNAc compared with control siRNA (Fig. 4A).
FIGURE 4.

Effect of GFAT1 siRNA on UDP-HexNAc content and HAS2 mRNA levels. A, UDP-HexNAc contents were analyzed 48 h after HaCaT cell cultures were transfected with GFAT1 siRNA. B, HAS2 mRNA levels were normalized to the control gene RPLP0 as described under “Experimental Procedures.” The data represent means ± range of two separate experiments (each with four replicate samples; A) and three separate experiments (each with five replicate samples; B). ***, p < 0.001 (control siRNA versus GFAT1 siRNA; by Dunnett's test).
As expected, GFAT1 siRNA enhanced the expression of HAS2 mRNA by ∼50% (Fig. 4B). These results confirmed that HAS2 expression is subject to regulation by cellular UDP-HexNAc metabolism.
Mechanism of UDP-HexNAc Control of HAS2 Expression
To explore the signals responsible for the modulation of HAS2 expression by UDP-HexNAc, the changes that take place on the HAS2 promoter in cells subjected to mannose and glucosamine treatments were analyzed. Several functional REs on the HAS2 promoter have been verified previously (7, 11, 16). However, following 6-h treatments with mannose and glucosamine, no changes in the recruitment of CREB1, NF-κB, and STAT3 were noted on the first 2250 bp of the promoter (data not shown), suggesting that the previously described signals related to G-protein-coupled receptors, inflammation or cell survival, and growth factors like EGF (7, 11, 16) are not part of the pathways that carry UDP-HexNAc information to HAS2 transcription.
In Silico Screening of Potential HAS2 Promoter REs
In silico screening of the first 2250 bp of the human HAS2 promoter identified, in addition to those above, eight binding sites for YY1 and 12 sites for SP1 (Fig. 5). We investigated the potential involvement of these REs as possible mediators of the UDP-HexNAc change on HAS2 expression. ChIP was performed with selected HAS2 promoter regions (for respective genomic primers, see supplemental Table S2) as described previously (16) and shown schematically in Fig. 5.
FIGURE 5.

Overview of the human HAS2 promoter and recruitment of transcription regulators. The first 2250 bp of the human HAS2 promoter were screened in silico for putative transcription factor-binding sites. The locations of the genomic regions used in ChIP assays are indicated by horizontal bars. RAR, retinoid acid receptor; STAT, signal transducer and activator of transcription.
Binding of Transcription Factors YY1 and SP1 to the HAS2 Promoter
Constitutive binding of YY1 and SP1 to the HAS2 promoter was evaluated by comparing the quantitative PCR signals of the chromatin immunoprecipitates obtained with normal rabbit IgG, marked by the horizontal lines in Fig. 6 (A and B). No significant YY1 binding was found in any region of the first 2250 bp of the HAS2 promoter under basal culture conditions, whereas SP1 binding took place in region 8 (Fig. 6A). The consensus RE for SP1 in this area actually falls within region 7, so the binding probably reflects flanking of larger DNA fragments or chromatin looping toward the more proximal SP1 REs (Fig. 5).
FIGURE 6.

Recruitment of YY1, SP1, and their cofactors to the HAS2 promoter in response to mannose and glucosamine. Chromatin was extracted from HaCaT cells that had been treated with mannose (6 h, 20 mm) or glucosamine (6 h, 6 mm) or left untreated. ChIP experiments were performed using antibodies against the transcription factors YY1 and SP1 (A) and the cofactors CBP (A), NCoR1 (B), and PCAF (B). PCR was performed with primers specific for the nine regions of the human HAS2 promoter shown in Fig. 5. PCR conducted on DNA derived from input chromatin template served as a positive control, and that of IgG-precipitated template served as a specificity control. The results represent -fold over the IgG-precipitated samples, meaning that values >1 indicate specific binding. The error bars represent the mean ± range of at least three independent experiments. Statistical significance between control and mannose- or glucosamine-treated cultures is as follows: *, p < 0.05; **, p < 0.01; ***, p < 0.001 (by Dunnett's test).
YY1 and SP1 Binding in Response to Mannose
Mannose suppressed the constitutive binding of SP1 in region 8 (Fig. 6A). In the same area (regions 7 and 8), the co-activator PCAF was increased by mannose (Fig. 6B), suggesting enhanced transcription, in line with elevated HAS2 mRNA levels.
Increased binding of YY1 was induced by mannose in region 6 of the HAS2 promoter (Fig. 6A). In the same region, binding of the co-activator CBP increased, whereas in the adjoining region 5, decreased association of CBP was observed (Fig. 6A). This shift within regions 5 and 6 thus resulted in no net change in the binding of CBP, suggesting that the increase in YY1 association with this region is neutral in its effect on transcription.
Mannose increased YY1 binding also in regions 7 and 9. These regions contain putative sites for YY1, but both experimental and control binding levels remained close to the IgG control binding level. The data are thus consistent with the idea that reduced binding of SP1 to region 8 is associated with the higher expression of HAS2 mRNA.
YY1 and SP1 Binding in Response to Glucosamine
Glucosamine induced YY1 binding to regions 5 and 6, which is consistent with the three putative YY1 REs in regions 5 and 6 (Figs. 5 and 6A). Binding was also increased in regions 7 and 9, but did not differ clearly from IgG control levels. The binding of YY1 to regions 5 and 6 was associated with a decline in CBP binding to region 5 (Fig. 6A) and a tendency to an increase in NCoR1 co-repressor association in the adjacent region 4 (Fig. 6B). CBP binding was also reduced in region 8, between the two YY1-binding regions. These changes in co-regulator association support the notion that binding of YY1 suppresses transcription of the HAS2 gene, as expected from the reduced levels of its mRNA. Glucosamine also increased YY1 binding to region 1, but the importance of this effect remains elusive because it was associated with CBP rather than with the co-repressor (Fig. 6B). Glucosamine did not significantly change the binding of SP1 to the HAS2 promoter (Fig. 6A).
Silencing of YY1 and SP1 Increases HAS2 Expression
Because the binding of YY1 and SP1 to the HAS2 promoter was strongly associated with its expression level, we investigated how the global abundance of YY1 and SP1 affects HAS2 mRNA levels. Application of siRNAs specific for SP1 and YY1 reduced their mRNA levels by 57 and 84%, respectively, resulting in a markedly lower protein content (supplemental Fig. 1, A–D). YY1 siRNA increased expression of the HAS2 gene by >2-fold, whereas SP1 silencing also induced the gene, although less than YY1 (Fig. 7). These data are consistent with the findings above that increased YY1 binding to the HAS2 promoter was inhibitory, that reduced binding of SP1 was stimulatory, and that the general effects of both YY1 and SP1 on HAS2 transcription were suppressive.
FIGURE 7.
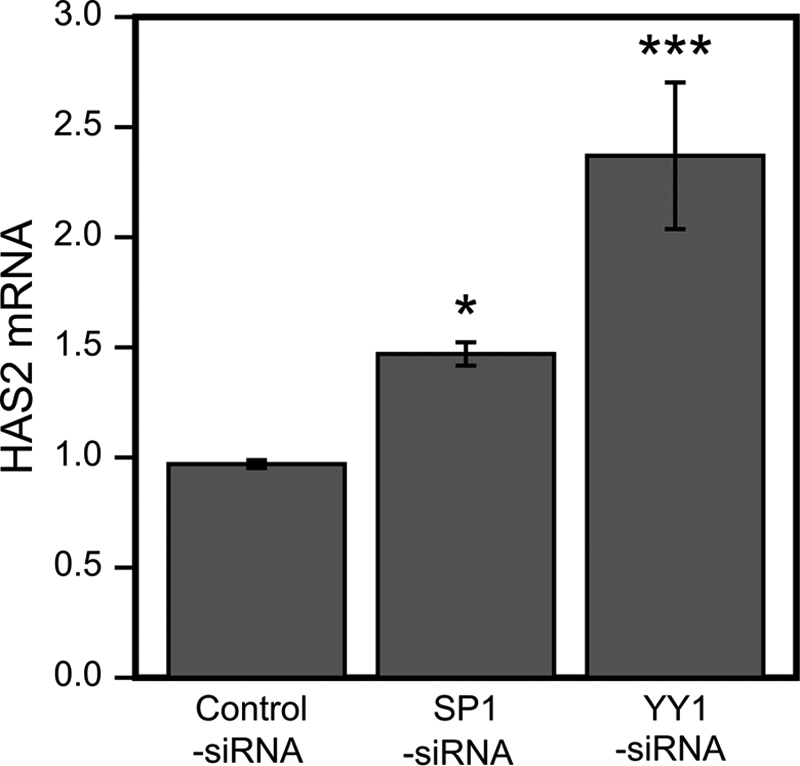
SP1 and YY1 silencing increases HAS2 mRNA. HaCaT cell cultures transfected with control, SP1, and YY1 siRNAs were analyzed for HAS2 mRNA normalized to the control gene RPLP0 as described under “Experimental Procedures.” The values are related to non-transfected cultures and represent means ± S.E. of four independent experiments (each with two replicates). Statistical significances between cultures treated with control siRNA versus SP1 and YY1 siRNA are as follows: *, p < 0.05; ***, p < 0.001 (by Dunnett's test).
Cellular UDP-HexNAc Controls the Level of O-GlcNAc on SP1 and YY1
The results indicate that the cellular level of UDP-HexNAc regulates the recruitment of SP1 and YY1 to their REs on the HAS2 promoter. This may involve post-translational modifications that control their avidities for REs and transcriptional co-regulators. Because UDP-GlcNAc is a key substrate for O-GlcNAc, a common post-translational modification, we checked the level of O-GlcNAc on immunoprecipitated SP1 and YY1 using an antibody that specifically recognizes this moiety on protein serine and threonine residues. Mannose tended to reduce, whereas glucosamine significantly increased, O-GlcNAc on SP1 (Fig. 8A) and YY1 (Fig. 8B), changes that parallel their effects on UDP-HexNAc content and HAS2 gene expression. This is consistent with the hypothesis that cellular UDP-HexNAc content controls HAS2 gene expression through protein O-GlcNAc levels.
FIGURE 8.

Effect of mannose and glucosamine on O-GlcNAc modification of SP1 and YY1. HaCaT cell cultures were incubated with 20 mm mannose and 6 mm glucosamine for 6 h, total protein was extracted, and SP1 and YY1 were immunoprecipitated. Western blots of the immunoprecipitates were analyzed with anti-O-GlcNAc and anti-SP1 or anti-YY1 antibodies, and the intensities of O-GlcNAc-modified protein and total SP1 and YY1 were measured. The data represent means ± S.E. of the ratio of band intensities between O-GlcNAc and total SP1 (A) and YY1 (B) signals in four independent experiments (each with one or more replicates). Examples of the blots are shown below the corresponding panels of SP1 and YY1. A significant difference existed between control, mannose, and glucosamine groups in SP1 (p = 0.021) and YY1 (p = 0.000) by univariate analysis of variance. *, p < 0.05; **, p < 0.01 (Dunnett's test).
DISCUSSION
In this study, we examined the effects of the UDP-sugar precursors for hyaluronan synthesis on expression of the HAS2 gene. Although mannose and glucosamine decreased and increased, respectively, the content of UDP-HexNAc, the changes in hyaluronan synthesis were not as large as those of the UDP-sugar substrates. Actually, hyaluronan synthesis in 6 mm glucosamine was less than that in 1 mm. These results are consistent with the findings that a reciprocal adjustment took place in HAS2 gene expression. The UDP-HexNAc-dependent control of HAS2 expression also works in an epidermal keratinocyte cell line derived from newborn rats (30).4
To find a mechanism for this control, we tested HAS2 promoter binding of those transcription factors that were shown previously to activate HAS2 mRNA expression following external stimuli such as hormones, cytokines, and growth factors (8–10, 13, 16). However, none of these transcription factors responded to changes in the content of UDP-HexNAc. Therefore, we also checked changes in the binding of SP1, reported previously to have putative binding sites in the HAS2 promoter (16, 31). Our in silico screens revealed that there were also binding sites for YY1, another ubiquitous transcription factor. The putative REs for both appeared functional because changes in SP1 and YY1 binding correlated with cellular UDP-HexNAc content, and their inhibition showed significant effects on HAS2 expression.
SP1 can activate and repress many genes in response to physiological and pathological stimuli (32, 33). The protein is known to be O-GlcNAcylated, and this modification regulates its effects on the expression of other genes, especially those important in insulin signaling and metabolic syndrome (32). Insulin-induced O-GlcNAcylation of SP1 causes its transition to the nucleus (34), and its glucosamine-induced glycosylation is known to protect SP1 from proteasomal degradation (35). We found that the level of O-GlcNAc on SP1 was modified according to the content of cellular UDP-HexNAc and that SP1 binding to the HAS2 promoter and expression of the HAS2 gene were inversely related to the level of O-GlcNAc in SP1. Therefore, O-GlcNAc residues on SP1 may contribute to its reduced binding to the HAS2 promoter and the derepression of the HAS2 gene.
YY1 is essential for the development of mammalian embryos, and it regulates genes involved in differentiation, DNA replication, and protein synthesis (36, 37). These housekeeping functions of YY1 agree with our findings, suggesting that it mediates changes in the cellular metabolic environment (such as UDP-HexNAc content) upon the expression of genes that need adjustments due to the metabolic milieu. In fact, glucose has been shown to enhance YY1 binding to DNA through its O-GlcNAc modification (27). Thus, our results showing that glucosamine increased O-GlcNAc modification in YY1, correlating with its increased binding to the promoter and the lower HAS2 gene expression, are in line with previous findings for YY1.
YY1 and SP1 are multifunctional proteins that can act as both transcriptional repressors and activators (36, 38), depending on cofactors, including the co-repressor NCoR1 and the co-activators CBP and PCAF. The repressive function of YY1 on HAS2 mRNA expression was in line with the finding that NCoR1 was recruited to and CBP displaced from the HAS2 promoter when YY1 binding increased. Likewise, reduced binding of SP1 was associated with enhanced binding of the co-activator PCAF to the same area of the HAS2 promoter. O-GlcNAc modification of transcription factors such as SP1 and YY1 can also determine their capacity to bind a cofactor (39), another way to influence transcription. Altogether, the concomitant changes in the binding of transcriptional co-regulators at certain promoter sites further support the role of YY1 and SP1 in HAS2 transcription.
However, our data do not exclude the possibility that the UDP-GlcNAc-mediated HAS2 regulation also involved transcription complex components other than SP1 and YY1 (40). Indeed, protein O-GlcNAc modifications have been found in histones (41); a number of other transcription factors (23), including RNA polymerase II (43); and also co-regulators (44).
Our results show for the first time, to our knowledge, that cellular UDP-HexNAc controls the expression of HAS2 mRNA. There is earlier evidence suggesting that UDP-GlcUA, the other substrate of HAS, may also influence expression of the HAS2 gene. Overexpression of UDP-glucose dehydrogenase increases the content of UDP-GlcUA and up-regulates HAS2 expression in aortic smooth muscle cells (17), and up-regulation of UDP-glucose dehydrogenase correlates with increased expression of HAS2 mRNA in human vascular smooth muscle cells (45). In contrast, depletion of UDP-GlcUA by 4-methylumbelliferone down-regulates HAS2 mRNA (12, 46). If the content of UDP-GlcUA has an impact on HAS2 mRNA expression, it seems to be positive, opposite that of UDP-GlcNAc.
Signals that may connect UDP-GlcUA levels with control of the HAS2 gene have not been investigated, but their interference with those for UDP-GlcNAc could determine the eventual metabolic control of HAS2 gene expression. The recent finding that arterial smooth muscle cells subjected to 25 mm glucose show higher expression of HAS2 mRNA than cells under normoglycemic conditions (47) could be explained by assuming that, in human arterial smooth muscle cells, UDP-GlcUA signals override UDP-GlcNAc signals. Obviously, these metabolic and gene regulation networks are very important given the fact that hyaluronan synthesized by smooth muscle cells in the arterial wall is strongly involved in the development of atherosclerotic lesions (48, 49).
The synthesis of hyaluronan by epidermal keratinocytes and its content are tightly controlled by local growth factors such as heparin-binding EGF (50) and keratinocyte growth factor (13) and systemic effectors such as cortisol (51) and retinoids (9, 11, 16, 52). Our results suggest that the metabolic state of the keratinocytes also contributes to the regulation of epidermal hyaluronan at both the substrate and gene expression levels. According to a recent report on stratified cultures of HaCaT keratinocytes, YY1 is more abundant in basal than upper cell layers (53), a finding in line with the suppressive influence of YY1 on HAS2 expression and the fact that hyaluronan content is lower in the basal than spinous cell layers of human epidermis (42). Indeed, the direct assessment of the contribution of SP1 and YY1 to keratinocyte hyaluronan production in stratifying cultures is warranted.
Supplementary Material
This work was supported by the Academy of Finland (to M. I. T. and C. C.), the Sigrid Juselius Foundation and the Cancer Center of the University of Eastern Finland (to M. I. T. and R. H. T.), the EVO (Erityisvaltionosuus) Funds of the Kuopio University Hospital and the Mizutani Foundation (to M. I. T.), and the National Glycoscience Graduate School.

The on-line version of this article (available at http://www.jbc.org) contains supplemental Fig. S1 and Tables S1–S3.
T. A. Jokela, R. Kärnä, R. H. Tammi, and M. I. Tammi, unpublished data.
- RE
- response element
- HAS
- hyaluronan synthase
- CBP
- cAMP response element-binding protein-binding protein
- PCAF
- p300/CBP-associated factor.
REFERENCES
- 1. Toole B. P. (2004) Nat. Rev. Cancer 4, 528–539 [DOI] [PubMed] [Google Scholar]
- 2. Weigel P. H., DeAngelis P. L. (2007) J. Biol. Chem. 282, 36777–36781 [DOI] [PubMed] [Google Scholar]
- 3. Kuroda K., Utani A., Hamasaki Y., Shinkai H. (2001) J. Dermatol. Sci. 26, 156–160 [DOI] [PubMed] [Google Scholar]
- 4. Jacobson A., Brinck J., Briskin M. J., Spicer A. P., Heldin P. (2000) Biochem. J. 348, 29–35 [PMC free article] [PubMed] [Google Scholar]
- 5. Yamada Y., Itano N., Hata K., Ueda M., Kimata K. (2004) J. Invest. Dermatol. 122, 631–639 [DOI] [PubMed] [Google Scholar]
- 6. Vigetti D., Rizzi M., Viola M., Karousou E., Genasetti A., Clerici M., Bartolini B., Hascall V. C., De Luca G., Passi A. (2009) Glycobiology 19, 537–546 [DOI] [PubMed] [Google Scholar]
- 7. Saavalainen K., Pasonen-Seppänen S., Dunlop T. W., Tammi R., Tammi M. I., Carlberg C. (2005) J. Biol. Chem. 280, 14636–14644 [DOI] [PubMed] [Google Scholar]
- 8. Pienimäki J. P., Rilla K., Fulop C., Sironen R. K., Karvinen S., Pasonen S., Lammi M. J., Tammi R., Hascall V. C., Tammi M. I. (2001) J. Biol. Chem. 276, 20428–20435 [DOI] [PubMed] [Google Scholar]
- 9. Pasonen-Seppänen S. M., Maytin E. V., Törrönen K. J., Hyttinen J. M., Hascall V. C., MacCallum D. K., Kultti A. H., Jokela T. A., Tammi M. I., Tammi R. H. (2008) J. Invest. Dermatol. 128, 797–807 [DOI] [PubMed] [Google Scholar]
- 10. Pasonen-Seppänen S., Karvinen S., Törrönen K., Hyttinen J. M., Jokela T., Lammi M. J., Tammi M. I., Tammi R. (2003) J. Invest. Dermatol. 120, 1038–1044 [DOI] [PubMed] [Google Scholar]
- 11. Makkonen K. M., Pasonen-Seppänen S., Törrönen K., Tammi M. I., Carlberg C. (2009) J. Biol. Chem. 284, 18270–18281 [DOI] [PMC free article] [PubMed] [Google Scholar]
- 12. Kultti A., Pasonen-Seppänen S., Jauhiainen M., Rilla K. J., Kärnä R., Pyöriä E., Tammi R. H., Tammi M. I. (2009) Exp. Cell Res. 315, 1914–1923 [DOI] [PubMed] [Google Scholar]
- 13. Karvinen S., Pasonen-Seppänen S., Hyttinen J. M., Pienimäki J. P., Törrönen K., Jokela T. A., Tammi M. I., Tammi R. (2003) J. Biol. Chem. 278, 49495–49504 [DOI] [PubMed] [Google Scholar]
- 14. Sugiura K., Su Y. Q., Eppig J. J. (2009) Mol. Reprod. Dev. 76, 537–547 [DOI] [PMC free article] [PubMed] [Google Scholar]
- 15. Richards J. S. (2005) Mol. Cell. Endocrinol. 234, 75–79 [DOI] [PubMed] [Google Scholar]
- 16. Saavalainen K., Tammi M. I., Bowen T., Schmitz M. L., Carlberg C. (2007) J. Biol. Chem. 282, 11530–11539 [DOI] [PubMed] [Google Scholar]
- 17. Vigetti D., Ori M., Viola M., Genasetti A., Karousou E., Rizzi M., Pallotti F., Nardi I., Hascall V. C., De Luca G., Passi A. (2006) J. Biol. Chem. 281, 8254–8263 [DOI] [PubMed] [Google Scholar]
- 18. Jokela T. A., Jauhiainen M., Auriola S., Kauhanen M., Tiihonen R., Tammi M. I., Tammi R. H. (2008) J. Biol. Chem. 283, 7666–7673 [DOI] [PubMed] [Google Scholar]
- 19. Schleicher E. D., Weigert C. (2000) Kidney Int. Suppl. 77, S13–S18 [DOI] [PubMed] [Google Scholar]
- 20. Marshall S., Bacote V., Traxinger R. R. (1991) J. Biol. Chem. 266, 4706–4712 [PubMed] [Google Scholar]
- 21. Hazel M., Cooksey R. C., Jones D., Parker G., Neidigh J. L., Witherbee B., Gulve E. A., McClain D. A. (2004) Endocrinology 145, 2118–2128 [DOI] [PubMed] [Google Scholar]
- 22. Comer F. I., Hart G. W. (2000) J. Biol. Chem. 275, 29179–29182 [DOI] [PubMed] [Google Scholar]
- 23. Comer F. I., Hart G. W. (1999) Biochim. Biophys. Acta 1473, 161–171 [DOI] [PubMed] [Google Scholar]
- 24. Zeidan Q., Hart G. W. (2010) J. Cell Sci. 123, 13–22 [DOI] [PMC free article] [PubMed] [Google Scholar]
- 25. Zeidan Q., Wang Z., De Maio A., Hart G. W. (2010) Mol. Biol. Cell 21, 1922–1936 [DOI] [PMC free article] [PubMed] [Google Scholar]
- 26. Ozcan S., Andrali S. S., Cantrell J. E. (2010) Biochim. Biophys. Acta 1799, 353–364 [DOI] [PMC free article] [PubMed] [Google Scholar]
- 27. Hiromura M., Choi C. H., Sabourin N. A., Jones H., Bachvarov D., Usheva A. (2003) J. Biol. Chem. 278, 14046–14052 [DOI] [PubMed] [Google Scholar]
- 28. Boukamp P., Petrussevska R. T., Breitkreutz D., Hornung J., Markham A., Fusenig N. E. (1988) J. Cell Biol. 106, 761–771 [DOI] [PMC free article] [PubMed] [Google Scholar]
- 29. Dunlop T. W., Väisänen S., Frank C., Carlberg C. (2004) J. Steroid Biochem. Mol. Biol. 89–90, 257–260 [DOI] [PubMed] [Google Scholar]
- 30. Baden H. P., Kubilus J. (1983) J. Invest. Dermatol. 81, 558–560 [DOI] [PubMed] [Google Scholar]
- 31. Monslow J., Williams J. D., Fraser D. J., Michael D. R., Foka P., Kift-Morgan A. P., Luo D. D., Fielding C. A., Craig K. J., Topley N., Jones S. A., Ramji D. P., Bowen T. (2006) J. Biol. Chem. 281, 18043–18050 [DOI] [PubMed] [Google Scholar]
- 32. Solomon S. S., Majumdar G., Martinez-Hernandez A., Raghow R. (2008) Life Sci. 83, 305–312 [DOI] [PubMed] [Google Scholar]
- 33. Tan N. Y., Khachigian L. M. (2009) Mol. Cell. Biol. 29, 2483–2488 [DOI] [PMC free article] [PubMed] [Google Scholar]
- 34. Majumdar G., Harrington A., Hungerford J., Martinez-Hernandez A., Gerling I. C., Raghow R., Solomon S. (2006) J. Biol. Chem. 281, 3642–3650 [DOI] [PubMed] [Google Scholar]
- 35. Han I., Kudlow J. E. (1997) Mol. Cell. Biol. 17, 2550–2558 [DOI] [PMC free article] [PubMed] [Google Scholar]
- 36. Shi Y., Lee J. S., Galvin K. M. (1997) Biochim. Biophys. Acta 1332, F49–F66 [DOI] [PubMed] [Google Scholar]
- 37. Gordon S., Akopyan G., Garban H., Bonavida B. (2006) Oncogene 25, 1125–1142 [DOI] [PubMed] [Google Scholar]
- 38. Wierstra I. (2008) Biochem. Biophys. Res. Commun. 372, 1–13 [DOI] [PubMed] [Google Scholar]
- 39. Gewinner C., Hart G., Zachara N., Cole R., Beisenherz-Huss C., Groner B. (2004) J. Biol. Chem. 279, 3563–3572 [DOI] [PubMed] [Google Scholar]
- 40. Thomas M. J., Seto E. (1999) Gene 236, 197–208 [DOI] [PubMed] [Google Scholar]
- 41. Sakabe K., Hart G. W. (2010) J. Biol. Chem. 285, 34460–34468 [DOI] [PMC free article] [PubMed] [Google Scholar]
- 42. Tammi R., Ripellino J. A., Margolis R. U., Tammi M. (1988) J. Invest. Dermatol. 90, 412–414 [DOI] [PubMed] [Google Scholar]
- 43. Kelly W. G., Dahmus M. E., Hart G. W. (1993) J. Biol. Chem. 268, 10416–10424 [PubMed] [Google Scholar]
- 44. Chalkley R., Thalhammer A., Schoepfer R., Burlingame A. L. (2009) Proc. Natl. Acad. Sci. U.S.A. 22, 8894–8899 [DOI] [PMC free article] [PubMed] [Google Scholar]
- 45. Maier K. G., Han X., Sadowitz B., Gentile K. L., Middleton F. A., Gahtan V. (2010) J. Vasc. Surg. 51, 1238–1247 [DOI] [PubMed] [Google Scholar]
- 46. Rilla K., Pasonen-Seppänen S., Rieppo J., Tammi M., Tammi R. (2004) J. Invest. Dermatol. 123, 708–714 [DOI] [PubMed] [Google Scholar]
- 47. Sainio A., Jokela T., Tammi M. I., Järveläinen H. (2010) Glycobiology 20, 1117–1126 [DOI] [PubMed] [Google Scholar]
- 48. Chai S., Chai Q., Danielsen C. C., Hjorth P., Nyengaard J. R., Ledet T., Yamaguchi Y., Rasmussen L. M., Wogensen L. (2005) Circ. Res. 96, 583–591 [DOI] [PubMed] [Google Scholar]
- 49. Riessen R., Wight T. N., Pastore C., Henley C., Isner J. M. (1996) Circulation 93, 1141–1147 [DOI] [PubMed] [Google Scholar]
- 50. Tammi R. H., Tammi M. I. (2009) J. Invest. Dermatol. 129, 1858–1860 [DOI] [PubMed] [Google Scholar]
- 51. Ågren U. M., Tammi M., Tammi R. (1995) J. Cell. Physiol. 164, 240–248 [DOI] [PubMed] [Google Scholar]
- 52. Tammi R., Jansén C. T., Tammi M. (1985) Arch. Dermatol. Res. 277, 276–283 [DOI] [PubMed] [Google Scholar]
- 53. Taguchi S., Kawachi Y., Ishitsuka Y., Fujisawa Y., Furuta J., Nakamura Y., Xu X., Ikebe D., Kato M., Otsuka F. (2011) J. Invest. Dermatol. 131, 37–45 [DOI] [PubMed] [Google Scholar]
Associated Data
This section collects any data citations, data availability statements, or supplementary materials included in this article.