Background: Retinoic acid (RA) receptors regulate gene expression through binding-specific response elements (RAREs).
Results: A collection of new DR5 RAREs located ±10 kb from TSSs and conserved among 6 vertebrates species or more has been amassed.
Conclusion: We provide a wider knowledge base for analyzing RA target genes.
Significance: The RA response of the conserved target genes differs between species and tissues.
Keywords: Computer Modeling, Nuclear Receptors, Retinoid, Transcription Promoter, Transcription Target Genes, Nuclear Retinoic Acid Receptors, Response Elements
Abstract
The nuclear retinoic acid receptors interact with specific retinoic acid (RA) response elements (RAREs) located in the promoters of target genes to orchestrate transcriptional networks involved in cell growth and differentiation. Here we describe a genome-wide in silico analysis of consensus DR5 RAREs based on the recurrent RGKTSA motifs. More than 15,000 DR5 RAREs were identified and analyzed for their localization and conservation in vertebrates. We selected 138 elements located ±10 kb from transcription start sites and gene ends and conserved across more than 6 species. We also validated the functionality of these RAREs by analyzing their ability to bind retinoic acid receptors (ChIP sequencing experiments) as well as the RA regulation of the corresponding genes (RNA sequencing and quantitative real time PCR experiments). Such a strategy provided a global set of high confidence RAREs expanding the known experimentally validated RAREs repertoire associated to a series of new genes involved in cell signaling, development, and tumor suppression. Finally, the present work provides a valuable knowledge base for the analysis of a wider range of RA-target genes in different species.
Introduction
Retinoic acid (RA)4 is an active derivative of vitamin A that influences a range of essential biological processes such as development and homeostasis (1–4). RA exerts its action through nuclear RA receptors (RARs), which are typical ligand-dependent regulators of transcription with a central DNA binding domain linked to a ligand binding domain (for review, see Refs. 5 and 6). In response to RA signaling, RARs heterodimerize with retinoid X receptors (RXRs) and occupy characteristic RA response elements (RAREs) located in the promoter of target genes involved in cell proliferation and differentiation. RXR/RAR heterodimer occupancy at cognate response elements is commonly a determinant of transcriptional responsiveness. Within a given cell type, binding of RXR/RAR heterodimers to RAREs can either up- or down-regulate transcription in a gene-specific manner. RAREs are composed of two direct repeats of a core hexameric motif (A/G)G(G/T)TCA. The classical RARE is a 5-bp-spaced direct repeat (referred to as a DR5), but RXR/RAR heterodimers can also bind to direct repeats separated by 2 bp (DR2) or 1 bp (DR1) (6, 7).
The development of high throughput technologies such as DNA microarrays revealed that within a given cell type or tissue, the RA response is composed of a huge and complex network of responsive genes (8–10). However, such techniques could not discriminate between direct primary and secondary target genes (which are modulated by the product of a primary target gene rather than by RXR/RAR heterodimers), and only a few of the RA target genes contained identified RAREs. More recently, chromatin immunoprecipitation coupled with array hybridization (ChIP-chip) allowed the identification of new RAR binding loci (11, 12). However, whether such loci bind RARs directly or indirectly through other bound factors could not be easily discriminated. Moreover, the identified loci do not correspond to the full repertoire, as the arrays do not represent all possible regions in a genome. The nascent genome-wide ChIP-seq (chromatin immunoprecipitation coupled with deep sequencing) technology should expand the repertoire of potential high affinity response elements (13, 14). Nevertheless, although powerful, such ChIP-based approaches are highly cell context-specific.
Now, with the availability of an increasing number of genome sequences, in silico analysis of RAREs can be also performed. The advantage of computational techniques is that it overcomes the chromatin structure and, thus, the cellular context and provides a direct glance on the whole repertoire of possible RAREs.
Here we conducted a genome-wide in silico study of RA response elements. Although RXR-RAR heterodimers can bind to DR5, DR2, or DR1 response elements, the significance and the specificity of the DR2 and DR1 is still unclear. Therefore, we focused on DR5 RAREs. Computational techniques were developed for the genome-wide identification of DR5 RAREs and for the characterization of their genomic and phylogenetic context. In this way we amassed a collection of DR5 RAREs that is conserved across vertebrate species and that was validated for its occupancy and functionally analyzed for the RA-responsiveness of the associated genes. Such a strategy allowed us to characterize a new set of high confidence conserved DR5 RAREs associated to a series of new potential RA-target genes, thus providing a wider knowledge base for the analysis of the RA response in different species.
EXPERIMENTAL PROCEDURES
Bioinformatics
In silico analyses were performed using the Genomic Context data base (GeCo).5 This data warehouse, which was already exploited in a genome-wide study of the Staf transcription factor binding sites (15), aggregates genomic, phylogenetic, and epigenomic data from different sources, allowing the high-throughput contextual characterization of a given set of genetic elements. The underlying data base of annotated genes was built by computing refGene (proteins), rnaGene (snRNA, snoRNA, tRNA, rRNA, scaRNA), kgXref tables from the University of Santa Cruz California, mirna, mirna_literature_references, mirna_mature, and literature_references tables from the Sanger Institute and piRNA file from the piRNA Database. The data base also includes sequence conservation data extracted from the University of Santa Cruz California blastZ alignments. The data base is implemented in high speed DB2 architecture called Biological Integration and Retrieval of Data (BIRD), which can quickly address the whole set of sequences, genomic features, and alignments (15). RGKTSA DR5 motifs were searched in the human (NCBI build 36, hg18)- and mouse (NCBI build 37, mm9)-masked genomes (RepeatMasker) using an in-house tool dedicated to the automatic search of short motifs and implemented in the GeCo system. The obtained motifs were subsequently characterized. For each motif, we retrieved the nearest gene and its localization as well as, if applicable, the position of the motif regarding the gene elements, exon, intron, transcription start site (TSS), and gene end (end of the last exon). Motif conservation was then analyzed on the basis of University of Santa Cruz California blastZ alignments between the human or mouse and 13 other vertebrate genomic sequences. The considered species were selected for the confidence of their sequencing, the quality of their annotation, and for their repartition through the vertebrate phylogenetic tree: zebrafish (danRer5), fugu (fr2), xenopus (xenTro2), lizard (anoCar1), chicken (galGal3), platypus (ornAna1), opossum (monDom4), dog (canFam2), horse (equCab1), cow (bosTau4), rat (rn4), rhesus (rheMac2), and chimpanzee (panTro2). We considered a motif as conserved in a given species if the region encompassing the motif in human or mouse is aligned with a genomic region of the species also containing a RGKTSA DR5 motif.
Cell Culture, RNA Extraction, and qRT-PCR
F9 and P19 mouse embryocarcinoma cells, human MCF7 cells, and zebrafish PAC2 cells were cultured according to standard conditions as previously described (16–19). RNAs were extracted and subjected to qRT-PCR as previously described (20). Transcripts were normalized according to the ribosomal protein gene RPLP0. All mouse primers are listed in supplemental Table S1. The others are available upon request.
RNA Sequencing
After isolation of total RNA, a library of template molecules suitable for high throughput DNA sequencing was created according to the instructions of Illumina. Briefly, the poly(A)-containing mRNAs were isolated from total RNA (4 mg) by two runs of purification on Sera-Mag Oligo-dT Beads (Thermoscientific) and fragmented using divalent cations and heat-catalyzed hydrolysis. Fragmented mRNAs were used as a template to synthesize single-stranded cDNA with Superscript II reverse transcriptase and random primers. After second-strand synthesis, the cDNAs went through end-repair and ligation reactions using paired-end adapter oligos from Illumina and were electrophoresed on an agarose gel. A slice containing fragments in the 300-bp range was excised, and after elution and purification, the library was amplified with 15 cycles of PCR with Illumina sequencing primers and purified using Agencourt AMPure XP beads from Beckman.
The library was then used to build clusters on the Illumina flow cell according to protocol. Image analysis and base calling was performed using the Illumina pipeline. Reads were then mapped onto the mm9/NCBI37 assembly of the mouse genome using Tophat (21). Quantification of gene expression was done using Cufflinks (22) and annotations from Ensembl release 57. For each transcript the number of FPKM (fragments/kb of transcript/million fragments mapped) was converted into raw read counts, which were added for each gene locus by using an R script that we implemented. Then data normalization and identification of significantly differentially expressed genes were performed with the method proposed by Anders and Huber (23) and implemented into the DESeq Bioconductor package. The final p values were adjusted for multiple testing according to the method proposed by Benjamini and Hochberg (24), and a cutoff p value of 0.05 was applied for finding significant responsive genes.
RESULTS
Bioinformatic Genome-wide Research of DR5 RAREs Corresponding to the RGKTSA Motif
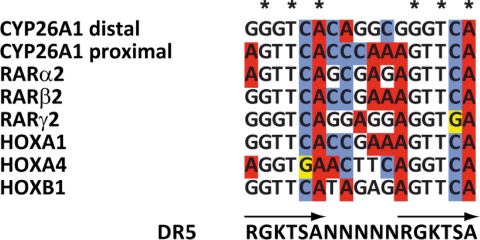
Only a few RAREs have been identified to date and associated to RA-target genes. Most of them are represented by two direct repeats of the hexameric motif (A/G)G(G/T)TCA, separated by five nucleotides (DR5) (25, 26). Such DR5s have been found in the promoters of human and mouse genes involved in RA metabolism (Cyp26A1) (27), in RA signaling (RARα2, RARβ2, RARγ2) (28–30), or in development (Hoxa1, Hoxa4, Hoxb1) (31–33). Alignment of these RAREs (Fig. 1) clearly delineates a recurrent motif RGKTSA (coding is according to the IUPAC convention: R = AG; K = GT; S = CG), which differs from the classical consensus motif RGKTCA at position 5, with a G instead of a C (in RARγ2 and Hoxa4). Therefore, with the aim of identifying novel RA-driven primary target genes, we screened the masked human and mouse genomes for DR5 corresponding to two direct repeats of the RGKTSA motif at the genome-wide scale (see “Experimental Procedures”). Such in silico screens have the potential of identifying target genes independently of their tissue of expression. We identified 15,925 DR5s corresponding to two direct repeats of the RGKTSA motif in the mouse genome and 14,571 in the human genome (supplemental Tables S2 and S3).
FIGURE 1.
Alignments of known DR5 RARE motifs in the promoters of the Cyp26A1, RARα2, RARβ2, RARγ2, Hoxa1, Hoxa4, and Hoxb1 genes and definition of a RGKTSA motif.
Conservation of the DR5 RAREs during Evolution
A way to assess the potential relevance of response elements is to determine whether they are conserved between species (phylogenetic footprinting). Indeed, highly in vivo relevant DR5 RAREs are expected to be conserved and, thus, to be under an ancient strong selective constraint. Therefore, to delineate functional RAREs, we analyzed the conservation of the human and mouse RAREs across 13 additional vertebrate organisms (see “Experimental Procedures”) by using the BlastZ alignment of the University of Santa Cruz California genome browser. Due to the shortness and the divergence of the RGKTSA sequence, the criterion of conservation was deduced from the presence/absence of the complete DR5 motif RGKTSANNNNNRGKTSA in all considered genomes. We considered that a motif was conserved in a given species if the region encompassing the motif in human or mouse is aligned with a genomic region of the species also containing a RGKTSA DR5 motif (see “Experimental Procedures”).
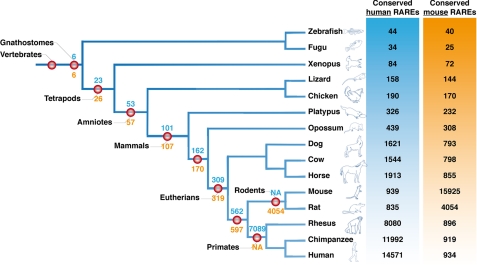
In a phylogeny of vertebrates, we visualized the number of human or mouse RAREs that are conserved in each studied species (Fig. 2). We also calculated for each relevant clade of vertebrates the number of RAREs that are conserved in all the members of these clades. Although these data can be influenced by the coverage of the studied genome (34), this analysis raised three interesting conclusions. (i) Overall, human RAREs are less conserved in rodents than in other mammals. As an example, about 900 human RAREs are conserved in the mouse genome, whereas more than 1500 are conserved in the cow genome. This is in accordance with the known increased evolutionary rates in rodents (35) but questions the use of mouse as a unique in vivo experimental system for studying RA signaling in mammals. (ii) There is a striking difference between the number of RAREs conserved in placental mammals (Eutherians) and in all mammals or in eutherians + marsupials. Indeed around 309 human RAREs (or 319 mouse RAREs) are conserved in placental mammals, whereas only half (162 human RAREs, 170 mouse RAREs) is conserved in eutherians + marsupials. The decrease is even higher if we consider the number of RAREs conserved in all mammals (101 from human and 107 from mouse genomes). This suggests that a specific elaboration of the RA regulatory network occurred in eutherians and highlights the importance of studying the corresponding RA target genes. (iii) Only six RAREs are conserved in all jawed vertebrates (gnathostomes). Three of these RAREs are associated to developmental genes, Dach1 (Daschung homolog 1) (36), Meis1 (Meis homeobox 1) (37), and TSHZ3 (Teashirt 3) (38). The three others are associated to the Gria2 (glutamate receptor 2) (39), Lphn2 (latrophilin 2) (40), and Paqr3 (an adiponectin receptor) (41) genes. It is interesting to note that, except Meis1 (8, 10, 37), these gene are not known RAR target genes. Nevertheless, they are likely to be RA-regulated in virtually any vertebrate species and thus might be considered as new interesting models.
FIGURE 2.
Phylogenetic tree of jawed vertebrates showing the phylogenetic conservation of the DR5 RAREs. On the right, the number of human RAREs (blue) or mouse RAREs (orange) conserved in each species is indicated. For example, in chimpanzee, there are 11,992 RAREs conserved from the 14,571 found in human. In contrast there are 919 RAREs conserved from the 15,925 found in the mouse genome. At each relevant node of the tree, the number of RAREs conserved in the species of the relevant node is indicated in red. The blue numbers represent the human RAREs, and the orange numbers represent the mouse RAREs. For example, in the rodent primate clade we found 562 human RAREs and 597 mouse RAREs conserved in the 5 relevant species (mouse, rat, rhesus, chimpanzee, and human). NA, not applicable.
Genome-wide Analysis of the Location of the Identified DR5 RAREs
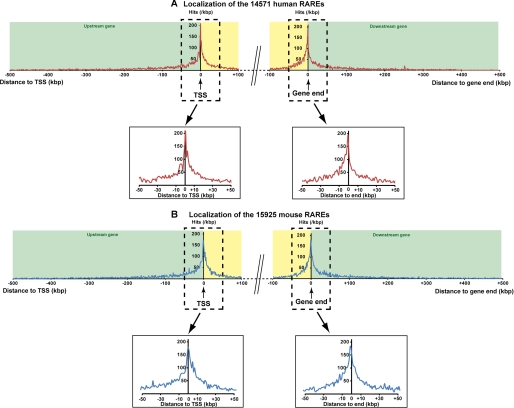
The identified mouse and human RAREs were also annotated by analyzing genome-wide their locations using the GeCo system (see “Experimental Procedures”), which allows users to retrieve the genes in the neighborhood of factor binding sites with respect to annotated Refseq genes.5 Then, in both the human and mouse genomes, the RAREs were localized relative to the nearest matched gene boundary: upstream and downstream distance from the TSS and from the end of genes. As shown in Fig. 3, A and B, the regions flanking TSSs and the ends of genes depict the highest concentration of RAREs compared with the further regions (±500 kb). This suggests that the RAREs located in the vicinity of TSSs and gene ends would be more relevant than the others, as described for most nuclear receptors and transcription factors (14, 42–46). Therefore, we selected the RAREs located between −10 and +10 kb, i.e. the RAREs ±10 kb from the TSSs and ±10 kb from gene ends. According to this criterion, 3862 RAREs were selected in the mouse genome and 3429 in the human one (supplemental Tables S2 and S3).
FIGURE 3.
Genome-wide distribution of the identified human (A) and mouse (B) DR5 RAREs. The distance between the RARE and the corresponding gene was calculated by identifying its proximity to both boundaries of the genes, the TSS, and the end (end of the last exon). Following this rule for a RARE located upstream of the TSS, the distance was calculated from the TSS and was negative. For a RARE located downstream of a gene, the distance was calculated from the end of the gene and was positive. In the case of a RARE present inside the gene, both distances to the TSS and to the end of the gene were calculated, and the minimal distance in absolute value, called dTSS*, was considered (cf. Fig. 5). The genome-wide mapping of the RARE versus a canonical gene was calculated by cumulating the number of hits present in a 1-kb sliding window from each side from the TSS or from the end of the gene (the first point being attributed to 500 bp before and after TSS or gene end). These calculations were applied to a distance of 500 kb outside of the gene and 100 kb inside of the gene.
Selection of a List of RAREs Located ±10 kb from Gene Limits and Conserved in Six Organisms or More
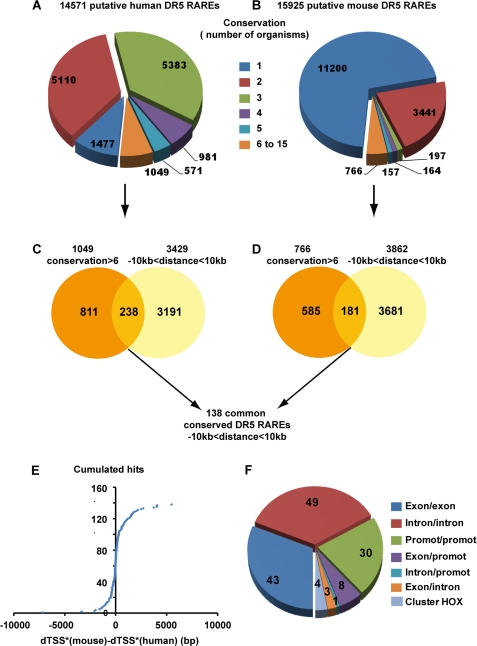
Considering the low number (6) of highly conserved RAREs and the overall repartition of the 15 organisms among the vertebrate tree, we arbitrary selected a criterion of conservation in 6 organisms. Only 7% of the human RAREs (1049 sites) (Fig. 4A) and 5% of the mouse RAREs (766 sites) (Fig. 4B) were found to be conserved in 6 organisms and more.
FIGURE 4.
Selection of 138 RAREs located ±10 kb from TSSs and gene ends and conserved in more than 6 organisms. A and B, shown is conservation of the human and mouse RAREs among the 15 organisms tested. C and D, for both the human and mouse genomes, the RAREs conserved in more than 6 organisms were crossed with those located ±10 kb from gene boundaries. Crossing the resulting mouse and human RAREs led to a list of 138 RAREs with highly confident conservation and located ±10kb. E, the differences between mouse and human dTSS* were calculated and plotted into cumulative hits. F, conservation of the RARE positions (intron, exon, and promoter) between mouse and human is shown.
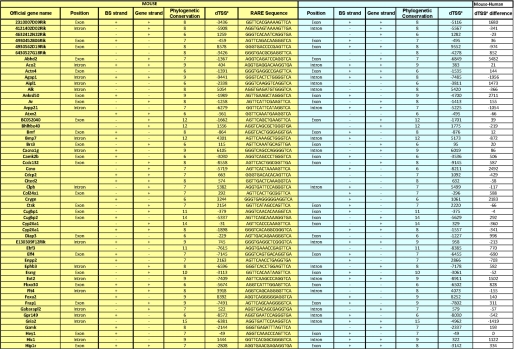
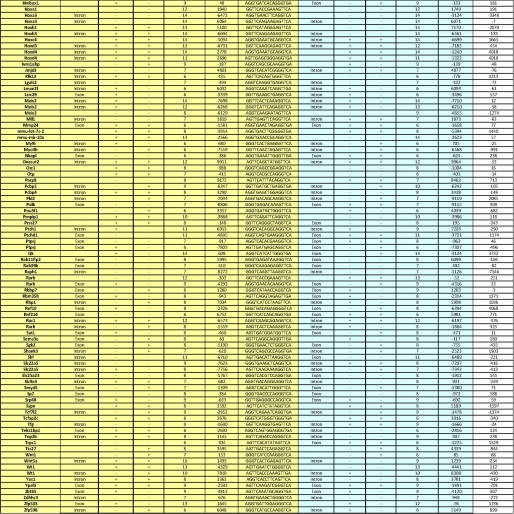
Then these human and mouse RAREs conserved across six and more organisms were further analyzed for their localization relative to the matched gene annotations. Among these RAREs, 238 human RAREs and 181 mouse RAREs were found to be located at the proximity of genes in the ±10 kb regions that we defined above (Fig. 4, C and D, and supplemental Tables 2 and 3). By using these two criteria of restriction, we obtained a list of 138 RAREs that are common to both mouse and human organisms and that are reliable in terms of genome annotation, name of the corresponding genes, localization, and conservation in more than 6 organisms (Fig. 5).
FIGURE 5.
List of the 138 conserved RAREs located ±10 kb from TSSs and genes ends. For the 138 conserved RAREs located ±10 kb, gene names and orthology were analyzed manually in both the human and mouse genomes. The sequence, localization, and dTSS* of each RARE are shown as well as the name of the associated gene. BS, binding sequence.
The orientation and localization of each conserved RARE listed in Fig. 5 were compared. Most interestingly, 100% of these RAREs showed the same orientation in the human and mouse genomes, and ∼70% showed less than a 500-bp difference in their distances to the nearest associated genes (Fig. 4E), suggesting that these RAREs are good candidates for being functional. Moreover, 43 RAREs located in exons, 49 in introns, and 30 in promoters correlated well between the two genomes (Fig. 4F). The other RAREs, although associated with a same gene in both genomes, depicted different localizations, most probably due to differences in genes annotations between the two genomes. Note that three RAREs associated with Hox genes differed between both genomes, most probably due to the complex organization and evolution of the Hox clusters.
RAR Binding to the Selected DR5 RAREs and Analysis of the Associated Genes
Then the key question to address was whether the DR5 RAREs that we selected in silico reflect biological significance in vivo; in other words, whether they are able to bind RAR/RXR heterodimers. To address this, we first crossed the list of 15,925 DR5 RAREs found in the mouse genome with the RAR and RXR binding sites mapped in ChIP-seq experiments6 performed with a mouse embryocarcinoma cell line (F9 cell lines), which is well known to respond to RA (1). In these cells, 4% of these RAREs were occupied by RAR/RXR heterodimers in the absence of RA (Table 1). This percentage increased up to 9% after 48 h of RA treatment. In fact, taking into account that some sites become occupied whereas others dissociate from RAR/RXR heterodimers in response to RA, 11% of the RAREs were found to be able to bind RAR/RXR heterodimers (Table 1). As a control, a random list of 15,925 17-bp sequences extracted from the mouse-masked genome (supplemental Table S4) was crossed with the same binding sites (Table 1). Most interestingly, the percentage of occupied RAREs increased up to 42% when the same crossing was applied to the list of 181 conserved mouse RAREs and to our final in silico list of 138 RAREs (Table 1), thus validating our strategy.
TABLE 1.
Numbers of occupied mouse DR5 RAREs in the initial list (15,925 predicted sites), the list of conserved 181 sites located ±10 kb from TSSs, and in the final list of 138 RAREs
For finding significant occupied sites, a cutoff p value of 0,00001 was applied. As a control, the same strategy was applied to a random list of 15,925 sequences of 17 kb.
| F9 cells | RAREs |
|||
|---|---|---|---|---|
| Random list | Predicted (159,25) | Conserved (181) | Final list (138) | |
| Untreated | 32 (0.2%) | 691 (4%) | 48 (26%) | 39 (28%) |
| RA 2 h | 62 | 1,109 | 49 | 45 |
| RA 24 h | 39 | 964 | 46 | 33 |
| RA 48 h | 85 | 1,523 (9%) | 71 | 55 |
| Total | 112 | 1,791 (11%) | 76 (42%) | 58 (42%) |
Among these RAREs (Table 2), 39 were occupied in the absence of RA, among which 17 depicted an important increase in their occupancy in response to RA. In addition, 19 RAREs, although unoccupied in the absence of RA, became occupied after RA addition, raising to 58 the number of RAREs that can be occupied in F9 cells. Note that the increase in occupancy started rapidly (within 2 h) or later (24–48 h) depending on the RARE.
TABLE 2.
RAR/RXR occupancy of the selected RAREs in F9 cells treated or not with RA (10−7m) for the indicated times
Some of these RAREs have been already reported to be direct RAR targets in EMSA, ChIP, or ChIP-chip experiments. It is the case for the canonical RAREs associated to the well known RA target genes involved in transcription regulation such as RARβ2, Hoxa1, Hoxb1, and Wt1 (19, 32, 47–50) or in RA metabolism (Cyp26A1, Rbp1). Most interestingly, this analysis revealed that two RAREs are associated to the RARβ2, Wt1, and Cyp26A1 genes. However, only one of the RAREs associated to the Wt1 and Cyp26A1 genes was occupied in F9 cells, whereas both RAREs associated to the RARβ2 gene were occupied. Of note is that for RARβ2, the RARE located in the promoter was more efficiently occupied than the other one, located in an exon, increasing the complexity of the transcriptional regulation of this gene in F9 cells.
Other occupied RAREs were associated to genes that are already known as RA-responsive genes but for which no RAREs had been identified yet. Among these genes are the “stimulated by RA” (Stra) genes such as Bhlhb40 (Stra13) (51), Tcfap2C (Stra2) (52), and Meis2 (Stra10) (53), and zinc finger proteins (Zfp598 and Zfp503) (8, 10). Note that three RAREs are associated to the Meis2 gene but that only two were occupied by RAR/RXR heterodimers in F9 cells. The analysis also revealed occupied RAREs associated to gene regulatory regions, which were recently found to be occupied by RARs in ChIP-chip and ChIP-qPCR experiments performed with other cell lines but without any indication whether this occupancy was direct or indirect through other bound factors (11). This is exemplified by the RAREs associated to the Atxn2, Top2b, Wnt1, and Wnt5 genes.
Most interestingly, a new repertoire of occupied RAREs was found to be associated to new potential RA target genes encoding transcription regulators (RXRβ, Jmjd3, Foxa2), several Homeobox genes belonging to clusters (Hoxa3, Hoxb3, Hoxd3), galectins (Lgals2), membrane-associated proteins (Sema3e, Abhd2, Crygn), RNA-binding proteins (Cugbp1, Qk, Srp68, Pcbp4), ATPases (Clpb), and proteins involved in cell death (Sspn), neuronal functions (Agap1), developmental processes (Otp), cell signaling (Raph1, Arpp21, Zdhhc3, Cacna1g, Camk2b, Ephb3, and Pld2), and cytoskeleton organization (Ivns1abp). RAREs were also found associated to the tumor suppressor HIC1 gene, the kallikrein-related peptidase 13 (KLK13) gene, the Myf6 gene, which belongs to the family of muscle regulatory factors, and the Prss27 gene, which encodes a membrane-anchored protease. Note that in the two latter cases, the occupation of the sites decreased after RA addition.
The other RAREs of the bioinformatics list were not occupied by RARs in F9 cells either in the absence or presence of RA. However, as RAR binding relies on the cellular and/or physiological context, one cannot exclude that these RAREs would be occupied in other cell lines or tissues or in other species.
RA Regulation of the Genes Associated to the Selected RAREs
Next we assessed whether the genes associated to the selected RAREs are RA-regulated. Our in silico screen identified 138 DR5 RAREs, but taking into account that several RAREs were found associated to a same gene, there are 129 potential RA-regulated genes. First, the set of RA-regulated genes was analyzed by high throughput qPCR sequencing (RNA-seq) using F9 cells for which we already had a list of 58 occupied DR5 RAREs. A list of 167 genes that were either induced or repressed after a 4-h treatment with RA was generated after data normalization and identification of the significant differentially expressed genes (supplemental Table S5). This list was finally reduced to 164 distinct genes after removal of the duplicated genes.
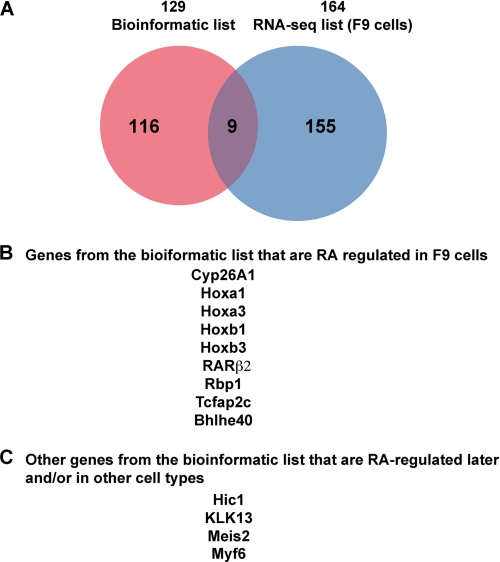
Then this list of 164 RA-regulated genes was crossed with the list of 129 RARE-associated genes raised in silico, resulting in the selection of 9 RA-responsive genes common to the two lists (Fig. 6). This list includes indeed the canonical RAR target genes (Cyp26A1, RARβ2, Rbp1, Hoxa1, and Hoxb1). It also includes two new Hox genes (Hoxa3, Hoxb3) as well as two new Stra genes, Tcfap2C and BHBLH4. In F9 cells, for all these nine RA-responsive genes, the associated DR5 RAREs were occupied by RAR/RXR heterodimers, and this occupancy was increased in response to RA (see Table 2).
FIGURE 6.
RA-responsiveness of the conserved DR5 RARE-associated genes identified in silico as assessed by RNA-seq in F9 cells. A, shown are Venn diagrams. B and C, shown is a summary of the RA-regulated genes.
Note that several other genes that are not in our bioinformatics list are activated in RA-treated F9 cells. However, some rely on other DR elements (cdx1) and/or reflect the complexity of Hox clustering (Hoxa5, Hoxb5, Hoxa4, and Hoxb2) (54–57). Others are known RA-responsive genes (1, 58–60) with DR5 RAREs (see supplemental Table S2) but are not conserved in several species (Cyp26B1, Stra6, Stra8, Foxa1, Gbx2/Stra7) or are located out of the ±10-kb limits (Gata6).
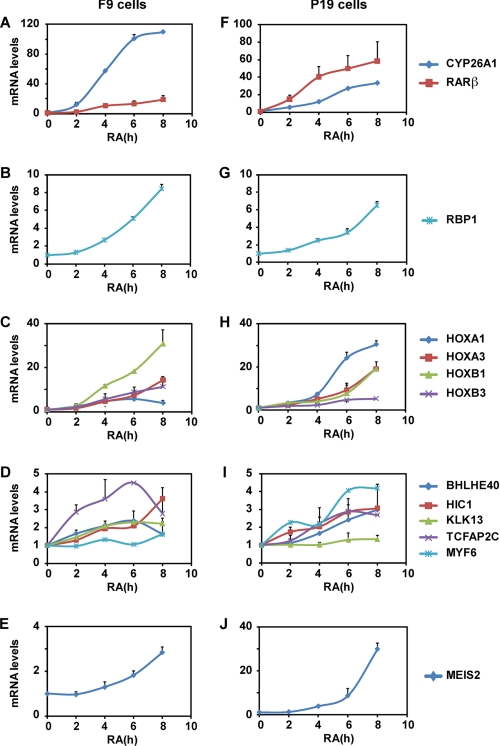
The RA-responsiveness of the genes we selected in silico was also analyzed in qRT-PCR experiments performed with F9 cells after RA treatment for different times up to 8 h. According to the confidence of the quality of their annotation and sequencing, 49 genes among the 129 genes (supplemental Table 1) were analyzed. This approach confirmed the RA inducibility of the nine genes selected above (Fig. 7, A–D). Interestingly, it also revealed that the inducibility of these genes increases with time (Fig. 7, A–D). Moreover, some additional RAR-bound genes, such as Meis2, KLK13, and HIC1, can be also activated in response to RA but with a low efficiency and at later times (8 h) (Fig. 7, D and E), raising to 12 the list of RA-responsive genes controlled by conserved DR5 RAREs and located ±10 kb from TSSs in F9 cells (Fig. 6).
FIGURE 7.
Real time RT-PCR analysis of the RA regulation of the genes associated to the conserved DR5 RAREs identified in silico in F9 (A–E) and P19 (F–J) mouse embryocarcinoma cells. The results correspond to the mean ± S.D. of three independent experiments.
Given that the RA response of target genes is well known to be cell type-specific, the same qRT-PCR experiments were performed with another RA-responsive mouse embryocarcinoma cell line, the P19 cell line. As shown in Fig. 7, F–J, the same genes were activated in response to RA, although with different intensities and kinetics. As an example, the Hoxa1 and Meis2 genes were more efficiently activated in P19 cells than in F9 cells. Note that the Myf6 gene, which was not activated in F9 cells, responded to RA in P19 cells (Fig. 7I), raising the number of RA-responsive genes to 13.
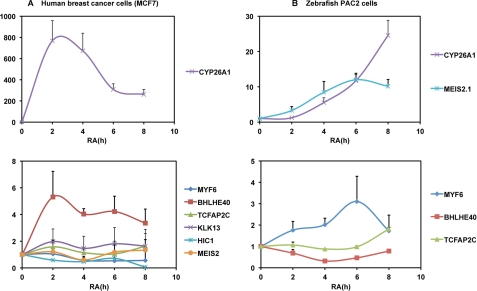
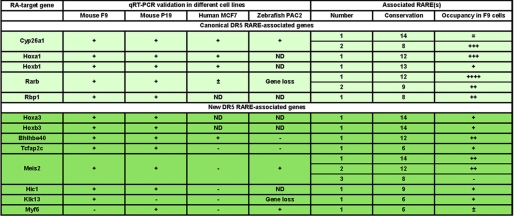
Finally, as the RAREs controlling these 13 genes are highly conserved between species (Fig. 5), we analyzed whether they also responded to RA in other cell lines from other species such as a human breast cancer cell line (MCF7 cells) (Fig. 8A) and a zebrafish cell line (PAC2) (Fig. 8B). The Bhlhe40 gene was significantly activated in MCF7 cells but not in zebrafish PAC2 cells. In contrast, Meis2 was strongly activated in PAC2 cells and not in MCF7 cells. These results are summarized in Fig. 9 and point out that the RA response of the new RARE-associated genes we identified may vary from one cell type to the other and from one species to the other.
FIGURE 8.
Real time RT-PCR analysis of the RA regulation of the genes associated to the conserved DR5 RAREs in human MCF7 (A) and zebrafish PAC2 (B) cells. The results correspond to the mean ± S.D. of three independent experiments.
FIGURE 9.
Recapitulation of the conserved DR5 RAREs that are RA-activated in mouse embryocarcinoma cells (F9 and P19 cell lines), human breast cancer cells (MCF7 cells), and a zebrafish cell line (PAC2 cells).
DISCUSSION
Here we describe a genome-wide in silico analysis of consensus DR5 RAREs with recurrent RGKTSA motifs. The advantage of such a computational approach is that it overcomes the chromatin and cellular context and thus provides a direct glance on the whole repertoire of possible RAREs. Moreover, the choice of recurrent RGKTSA motifs was expected to expand this repertoire of RAREs.
This computational study revealed around 15,000 DR5 RAREs in the human and mouse genomes. Among these RAREs, 24% are concentrated in regions located ±10 kb from the TSSs and the gene ends, and 5–7% are conserved in 6 organisms or more. It also revealed that the degree of conservation of the overall RAREs is not linear with time in the various vertebrates and that the RA gene regulatory network is specifically elaborated in specific groups. Surprisingly, this occurred specifically in placental mammals (eutherians) versus all mammals. Indeed, 3-fold more RAREs are conserved in the former than in the latter. As no major events of genomic reorganization are known to have occurred at the base of placental mammals, this elaboration might be specific to RA signaling.
Finally it provided a list of 138 RAREs located ±10 kb from TSSs and gene ends and conserved in 6 organisms or more. This list includes the majority of known RAREs, validating the restrictive criteria of our analysis. It also includes RAREs associated to “stimulated by RA” (Stra) genes for which no RAREs had been identified yet. The interesting point is that it provided a newly expanded set of high confidence conserved DR5 RAREs associated to a series of new genes involved in transcription, cell signaling, development, neuronal functions, and tumor suppression. The other interesting point is that in some cases, two to three RAREs were found to be associated to a same gene (e.g. Cyp26A1, RARβ2, and Meis2), increasing the complexity of the transcriptional regulation of these genes.
However, in silico identification of RAREs does not assure their functionality. Therefore, we combined the present computational analysis to experimental biology to determine whether the selected RAREs can bind RARs (ChIP-seq) and respond to RA (RNA-seq and qRT-PCR). Such an integrated strategy performed with mouse embryocarcinoma cells (F9 cell line) revealed that 11% of the 15,925 mouse RAREs present in the starting list were occupied by RAR/RXR heterodimers. Interestingly, this percentage increased to 40% in the final list of conserved RAREs located ±10 kb from TSSs, validating our selection strategy.
Of note is that, in F9 cells, among the 58 occupied RAREs of our final list, only 12 of the corresponding genes were rapidly activated in response to RA. These genes include indeed the canonical RA target genes (Cyp26A1, RARβ2, Rbp1, Hoxa1, Hoxb1) as well as new Hox genes (Hoxa3 and Hoxb3), Stra genes (Tcfap2c, Bhlhe40, Meis2), HIC1, and KLK13. These 12 genes were also activated in another mouse embryocarcinoma cell line (P19). However, some of them (exemplified by the Bhlhe40 and Meis2 genes) did not respond to RA in human MCF7 cells or in zebrafish PAC2 cells. In contrast, another gene, Myf6, which was occupied but not RA-responsive in F9 cells, was significantly induced in P19 cells. This corroborates that the RA regulation of target genes differs from one cell type to the other (Fig. 9), most probably in line with their chromatin context and final feature (differentiation or proliferation). In fact, the majority of the genes associated to occupied RAREs were not RA-regulated in F9 cells. This lack of RA response may be due to the fact that the genes are already expressed (and thus cannot be further stimulated). However, one cannot exclude that RA regulation requires longer times as exemplified for Zfp503 (10), specific RARE-mediated conformational changes of the bound RAR (61), and/or cross-talks with other signaling pathways (12, 62), emphasizing the complexity of the RAR-mediated regulation of gene expression.
Remarkably, the majority of the RAREs present in our in silico list were not occupied in vivo in F9 cells. This is not surprising, as RAR binding relies on the cellular and physiological context and/or may require other cell specific transcription factors (12). Thus, one can predict that the other RAREs present in the in silico list would be occupied in other appropriate cell types or tissues with the corresponding genes being RA regulated under specific conditions.
The final interesting point of this study is the identification of 6 RAREs that are conserved in all the 15 species studied. However, except the RARE associated to the Gria2 gene, all these RAREs are located out of the ±10-kb limits we defined. Moreover, none of the corresponding genes were RA-regulated in F9 cells, as assessed in RNA-seq experiments, except Meis1, which was activated 24 h after the RA addition to F9 cells (10). Nevertheless, these genes are mostly developmental genes (36–41) that are expressed in specific cell types and tissues and at specific developmental stages. Therefore, they might be new markers of the RA response, valid at specific times, in specific tissues from any jawed vertebrate species, opening new avenues for the study of RA signaling during development.
In conclusion, the novelty of the present study resides in an integrated strategy combining genome-wide biocomputing analysis and biological experiments for discovering and characterizing new RAR target genes and response elements. In addition to providing a wider valuable knowledge base for the analysis of robust RA-responsive genes, such a strategy also brought significant biological information. Indeed, it revealed (i) low conservation of RAREs between human and mouse (6%) and significant differences in the RA regulation of the highly conserved RAR target genes between species. Thus, it suggests that the RA response will differ from one species to the other as well as from one tissue to the other and under different situations. Finally, one can predict that the small set of conserved RAR direct target genes would act as key effectors of evolutionary steps.
Acknowledgments
We warmly acknowledge all members of the team and of the cell culture facilities for help. Special thanks to Regis Lutzing for qRT-PCR and to Bernard Jost and Celine Keime for RNA-seq.
This work was supported by funds from CNRS, INSERM, the Association pour la Recherche sur le Cancer (ARC 3169), the Agence Nationale pour la Recherche (ANR-05-BLAN-0390-02 and ANR-09-BLAN-0127-01), the Fondation pour la Recherche Médicale (DEQ20090515423), and the Institut National du Cancer (INCa-PLO7-96099 and PL09-194).

The on-line version of this article (available at http://www.jbc.org) contains supplemental Tables S1–S5.
Y. N. Anno, O. Poch, and O. Lecompte, manuscript in preparation.
A. Chatagnon and G. Benoit, manuscript in preparation.
- RA
- retinoic acid
- RAR
- RA receptor
- RXR
- retinoid X receptor
- DR
- direct repeat
- RARE
- RA response element
- TSS
- transcription start site
- qPCR
- quantitative PCR
- seq
- sequencing.
REFERENCES
- 1. Bour G., Taneja R., Rochette-Egly C. (2006) in Nuclear Receptors in Development (Taneja R. ed.) pp. 211–253, Elsevier Science Publishing Co., Inc., New York [Google Scholar]
- 2. Duong V., Rochette-Egly C. (2011) Biochim. Biophys. Acta 1812, 1023–1031 [DOI] [PubMed] [Google Scholar]
- 3. Mark M., Ghyselinck N. B., Chambon P. (2009) Nucl. Recept. Signal. 7, e002 [DOI] [PMC free article] [PubMed] [Google Scholar]
- 4. Samarut E., Rochette-Egly C. (2011) Mol. Cell. Endocrinol., in press [DOI] [PubMed] [Google Scholar]
- 5. Rochette-Egly C., Germain P. (2009) Nucl. Recept. Signal. 7, e005 [DOI] [PMC free article] [PubMed] [Google Scholar]
- 6. Bastien J., Rochette-Egly C. (2004) Gene 328, 1–16 [DOI] [PubMed] [Google Scholar]
- 7. Cotnoir-White D., Laperrière D., Mader S. (2011) Mol. Cell. Endocrinol. 334, 76–82 [DOI] [PubMed] [Google Scholar]
- 8. Eifert C., Sangster-Guity N., Yu L. M., Chittur S. V., Perez A. V., Tine J. A., McCormick P. J. (2006) Mol. Reprod. Dev. 73, 796–824 [DOI] [PubMed] [Google Scholar]
- 9. Harris T. M., Childs G. (2002) Funct. Integr. Genomics 2, 105–119 [DOI] [PubMed] [Google Scholar]
- 10. Su D., Gudas L. J. (2008) Biochem. Pharmacol. 75, 1129–1160 [DOI] [PMC free article] [PubMed] [Google Scholar]
- 11. Delacroix L., Moutier E., Altobelli G., Legras S., Poch O., Choukrallah M. A., Bertin I., Jost B., Davidson I. (2010) Mol. Cell. Biol. 30, 231–244 [DOI] [PMC free article] [PubMed] [Google Scholar]
- 12. Hua S., Kittler R., White K. P. (2009) Cell 137, 1259–1271 [DOI] [PMC free article] [PubMed] [Google Scholar]
- 13. Hoffman B. G., Jones S. J. (2009) J. Endocrinol. 201, 1–13 [DOI] [PubMed] [Google Scholar]
- 14. Reddy T. E., Pauli F., Sprouse R. O., Neff N. F., Newberry K. M., Garabedian M. J., Myers R. M. (2009) Genome Res. 19, 2163–2171 [DOI] [PMC free article] [PubMed] [Google Scholar]
- 15. Anno Y. N., Myslinski E., Ngondo-Mbongo R. P., Krol A., Poch O., Lecompte O., Carbon P. (2011) Nucleic Acids Res. 39, 3116–3127 [DOI] [PMC free article] [PubMed] [Google Scholar]
- 16. Rochette-Egly C., Gaub M. P., Lutz Y., Ali S., Scheuer I., Chambon P. (1992) Mol. Endocrinol. 6, 2197–2209 [DOI] [PubMed] [Google Scholar]
- 17. Taneja R., Rochette-Egly C., Plassat J. L., Penna L., Gaub M. P., Chambon P. (1997) EMBO J. 16, 6452–6465 [DOI] [PMC free article] [PubMed] [Google Scholar]
- 18. Samarut E., Amal I., Markov G., Stote R., Dejaegere A., Laudet V., Rochette-Egly C. (2011) Mol. Biol. Evol. 28, 2135–2137 [DOI] [PubMed] [Google Scholar]
- 19. Bruck N., Vitoux D., Ferry C., Duong V., Bauer A., de Thé H., Rochette-Egly C. (2009) EMBO J. 28, 34–47 [DOI] [PMC free article] [PubMed] [Google Scholar]
- 20. Bour G., Plassat J. L., Bauer A., Lalevée S., Rochette-Egly C. (2005) J. Biol. Chem. 280, 17027–17037 [DOI] [PubMed] [Google Scholar]
- 21. Trapnell C., Pachter L., Salzberg S. L. (2009) Bioinformatics 25, 1105–1111 [DOI] [PMC free article] [PubMed] [Google Scholar]
- 22. Trapnell C., Williams B. A., Pertea G., Mortazavi A., Kwan G., van Baren M. J., Salzberg S. L., Wold B. J., Pachter L. (2010) Nat. Biotechnol. 28, 511–515 [DOI] [PMC free article] [PubMed] [Google Scholar]
- 23. Anders S., Huber W. (2010) Genome Biol. 11, R106 [DOI] [PMC free article] [PubMed] [Google Scholar]
- 24. Benjamini Y., Hochberg Y. (1995) J. R. Stat. Soc. Series B Stat. Methodol. 57, 289–300 [Google Scholar]
- 25. Umesono K., Murakami K. K., Thompson C. C., Evans R. M. (1991) Cell 65, 1255–1266 [DOI] [PMC free article] [PubMed] [Google Scholar]
- 26. Leid M., Kastner P., Chambon P. (1992) Trends Biochem. Sci 17, 427–433 [DOI] [PubMed] [Google Scholar]
- 27. Loudig O., Maclean G. A., Dore N. L., Luu L., Petkovich M. (2005) Biochem. J. 392, 241–248 [DOI] [PMC free article] [PubMed] [Google Scholar]
- 28. de Thé H., Vivanco-Ruiz M. M., Tiollais P., Stunnenberg H., Dejean A. (1990) Nature 343, 177–180 [DOI] [PubMed] [Google Scholar]
- 29. Leroy P., Nakshatri H., Chambon P. (1991) Proc. Natl. Acad. Sci. U.S.A. 88, 10138–10142 [DOI] [PMC free article] [PubMed] [Google Scholar]
- 30. Lehmann J. M., Zhang X. K., Pfahl M. (1992) Mol. Cell. Biol. 12, 2976–2985 [DOI] [PMC free article] [PubMed] [Google Scholar]
- 31. Langston A. W., Gudas L. J. (1992) Mech. Dev. 38, 217–227 [DOI] [PubMed] [Google Scholar]
- 32. Huang D., Chen S. W., Langston A. W., Gudas L. J. (1998) Development 125, 3235–3246 [DOI] [PubMed] [Google Scholar]
- 33. Doerksen L. F., Bhattacharya A., Kannan P., Pratt D., Tainsky M. A. (1996) Nucleic Acids Res. 24, 2849–2856 [DOI] [PMC free article] [PubMed] [Google Scholar]
- 34. Milinkovitch M. C., Helaers R., Depiereux E., Tzika A. C., Gabaldón T. (2010) Genome Biol 11, R16 [DOI] [PMC free article] [PubMed] [Google Scholar]
- 35. Bromham L., Penny D. (2003) Nat. Rev. Genet. 4, 216–224 [DOI] [PubMed] [Google Scholar]
- 36. Jing Y., Machon O., Hampl A., Dvorak P., Xing Y., Krauss S. (2011) Cell. Mol. Neurobiol. 31, 715–727 [DOI] [PMC free article] [PubMed] [Google Scholar]
- 37. Mercader N., Leonardo E., Piedra M. E., Martínez-A C., Ros M. A., Torres M. (2000) Development 127, 3961–3970 [DOI] [PubMed] [Google Scholar]
- 38. Faralli H., Martin E., Coré N., Liu Q. C., Filippi P., Dilworth F. J., Caubit X., Fasano L. (2011) J. Biol. Chem. 286, 23498–23510 [DOI] [PMC free article] [PubMed] [Google Scholar]
- 39. Mead A. N., Stephens D. N. (2003) J. Neurosci. 23, 9500–9507 [DOI] [PMC free article] [PubMed] [Google Scholar]
- 40. Xing Y., Nakamura Y., Rainey W. E. (2009) Mol. Cell. Endocrinol. 300, 43–50 [DOI] [PMC free article] [PubMed] [Google Scholar]
- 41. Garitaonandia I., Smith J. L., Kupchak B. R., Lyons T. J. (2009) J. Recept. Signal. Transduct. Res. 29, 67–73 [DOI] [PMC free article] [PubMed] [Google Scholar]
- 42. Lin C. Y., Ström A., Vega V. B., Kong S. L., Yeo A. L., Thomsen J. S., Chan W. C., Doray B., Bangarusamy D. K., Ramasamy A., Vergara L. A., Tang S., Chong A., Bajic V. B., Miller L. D., Gustafsson J. A., Liu E. T. (2004) Genome Biol. 5, R66 [DOI] [PMC free article] [PubMed] [Google Scholar]
- 43. Smeenk L., van Heeringen S. J., Koeppel M., van Driel M. A., Bartels S. J., Akkers R. C., Denissov S., Stunnenberg H. G., Lohrum M. (2008) Nucleic Acids Res. 36, 3639–3654 [DOI] [PMC free article] [PubMed] [Google Scholar]
- 44. Carroll J. S., Meyer C. A., Song J., Li W., Geistlinger T. R., Eeckhoute J., Brodsky A. S., Keeton E. K., Fertuck K. C., Hall G. F., Wang Q., Bekiranov S., Sementchenko V., Fox E. A., Silver P. A., Gingeras T. R., Liu X. S., Brown M. (2006) Nat. Genet. 38, 1289–1297 [DOI] [PubMed] [Google Scholar]
- 45. Carroll J. S., Brown M. (2006) Mol. Endocrinol. 20, 1707–1714 [DOI] [PubMed] [Google Scholar]
- 46. Fullwood M. J., Liu M. H., Pan Y. F., Liu J., Xu H., Mohamed Y. B., Orlov Y. L., Velkov S., Ho A., Mei P. H., Chew E. G., Huang P. Y., Welboren W. J., Han Y., Ooi H. S., Ariyaratne P. N., Vega V. B., Luo Y., Tan P. Y., Choy P. Y., Wansa K. D., Zhao B., Lim K. S., Leow S. C., Yow J. S., Joseph R., Li H., Desai K. V., Thomsen J. S., Lee Y. K., Karuturi R. K., Herve T., Bourque G., Stunnenberg H. G., Ruan X., Cacheux-Rataboul V., Sung W. K., Liu E. T., Wei C. L., Cheung E., Ruan Y. (2009) Nature 462, 58–64 [DOI] [PMC free article] [PubMed] [Google Scholar]
- 47. Bollig F., Perner B., Besenbeck B., Köthe S., Ebert C., Taudien S., Englert C. (2009) Development 136, 2883–2892 [DOI] [PubMed] [Google Scholar]
- 48. Gillespie R. F., Gudas L. J. (2007) J. Biol. Chem. 282, 33421–33434 [DOI] [PubMed] [Google Scholar]
- 49. Gillespie R. F., Gudas L. J. (2007) J. Mol. Biol. 372, 298–316 [DOI] [PMC free article] [PubMed] [Google Scholar]
- 50. Lalevée S., Bour G., Quinternet M., Samarut E., Kessler P., Vitorino M., Bruck N., Delsuc M. A., Vonesch J. L., Kieffer B., Rochette-Egly C. (2010) FASEB J. 24, 4523–4534 [DOI] [PubMed] [Google Scholar]
- 51. Boudjelal M., Taneja R., Matsubara S., Bouillet P., Dolle P., Chambon P. (1997) Genes Dev. 11, 2052–2065 [DOI] [PMC free article] [PubMed] [Google Scholar]
- 52. Oulad-Abdelghani M., Bouillet P., Chazaud C., Dollé P., Chambon P. (1996) Exp. Cell Res. 225, 338–347 [DOI] [PubMed] [Google Scholar]
- 53. Oulad-Abdelghani M., Chazaud C., Bouillet P., Sapin V., Chambon P., Dollé P. (1997) Dev. Dyn. 210, 173–183 [DOI] [PubMed] [Google Scholar]
- 54. Lickert H., Kemler R. (2002) Dev. Dyn. 225, 216–220 [DOI] [PubMed] [Google Scholar]
- 55. Tabariès S., Lapointe J., Besch T., Carter M., Woollard J., Tuggle C. K., Jeannotte L. (2005) Mol. Cell. Biol. 25, 1389–1401 [DOI] [PMC free article] [PubMed] [Google Scholar]
- 56. Coulombe Y., Lemieux M., Moreau J., Aubin J., Joksimovic M., Bérubé-Simard F. A., Tabariès S., Boucherat O., Guillou F., Larochelle C., Tuggle C. K., Jeannotte L. (2010) PLoS One 5, e10600 [DOI] [PMC free article] [PubMed] [Google Scholar]
- 57. Balmer J. E., Blomhoff R. (2005) J. Steroid Biochem. Mol. Biol. 96, 347–354 [DOI] [PubMed] [Google Scholar]
- 58. Bouillet P., Sapin V., Chazaud C., Messaddeq N., Décimo D., Dollé P., Chambon P. (1997) Mech. Dev. 63, 173–186 [DOI] [PubMed] [Google Scholar]
- 59. Bouillet P., Chazaud C., Oulad-Abdelghani M., Dollé P., Chambon P. (1995) Dev. Dyn. 204, 372–382 [DOI] [PubMed] [Google Scholar]
- 60. Oulad-Abdelghani M., Bouillet P., Décimo D., Gansmuller A., Heyberger S., Dollé P., Bronner S., Lutz Y., Chambon P. (1996) J. Cell Biol. 135, 469–477 [DOI] [PMC free article] [PubMed] [Google Scholar]
- 61. Meijsing S. H., Pufall M. A., So A. Y., Bates D. L., Chen L., Yamamoto K. R. (2009) Science 324, 407–410 [DOI] [PMC free article] [PubMed] [Google Scholar]
- 62. Ross-Innes C. S., Stark R., Holmes K. A., Schmidt D., Spyrou C., Russell R., Massie C. E., Vowler S. L., Eldridge M., Carroll J. S. (2010) Genes Dev. 24, 171–182 [DOI] [PMC free article] [PubMed] [Google Scholar]


