

Abstract
Respiring mitochondria produce H2O2 continuously. When production exceeds scavenging, H2O2 emission occurs, endangering cell functions. The mitochondrial peroxidase peroxiredoxin-3 reduces H2O2 to water using reducing equivalents from NADPH supplied by thioredoxin-2 (Trx2) and, ultimately, thioredoxin reductase-2 (TrxR2). Here, the contribution of this mitochondrial thioredoxin system to the control of H2O2 emission was studied in isolated mitochondria and cardiomyocytes from mouse or guinea pig heart. Energization of mitochondria by the addition of glutamate/malate resulted in a 10-fold decrease in the ratio of oxidized to reduced Trx2. This shift in redox state was accompanied by an increase in NAD(P)H and was dependent on TrxR2 activity. Inhibition of TrxR2 in isolated mitochondria by auranofin resulted in increased H2O2 emission, an effect that was seen under both forward and reverse electron transport. This effect was independent of changes in NAD(P)H or membrane potential. The effects of auranofin were reproduced in cardiomyocytes; superoxide and H2O2 levels increased, but similarly, there was no effect on NAD(P)H or membrane potential. These data show that energization of mitochondria increases the antioxidant potential of the TrxR2/Trx2 system and that inhibition of TrxR2 results in increased H2O2 emission through a mechanism that is independent of changes in other redox couples.
Keywords: Glutathione, Mitochondria, Reactive Oxygen Species (ROS), Thioredoxin, Thioredoxin Reductase, NAD(P)H, Auranofin, Cardiomyocytes, Forward and Reverse Electron Transport, Mitochondrial Membrane Potential
Introduction
Reactive oxygen species (ROS)3 are continuously produced by respiring mitochondria through the reaction of molecular oxygen with respiratory complexes from the electron transport chain generating superoxide (O2⨪) (1, 2). Subsequent dismutation of O2⨪ by superoxide dismutase generates hydrogen peroxide (H2O2), which can, in turn, affect cell function by reacting with thiol residues in redox-sensitive proteins in either the mitochondria or cytoplasm. Under redox balanced conditions, mitochondrial H2O2 production is offset by the scavenging capacity of the GSH and thioredoxin-2 (Trx2) antioxidant systems. The Trx2 and GSH systems buffer H2O2 via peroxiredoxin-3 (Prx3) (3, 4) and glutathione peroxidase-1 and -4 (5), respectively. The other H2O2 scavenger, catalase, is present in very low concentrations in the mitochondria (6, 7). Both GSH and Trx2 require a continuous supply of NADPH-dependent reducing equivalents from GSH reductase and mitochondrial thioredoxin reductase-2 (TrxR2) (8–10). In addition to having common substrates and cofactors, GSH- and Trx2-dependent antioxidant systems may substitute for one another to maintain certain cell functions (11). Mounting evidence indicates that these two systems are not completely redundant, however, and that the flow of electrons through each system is independently regulated (12–14).
When the rate of superoxide production exceeds the scavenging capacity of the antioxidant systems, H2O2 emission from the mitochondria will increase (9, 15, 16). The importance of the antioxidant systems is highlighted by the observation that H2O2 emission from the mitochondria into the cytoplasm will occur if TrxR2 is inhibited in rat liver (17). In the heart, there may be an even more dramatic impact of TrxR2 on ROS emission and overall cell function due to the high rate of mitochondrial respiration in this organ. However, this possibility has yet to be investigated. This issue is relevant to human health, where uncontrolled mitochondrial ROS emission is increasingly recognized as a causative factor for many cardiac disorders (18–21), both acute (e.g. ischemia/reperfusion injury) (22) and chronic (e.g. congestive heart failure) (23).
Intriguingly, although the expression of the enzymatic scavenger GSH reductase is highly conserved in aerobic life (24), its genetic knockdown results in viable mice (25). Conversely, ablation of either the Trx2 or TrxR2 gene confers a lethal embryonic phenotype (26, 27), and cardiac tissue-restricted ablation of TrxR2 results in fatal dilated cardiomyopathy (26). That Trx2 contributes to protection against oxidative stress is epitomized by the fact that its overexpression in human HEK-293 cells results in enhanced ΔΨm and increased resistance to oxidative stress induced by tert-butyl hydroperoxide (28). Therefore, Trx2 and TrxR2 play crucial roles in development and survival, and changes in this system likely contribute to cardiac dysfunction in response to oxidative stress.
The relative contribution of the GSH and Trx2 systems in controlling ROS levels in the heart is still unclear. GSH is more abundant, with concentrations in the millimolar range (29), whereas Trx2 is present at low micromolar levels (3). Recently, it was shown in brain and liver mitochondria that the GSH redox state became much more reducing when respiratory substrates were provided, explaining at least in part why energized mitochondria were protected from an extrinsic oxidative stress (30). Whether mitochondrial energy status will alter the redox state of Trx2 (and thus the function of the TrxR2/Trx2 system) is currently unknown.
Here, we investigated the possibility that TrxR2 controls H2O2 emission by controlling the levels of reduced (active) Trx2 and Prx3. Trx2 became more reduced upon provision of respiratory substrates. The TrxR2 inhibitor auranofin (AF) blocked the reduction of Trx2, increased the oxidation of Prx3, and increased emission of H2O2 from mitochondria but had no effect on the redox states of GSH or NAD(P)H. Similar effects were obtained when ventricular cardiomyocytes were treated with AF. Incubation of mitochondria with 1-chloro-2,4-dinitrobenzene (DNCB) also increased ROS emission but did so by depleting GSH levels in the absence of any effect on Trx2 or Prx3. Our study demonstrates that inhibiting TrxR2 alters mitochondrial redox balance and increases H2O2 emission. This occurs without altering GSH or NAD(P)H levels and without affecting energetics. Energized mitochondria display more reduced Trx2. The latter appears as a means of self-protection against oxidative stress while rendering the organelle less prone to H2O2 emission.
EXPERIMENTAL PROCEDURES
Mitochondrial Isolation from Heart
Mitochondrial isolation and handling from guinea pig heart were performed as described (31). The same procedure was utilized for isolating mitochondria from mouse heart but with slight modifications (see supplemental “Methods”). Mitochondrial protein concentrations were determined using the bicinchoninic acid method (BCATM protein assay kit, Thermo Scientific).
Monitoring Mitochondrial Physiology
NAD(P)H, GSH, and ΔΨm were monitored simultaneously with a spectrofluorometer (Photon Technology, Inc.) as described (16). H2O2 was detected utilizing the Amplex Red kit from Invitrogen (Carlsbad, CA) (16).
Cardiomyocyte Isolation and Fluorescent Probes
Ventricular cardiomyocytes from guinea pig or mouse were handled as described (32–34). Before imaging, cells were loaded with the fluorescent probes 5(6)-chloromethyl-2′,7′-dichlorohydrofluorescein diacetate (CM-H2DCFDA; 2 μm) and MitoSOX (2 μm) or with CM-H2DCFDA and tetramethylrhodamine methyl ester (100 nm) on the stage of the microscope and incubated for at least 20 min at 37 °C. H2O2 and O2⨪ were monitored simultaneously.
Determination of TrxR2 Activity
To prepare mitochondrial extracts, mitochondria were suspended in buffer A (100 mm potassium phosphate (pH 7.0), 2 mm EDTA, and protease inhibitors (Complete, Roche Applied Science)) and subjected to three sequential freeze/thaw cycles between an ethanol dry ice bath and a 37 °C water bath. Membranes were sedimented by centrifugation at 14,000 × g for 2 min, and the supernatant was recovered for further analysis. The protein concentration was obtained using the BCA protein assay (Pierce). The activity of TrxR2 was determined using a modified version of the protocol published by Arnér and Holmgren (35), which excludes the use of BSA (BSA is known to bind and sequester AF). Briefly, ∼20 μg of mitochondrial extract was added to buffer A containing 3.33 mm 5,5′-dithiobis(2-nitrobenzoic acid) (DTNB) and 200 μm NADPH. The relative rate of reduction of DTNB at ΔA412 nm was recorded under base-line conditions or after the addition of increasing AF concentrations.
Processing Isolated Mitochondria for Trx2, Prx3, and GSH Detection
Mitochondrial suspensions (100–200 μg of mitochondrial protein) were precipitated with ice-cold TCA (10%, w/v) for 1 h on ice. Samples were then centrifuged at 21,000 × g for 15 min; the pellet was further processed for determining Trx2 and Prx3 redox status, whereas after neutralization, the supernatant was utilized for quantifying GSH.
Redox Western Blot Analysis
Redox Western blotting was performed to determine the proportion of Trx2 that was either in the reduced (Trx(SH)2) or oxidized (TrxSS) form (36). The mitochondrial pellet after TCA precipitation was washed with acetone (−20 °C) and centrifuged at 21,000 × g for 10 min. Acetone was removed, and the pellet was solubilized in labeling buffer (670 mm Tris-HCl (pH 7.5), 2% SDS, 1 mm EDTA, and 10 mm AMS (Invitrogen)) and incubated at 37 °C for 1 h. Samples were precipitated as before with TCA and washed with acetone, followed by molecular weight separation by 15% polyacrylamide gel electrophoresis with nonreducing loading buffer. Western blotting was performed using a rabbit anti-Trx2 polyclonal antibody (1:2000 dilution; AbFrontier) and an IRDye 800CW-labeled donkey anti-mouse secondary antibody (1:5000 dilution; LI-COR Biosciences). A mouse anti-Prx3 monoclonal antibody (clone 12B, Abcam) was used at 1:2500 dilution. Secondary antibodies were used at a 1:5000 (goat anti-rabbit with Alexa Fluor 680 dye, Invitrogen) or 1:10,000 (donkey anti-mouse with IRDye 800CW, LI-COR Biosciences) dilution.
The oxidized form of Prx3 (dimer) was confirmed by incubating samples with DTT (65 mm) and observing the collapse (∼90%) of the two dimeric bands into the bottom migrating band, which corresponds to the monomeric form of Prx3 (supplemental Fig. S4). Membranes were scanned using an Odyssey scanner (LI-COR Biosciences) with band densitometry performed using NIH ImageJ software (version 1.452q). The levels of both Trx(SH)2 and TrxSS were determined by integrated intensity after background subtraction from a blank portion of the membrane. The portion of reduced Trx2 was determined as the integrated intensity of Trx(SH)2/(TrxSS + Trx(SH)2). A similar procedure was utilized to quantify Prx3.
Redox Potential of Mitochondrial Thioredoxin
The redox potential of the thioredoxin redox couple was calculated according to the Nernst potential. In the case of the couple TrxSS/Trx(SH)2, for the half-cell reaction Trx(SH)2 → TrxSS + H+ + 2e−, the redox potential is described by Equation 1 (37),
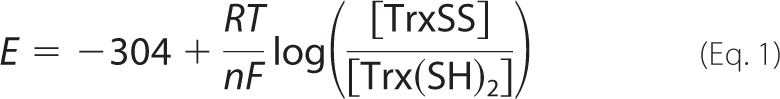 |
where E stands for the electrochemical potential of the hemi-redox reaction of oxidized over reduced thioredoxin; −304 is the standard redox potential (expressed in millivolts) at 37 °C and 1 bar, adjusting the published value of −292 (at pH 7.0) to reflect the pH (7.2) utilized in our experiments with isolated mitochondria (13); R is the universal gas constant; T is temperature in Kelvin degrees; n is the number of electrons required to reduce the oxidized form of the couple; and F is the Faraday constant that stands for the charge of 1 mole of electrons. RT/nF under our conditions is 61.51/2.
The redox status of thioredoxin as the ratio (in percentage) of TrxSS to Trx(SH)2 was determined by redox Western blotting as described above (36). Thus, when the ratio is 80/20%, the redox potential is −285 mV.
GSH Detection
The supernatant of mitochondria after TCA precipitation was neutralized to pH 7.4 after the addition of 1 m Tris-HCl at pH 8.0. (Usually, 385 μl of 1 m Tris-HCl (pH 8.0) was added to 200 μl of TCA supernatant.) The pH was verified with a pH indicator because the alkaline condition is crucial for GSH detection later. To quantify GSH in these samples, we utilized fluorescent labeling of thiols with N-(4-(7-diethylamino-4-methylcoumarin-3-yl)phenyl)maleimide and a method described previously (38) that we adapted to our conditions. This highly sensitive, non-enzymatic assay allows detection of picomole levels of GSH. N-(4-(7-Diethylamino-4-methylcoumarin-3-yl)phenyl)maleimide (60 μm) reacts quickly (within seconds) and specifically with GSH (with GSSG remaining undetected), and the fluorescent product was monitored with the spectrofluorometer at λex = 384 nm and λem = 475 nm. The rate of reaction of N-(4-(7-diethylamino-4-methylcoumarin-3-yl)phenyl)maleimide with GSH is linear within 10–50 nm (20–100 pmol of GSH). Additional controls showed that >85% recovery of GSH was possible when known amounts of the latter were subjected to the same procedure as the mitochondria. Previously, we measured the mitochondrial volume with a radioactive tracer method under state 4 respiration (∼2 μl/mg of mitochondrial protein) (31). Using this value and the amount of protein from which GSH was extracted, we could estimate its concentration in the matrix in the range of 1–1.5 mm. This value is similar to those found in brain mitochondria with glutamate/malate (∼2 mm, calculated using the mitochondrial volume above) (31) and appears reasonable considering the 2.7 mm intracellular GSH determined before in ventricular cardiomyocytes (32).
Mitochondrial AF Uptake Determined by Inductively Coupled Plasma Mass Spectrometry (ICP-MS)
Mitochondria were isolated and handled under the same conditions described for analyzing H2O2 emission and the redox status of Trx2. Immediately after isolation, mitochondria (0.73 mg of mitochondrial protein) were incubated in the absence (control) or presence of 1 μm AF with assay buffer containing 5 mm glutamate/malate for 5 min at room temperature with gentle shaking. After incubation, mitochondria were centrifuged twice at 14,000 × g for 2 min, and the two supernatants (from AF incubation) were kept for further analysis. The mitochondrial pellets of both control and AF-incubated mitochondria were resuspended in water and subjected in parallel to three freeze/thaw cycles of 3 min each under the same conditions described above for preparing mitochondrial extracts. Thereafter, mitochondrial suspensions were centrifuged at 14,000 × g for 2 min, and the supernatant and pellet from both control and AF-treated mitochondria were collected for further analysis. Samples (100 μl) from the two washout supernatants and after freeze/thaw, obtained from the AF-treated mitochondrial pellets, were diluted 1:10 with deionized water to give a working volume of 1 ml for ICP-MS analysis. The two pellets after freeze/thaw (both control and AF-treated) were dissolved in 2 ml of 60% aqua regia at 80 °C for 36 h and analyzed in full by ICP-MS. Gold analysis was carried out using a Thermo ICP-MS X7 series. The linearity in the response of the gold signal was calibrated with a set of gold standards at nanograms/ml, and the samples were analyzed four times with the ICP-MS system. We recovered 95% of the total gold (from AF) added initially (150 ng of AF). (The molecular weight ratio of AF to gold (679.5:197) is 3.45; thus, to determine the amount of AF, the gold in nanograms/ml is multiplied by 3.45.)
Statistical Analysis
Data were analyzed with GraphPad Prism software (version 3). The statistical significance of the differences between treatments was evaluated by one-way analysis of variance using Tukey's multiple comparison test. The kinetic parameters of the rates of H2O2 emission in the presence of inhibitors were determined through nonlinear regression analysis performed with a Levenberg-Marquardt algorithm (MicroCal OriginTM).
Materials
AF ((1-thio-β-d-glucopyranosato)(triethylphosphine)gold 2,3,4,6-tetraacetate), DNCB, and DTNB were purchased from Sigma. CM-H2DCFDA, MitoSOX, tetramethylrhodamine methyl ester, AMS, N-(4-(7-diethylamino-4-methylcoumarin-3-yl)phenyl)maleimide, and Amplex Red were obtained from Invitrogen. All other reagents were purchased from Sigma.
RESULTS
We first assessed the effect of inhibiting TrxR2 imparted by the two inhibitors (AF and DNCB) in heart mitochondria. The relative TrxR2 activity as a function of dose is shown in Fig. 1. AF strongly inhibited TrxR2 activity with an inhibition constant (IC50) of 8.7 nm and noticeable effects starting at 1 nm. Conversely, the effect of DNCB on TrxR2 was much weaker; at 10 μm DNCB, TrxR2 still had preserved >70% of its activity.
FIGURE 1.

Activity assay for TrxR2 in mitochondrial extracts. Extracts were obtained from freshly isolated mouse mitochondria, and the TrxR2 activity was determined using the NADPH-dependent reduction of DTNB by TrxR2. Shown is the relative rate of change with respect to the control in the reduction of DTNB at 412 nm under either base-line conditions or following the addition of varying concentrations of AF or DNCB. The IC50 was determined after nonlinear regression fitting of the experimental points with a single first order exponential equation.
Next, we tested the effects of inhibiting TrxR2 on H2O2 emission. Freshly isolated mitochondria from mouse or guinea pig hearts were preincubated with varying concentrations of AF or DNCB, and the rate of H2O2 release was determined (Fig. 2, A and C). In mouse mitochondria respiring under forward electron transport (FET; 5 mm each glutamate and malate), the presence of AF substantially increased ROS emission. The maximal rate of H2O2 emission (Vmax) and K0.5 (i.e. the amount of AF at which 50% of Vmax occurs) were 707 ± 65 pmol/min/mg of protein and 1.32 ± 0.5 nm, respectively (Fig. 2). Similar results were observed in mitochondria from guinea pig (Vmax = 994 ± 49 pmol/min/mg of protein and K0.5 = 4.8 ± 0.95 nm) (supplemental Fig. S1), where AF also produced a large increase in H2O2 emission under reverse electron transport (5 mm succinate) (supplemental Fig. S2).
FIGURE 2.

Effect of AF or DNCB on H2O2 emission from mitochondria under FET. Freshly isolated mitochondria (100–200 μg of mitochondrial protein) from mouse heart were preincubated in the absence or presence of the indicated concentrations of AF (A and B) or DNCB (C and D) in the presence of the NADH-linked substrates glutamate and malate (G/M; 5 mm each). Monitoring of H2O2 was performed with the Amplex Red assay during state 4 and the transition to state 3 of mitochondrial respiration (see Fig. 3) (16). Shown are the normalized values of Amplex Red fluorescence. Exogenous H2O2 (50 nm) was added for calibration purposes. Represented are the results of a typical experiment of three independent ones. The increase in specific H2O2 emission (calculated from the slopes of H2O2 detected by Amplex Red) during both states 4 and 3 is shown (B and D). The K0.5 was determined after nonlinear regression fitting of the experimental points with a hyperbolic Michaelis-Menten type of equation.
As a highly lipophilic agent, AF should be easily taken up by mitochondria. To ascertain this idea, we utilized ICP-MS to detect the presence of gold in the membrane and matrix fractions from isolated mitochondria treated with AF (1 μm). Following AF incubation, 80 ± 1.5% of the gold (from AF) was taken up by mitochondria. After ICP-MS analysis, we were able to recover 95 ± 2% of this gold fraction that was partitioned as follows: 14 ± 1.2% in the mitochondrial matrix and 84 ± 5% bound to membranes. Thus, due to its lipophilic nature, AF (probably through gold) remains largely attached to membrane, where it can inhibit TrxR2 vicinal to the membrane. In addition, a portion of it will enter the matrix, where it can interact with and inhibit the majority of TrxR2.
DNCB also increased ROS emission from isolated mitochondria, albeit at concentrations much greater than for AF (Fig. 2C). Under FET conditions, DNCB produced ≈10-fold higher H2O2 emission from mouse mitochondria with a K0.5 ∼3 orders of magnitude greater than AF (0.93 ± 0.27 μm versus 1.32 ± 0.53 nm, respectively) (Fig. 2, B and D).
Next, we tested whether, in addition to exacerbated ROS emission, inhibiting TrxR2 via AF may lead to impaired mitochondrial energetics and affect other scavenging systems, namely GSH. The increase in ROS release elicited by AF had no consequences for mitochondrial energetics or redox status. The dynamic responses of ΔΨm (Fig. 3, A and B), NADH (Fig. 3C), and GSH (Fig. 3D) in guinea pigs (Fig. 3, A and D) or mice (Fig. 3, B and C) were unaffected by 5 nm AF.
FIGURE 3.

Redox and energetic behavior of mitochondria in the presence of AF. Freshly isolated mitochondria from guinea pigs (GP) or mice were loaded with 20 μm monochlorobimane (a GSH fluorescent reporter), and ΔΨm (A and B), NADH (C), and GSH (D) were monitored simultaneously. Representative traces from three independent experiments are shown. St 4, state 4; St 3, state 3; G/M, glutamate/malate. E, energized; NE, non-energized.
The observed increase in H2O2 emission appears to be catalase-independent. Indeed, activation of the H2O2 flux by AF was not affected by aminotriazole (supplemental Fig. S5), a well known catalase inhibitor (39, 40), thus ruling out a major role for this enzyme. These findings support previous reports showing that catalase is present in the low nanomolar range in mitochondria (6), thus ∼3 orders of magnitude below the concentration of Trx2 (3).
Next, we tested the hypothesis that the redox status of Trx2 correlates with the energization level of the mitochondria and that this will be inhibited by AF. To this end, isolated mitochondria were treated with AF under non-energized (base line), state 4, or state 3 conditions. We then analyzed the redox status of the Trx2 pool in intact functional mitochondria with respect to controls run in parallel by redox Western blotting. This approach allowed us to set precise physiological conditions (e.g. energized versus non-energized) and to determine the effects on multiple variables related to mitochondrial energetics and redox balance. Because the reducing power of Trx2 is determined by the ratio of the oxidized to reduced form (TrxSS/Trx(SH)2), we calculated this ratio and expressed it as redox potential according to the Nernst equation (see “Experimental Procedures”). The redox potential of Trx2 decreased (became more reducing) from −322 mV at base line to −350 mV in state 4 and state 3 mitochondria (Fig. 4C). This corresponds to a 10-fold decrease in the ratio of oxidized to reduced Trx2 (Fig. 4A) and a 2.4-fold increase in the percentage of the Trx2 pool in the reduced form (Fig. 4B). In the mitochondrial matrix, Trx(SH)2 rose in parallel with NAD(P)H and GSH as well as ΔΨm after glutamate/malate addition (Fig. 3). Trx(SH)2 remained as high in state 3 as in state 4, although NAD(P)H was more oxidized in state 3. Excessive H2O2 emission resulting from TrxR2 inhibition would likely be due to oxidation of its downstream effectors. As such, we tested whether varying the concentration of AF or DNCB would affect the oxidation of Trx2 or Prx3 in respiring mitochondria. Furthermore, we also examined the level of GSH in these same samples. AF displayed a strong effect on the redox state of Trx2 (Fig. 5B) and Prx3 (Fig. 6A) but had no significant effect on GSH (Fig. 5A). However, the AF concentrations that resulted in these changes were higher than those that increased H2O2 emission (Fig. 2). In contrast, DNCB did not affect Trx2 (Fig. 5E) or Prx3 (Fig. 6B) but significantly decreased GSH at a concentration of 1 μm (Fig. 5D), the same concentration that produced half-maximal ROS emission (Fig. 2D). At this concentration, DNCB inhibited only ∼20% of TrxR2 activity (Fig. 1). This is consistent with earlier reports showing that DNCB can inhibit TrxR (41) and deplete GSH via conjugation (42). Therefore, under the conditions used here, the impact of AF on H2O2 emission was mediated by Trx2 and Prx3, whereas the effects of DNCB appeared to be largely mediated by GSH depletion rather than Trx2/Prx3 oxidation.
FIGURE 4.

Redox status of the thioredoxin system determined in intact functional mouse heart mitochondria after inhibition of TrxR2 with AF. Freshly isolated heart mitochondria from the C57BLKS/J mouse strain were handled and assayed according to the protocol described under supplemental “Methods.” TrxSS and Trx(SH)2 were determined in intact mitochondria under the same conditions described in the legend of Fig. 2. Non-energized and energized mitochondria in state 4 or 3 of respiration in the absence or presence of 100 nm AF were processed and analyzed for Trx(SH)2 and TrxSS by redox Western blotting. A, representative result obtained by redox Western blotting of Trx2 in the absence or presence of 100 nm AF. B and C, percentage of Trx(SH)2 and the redox potential, respectively, in the presence or absence of 100 nm AF. The percentage of Trx(SH)2 and the redox potential were calculated as described under “Experimental Procedures” (n = six experiments). Notice that the scale of redox potential in C (in millivolts) is reported in positive values only for convenience reasons, but they should be read as negative. B, base line (non-energized); St 4, state 4 of respiration (5 mm glutamate/malate); St 3, state 3 of respiration (1 mm ADP). **, p < 0.01; ***, p < 0.001.
FIGURE 5.

Dose response of AF- or DNCB-elicited change in the redox state of Trx2 and the concentration of GSH. Freshly isolated mitochondria from mouse heart were subjected to the same dose range of AF or DNCB, and the concentration of GSH (A and D) and redox status of Trx2 (B, C, E, and F) were monitored in parallel (n = 4). C and F, representative redox Western blotting. All variables were analyzed in mitochondria in state 4 respiration (5 mm glutamate/malate (G/M)), with the control containing only the substrates but without inhibitor. **, p < 0.01; ***, p < 0.001.
FIGURE 6.

Dose response of AF or DNCB to Prx3 redox status. Under the same experimental conditions described in the legend of Fig. 5, we analyzed the redox status of Prx3 in the presence of increasing concentrations of AF (A) or DNCB (B). Upper panels, reduced Prx3 (Prx3(SH)2); lower panels, representative Western blots. Prx3(SS), oxidized Prx3.
The results with isolated mitochondria predict that increased H2O2 emission from mitochondria will translate into an increase in H2O2 in the cytoplasm. To confirm that TrxR inhibition would lead to higher intracellular ROS levels, intact cardiomyocytes were loaded with CM-H2DCFDA (a H2O2 probe) and MitoSOX (a O2⨪ sensor) and treated with AF. When these cells were imaged by two-photon laser scanning fluorescence microscopy, an expected increase in ROS levels was observed (Fig. 7). Also in agreement with the results in isolated mitochondria, AF had no effect on ΔΨm or NAD(P)H levels in intact cardiomyocytes (Fig. 7B).
FIGURE 7.

Effect of acute addition of AF on ROS levels in intact cardiomyocytes. Cardiomyocytes isolated from mouse heart were simultaneously loaded with CM-H2DCF and MitoSOX or with CM-H2DCFDA, tetramethylrhodamine methyl ester (TMRM; ΔΨm probe), and autofluorescence (NADH) and imaged by two-photon laser scanning fluorescence microscopy as described under “Experimental Procedures.” The increase in whole cell fluorescence shown after acute addition of 10 nm AF was obtained from four different cells in the same microscopic field. Similar results were obtained in three independent experiments.
DISCUSSION
The main goal of this study was to demonstrate that the TrxR2/Trx2 system is a major controller of the rate of H2O2 emission flux from mitochondria under physiological conditions in the mammalian heart. The second aim was to demonstrate that the energization status of mitochondria correlates with the redox status of Trx2. To this purpose, we examined the effect of inhibiting TrxR2 on mitochondrial H2O2 emission and the redox state of Trx2 in respiring mitochondria. Two inhibitors, AF and DNCB, were used for this purpose.
AF is an established anti-rheumatoid gold(I) drug that also exhibits anticancer activity (43, 44). TrxR2 shares with TrxR1 the presence of selenium at the active site, although they have different sequences (45). Selenols bind more efficiently to heavy metals, and this fact explains the targeting of the selenocysteine of TrxR1 or TrxR2 by organic gold inhibitors such as AF (46, 47). In contrast, DNCB is an alkylating agent that has been shown to inhibit TrxR irreversibly (41, 48) or deplete GSH (49). We have demonstrated here that (at the concentrations used) the increased ROS due to AF is due to its action on the thioredoxin system, whereas ROS emission provoked by DNCB results largely from the depletion of GSH.
Previous reports have shown that AF stimulates H2O2 emission under a combination of forward or reverse electron transport and respiratory inhibitors in mitochondria isolated from rat liver (17) or heart (50). However, this was not observed under FET alone, which represents the physiological mode of respiration. Here, we have demonstrated that in the heart and under this mode of respiration, the impact of inhibiting the TrxR2 system with AF is larger than reported previously. This is in keeping with our initial hypothesis that due to the sustained oxidative metabolism of the heart, the effect of TrxR2 inhibition would be more pronounced.
The concentrations of AF necessary to increase H2O2 emission and inhibit TrxR2 activity in mitochondrial matrix extracts were very similar as shown by their respective IC50 and K0.5. This is further supported by our in vitro activity measurements on purified TrxR from rat liver (supplemental Fig. S3), which showed an IC50 of 5.6 nm AF, similar to the 4 nm determined for TrxR from human placenta (51) or the ∼1 nm or 2.5 nm reported for TrxR1 or TrxR2, respectively (52). These data suggest that TrxR2 is the major antioxidant target of AF in the mitochondria.
Recent crystallographic data obtained with thioredoxin-glutathione reductase from Schistosoma mansoni incubated with AF have shown that the mechanism of inhibition is via gold released from AF and that the role of selenium at the onset of inhibition by AF is catalytic (53). Consistent with this mechanism, we have shown herein that AF has no effect on the redox state of Trx2 under base-line conditions in which the mitochondrial NAD(P)H pool is oxidized and therefore unable to reduce the active site of TrxR2.
In energized mitochondria, in which NAD(P)H was reduced, Trx2 was not completely oxidized when AF was added. Potential explanations of this result are that (i) TrxR2 inhibition was incomplete in the presence of 100 nm AF, (ii) Trx2 may be reduced by another system independent of TrxR2, or (iii) AF acted on a distinct submitochondrial pool of TrxR2 to increase ROS emission. At this stage, we cannot rule out a potential role of antioxidant systems within the intermembrane space, where TrxR2 (54), TrxR1 (55), and other cytoplasmic antioxidants such as the GSH system (56) and copper/zinc-superoxide dismutase (SOD1) (55) are represented. This certainly warrants future investigation.
Regarding the redox status of Prx3 in response to AF and DNCB, earlier data obtained in cells showed that both AF and DNCB can inhibit TrxR and oxidize Prx3, but these results were obtained with micromolar concentrations of both inhibitors (57). Our results are in partial agreement with this report in that in the range of 5–30 μm, DNCB severely depletes mitochondrial GSH (42). This is probably through GSH-DNCB conjugation catalyzed by glutathione S-transferase (49). However, our present data obtained in the nanomolar range show that whereas AF oxidizes Trx2 and Prx3 without affecting GSH, DNCB decreases GSH without affecting Trx2 or Prx3 redox state (Figs. 5 and 6). Thus, under the physiological mode of respiration used in our assay conditions, it was possible to sort out the different inhibitory mechanisms exhibited by AF and DNCB in the nanomolar range. A caveat to this interpretation is that it has been reported that DNCB-modified TrxR will develop NADPH oxidase activity that produces superoxide and H2O2 in vitro (41). However, this is not likely to be the case under our conditions, as >70% enzyme activity still remained following DNCB treatment, and as such, only a small fraction of TrxR2 may have this activity.
Taken together, these data deepen our understanding of the relevance of the TrxR2/Trx2/Prx3 system in controlling mitochondrial redox balance. Moreover, we have shown that the GSH levels did not change in response to the AF concentrations used herein. These results raise the question of the relative contributions of the GSH and thioredoxin systems in controlling the cellular and mitochondrial redox milieu. Previous studies have shown a clear link between GSH depletion and H2O2 and O2⨪ generation in mitochondria and cells (16, 32, 42). Apparently, a certain threshold of GSH depletion (≈30–40%) needs to be attained in heart mitochondria before H2O2 emission can manifest (42). This value is in keeping with our present measurements. Decreasing GSH regeneration through inhibition of GSH reductase (16) (or via direct GSH depletion with DNCB (42)) does not increase H2O2 emission under FET, a condition in which ROS generation is typically very low. These results reinforce our interpretation of the main result of this work: that the TrxR2/Trx2/Prx3 system exhibits high control over ROS emission from mitochondria. This is particularly striking due to the different abundance in mitochondria of the two antioxidant systems. In agreement with previously reported values (37), our measurements indicate that the mitochondrial GSH pool is 1–1.5 mm, whereas Trx2 has been estimated to be ∼10 μm (3).
In conclusion, we have demonstrated here that the TrxR2/Trx2/Prx3 system is essential for controlling H2O2 flux from heart mitochondria under the physiological mode of respiration. This contributes to the maintenance of a redox environment compatible with signaling and energetics (16, 58). A high level of energization is necessary for maintaining Trx2 in its reduced and active form. The results presented here suggest TrxR2/Trx2/Prx3 as a new potential target for rescuing proper mitochondrial function and, in turn, cellular redox balance, both of which are crucial for cell viability and function.
Supplementary Material
This work was supported, in whole or in part, by National Institutes of Health Grant R01-HL091923-01 (to M. A. A. and N. P.). This work was also supported by American Heart Association Postdoctoral Fellowship 10POST414001 (to B. A. S.).

The on-line version of this article (available at http://www.jbc.org) contains supplemental “Methods,” “Results,” Figs. S1–S5, and an additional reference.
- ROS
- reactive oxygen species
- Trx2
- thioredoxin-2
- Prx3
- peroxiredoxin-3
- TrxR2
- thioredoxin reductase-2
- AF
- auranofin
- DNCB
- 1-chloro-2,4-dinitrobenzene
- CM-H2DCFDA
- 5(6)-chloromethyl-2′,7′-dichlorohydrofluorescein diacetate
- DTNB
- 5,5′-dithiobis(2-nitrobenzoic acid)
- Trx(SH)2
- reduced Trx2
- TrxSS
- oxidized Trx2
- AMS
- 4-acetamido-4′-maleimidylstilbene-2,2′-disulfonic acid
- ICP-MS
- inductively coupled plasma mass spectrometry
- FET
- forward electron transport.
REFERENCES
- 1. Brand M. D. (2010) Exp. Gerontol. 45, 466–472 [DOI] [PMC free article] [PubMed] [Google Scholar]
- 2. Di Lisa F., Canton M., Menabò R., Kaludercic N., Bernardi P. (2007) Heart Fail. Rev. 12, 249–260 [DOI] [PubMed] [Google Scholar]
- 3. Cox A. G., Winterbourn C. C., Hampton M. B. (2010) Biochem. J. 425, 313–325 [DOI] [PubMed] [Google Scholar]
- 4. Rhee S. G., Kang S. W., Chang T. S., Jeong W., Kim K. (2001) IUBMB Life 52, 35–41 [DOI] [PubMed] [Google Scholar]
- 5. Imai H., Nakagawa Y. (2003) Free Radic. Biol. Med. 34, 145–169 [DOI] [PubMed] [Google Scholar]
- 6. Radi R., Turrens J. F., Chang L. Y., Bush K. M., Crapo J. D., Freeman B. A. (1991) J. Biol. Chem. 266, 22028–22034 [PubMed] [Google Scholar]
- 7. Salvi M., Battaglia V., Brunati A. M., La Rocca N., Tibaldi E., Pietrangeli P., Marcocci L., Mondovì B., Rossi C. A., Toninello A. (2007) J. Biol. Chem. 282, 24407–24415 [DOI] [PubMed] [Google Scholar]
- 8. Kowaltowski A. J., de Souza-Pinto N. C., Castilho R. F., Vercesi A. E. (2009) Free Radic. Biol. Med. 47, 333–343 [DOI] [PubMed] [Google Scholar]
- 9. Murphy M. P. (2009) Biochem. J. 417, 1–13 [DOI] [PMC free article] [PubMed] [Google Scholar]
- 10. Stowe D. F., Camara A. K. (2009) Antioxid. Redox Signal. 11, 1373–1414 [DOI] [PMC free article] [PubMed] [Google Scholar]
- 11. Ueda S., Masutani H., Nakamura H., Tanaka T., Ueno M., Yodoi J. (2002) Antioxid. Redox Signal. 4, 405–414 [DOI] [PubMed] [Google Scholar]
- 12. Go Y. M., Kang S. M., Roede J. R., Orr M., Jones D. P. (2011) PLoS ONE 6, e18918 [DOI] [PMC free article] [PubMed] [Google Scholar]
- 13. Halvey P. J., Watson W. H., Hansen J. M., Go Y. M., Samali A., Jones D. P. (2005) Biochem. J. 386, 215–219 [DOI] [PMC free article] [PubMed] [Google Scholar]
- 14. Hansen J. M., Zhang H., Jones D. P. (2006) Free Radic. Biol. Med. 40, 138–145 [DOI] [PubMed] [Google Scholar]
- 15. Andreyev A. Y., Kushnareva Y. E., Starkov A. A. (2005) Biochemistry 70, 200–214 [DOI] [PubMed] [Google Scholar]
- 16. Aon M. A., Cortassa S., O'Rourke B. (2010) Biochim. Biophys. Acta 1797, 865–877 [DOI] [PMC free article] [PubMed] [Google Scholar]
- 17. Rigobello M. P., Folda A., Baldoin M. C., Scutari G., Bindoli A. (2005) Free Radic. Res. 39, 687–695 [DOI] [PubMed] [Google Scholar]
- 18. Akar F. G., Aon M. A., Tomaselli G. F., O'Rourke B. (2005) J. Clin. Invest. 115, 3527–3535 [DOI] [PMC free article] [PubMed] [Google Scholar]
- 19. Aon M. A., Cortassa S., Akar F. G., Brown D. A., Zhou L., O'Rourke B. (2009) Int. J. Biochem. Cell Biol. 41, 1940–1948 [DOI] [PMC free article] [PubMed] [Google Scholar]
- 20. Friederich M., Hansell P., Palm F. (2009) Curr. Diabetes Rev. 3, 120–144 [DOI] [PubMed] [Google Scholar]
- 21. Sivitz W. I., Yorek M. A. (2010) Antioxid. Redox Signal. 12, 537–577 [DOI] [PMC free article] [PubMed] [Google Scholar]
- 22. Camara A. K., Lesnefsky E. J., Stowe D. F. (2010) Antioxid. Redox Signal. 13, 279–347 [DOI] [PMC free article] [PubMed] [Google Scholar]
- 23. Zhang M., Shah A. M. (2007) Curr. Heart Fail. Rep. 4, 26–30 [DOI] [PubMed] [Google Scholar]
- 24. Ondarza R. N., Rendón J. L., Ondarza M. (1983) J. Mol. Evol. 19, 371–375 [DOI] [PubMed] [Google Scholar]
- 25. Rogers L. K., Tamura T., Rogers B. J., Welty S. E., Hansen T. N., Smith C. V. (2004) Toxicol. Sci. 82, 367–373 [DOI] [PubMed] [Google Scholar]
- 26. Conrad M., Jakupoglu C., Moreno S. G., Lippl S., Banjac A., Schneider M., Beck H., Hatzopoulos A. K., Just U., Sinowatz F., Schmahl W., Chien K. R., Wurst W., Bornkamm G. W., Brielmeier M. (2004) Mol. Cell. Biol. 24, 9414–9423 [DOI] [PMC free article] [PubMed] [Google Scholar]
- 27. Nonn L., Williams R. R., Erickson R. P., Powis G. (2003) Mol. Cell. Biol. 23, 916–922 [DOI] [PMC free article] [PubMed] [Google Scholar]
- 28. Chen Y., Cai J., Murphy T. J., Jones D. P. (2002) J. Biol. Chem. 277, 33242–33248 [DOI] [PubMed] [Google Scholar]
- 29. Watson W. H., Yang X., Choi Y. E., Jones D. P., Kehrer J. P. (2004) Toxicol. Sci. 78, 3–14 [DOI] [PubMed] [Google Scholar]
- 30. Garcia J., Han D., Sancheti H., Yap L. P., Kaplowitz N., Cadenas E. (2010) J. Biol. Chem. 285, 39646–39654 [DOI] [PMC free article] [PubMed] [Google Scholar]
- 31. Aon M. A., Cortassa S., Wei A. C., Grunnet M., O'Rourke B. (2010) Biochim. Biophys. Acta 1797, 71–80 [DOI] [PMC free article] [PubMed] [Google Scholar]
- 32. Aon M. A., Cortassa S., Maack C., O'Rourke B. (2007) J. Biol. Chem. 282, 21889–21900 [DOI] [PMC free article] [PubMed] [Google Scholar]
- 33. Aon M. A., Cortassa S., Marbán E., O'Rourke B. (2003) J. Biol. Chem. 278, 44735–44744 [DOI] [PubMed] [Google Scholar]
- 34. Tocchetti C. G., Wang W., Froehlich J. P., Huke S., Aon M. A., Wilson G. M., Di Benedetto G., O'Rourke B., Gao W. D., Wink D. A., Toscano J. P., Zaccolo M., Bers D. M., Valdivia H. H., Cheng H., Kass D. A., Paolocci N. (2007) Circ. Res. 100, 96–104 [DOI] [PMC free article] [PubMed] [Google Scholar]
- 35. Arnér E. S. J., Holmgren A. (2000) in Current Protocols in Toxicology (Costa L. G. ed) Vol. 7.4, Suppl. 24, pp. 1–14, John Wiley & Sons, Inc., New York [Google Scholar]
- 36. Go Y. M., Jones D. P. (2009) Curr. Protoc. Toxicol. 17.12, Suppl. 41, 1–12 [Google Scholar]
- 37. Schafer F. Q., Buettner G. R. (2001) Free Radic. Biol. Med. 30, 1191–1212 [DOI] [PubMed] [Google Scholar]
- 38. Ayers F. C., Warner G. L., Smith K. L., Lawrence D. A. (1986) Anal. Biochem. 154, 186–193 [DOI] [PubMed] [Google Scholar]
- 39. Drechsel D. A., Patel M. (2010) J. Biol. Chem. 285, 27850–27858 [DOI] [PMC free article] [PubMed] [Google Scholar]
- 40. Korshunov S. S., Skulachev V. P., Starkov A. A. (1997) FEBS Lett. 416, 15–18 [DOI] [PubMed] [Google Scholar]
- 41. Arnér E. S., Björnstedt M., Holmgren A. (1995) J. Biol. Chem. 270, 3479–3482 [DOI] [PubMed] [Google Scholar]
- 42. Han D., Canali R., Rettori D., Kaplowitz N. (2003) Mol. Pharmacol. 64, 1136–1144 [DOI] [PubMed] [Google Scholar]
- 43. Rackham O., Nichols S. J., Leedman P. J., Berners-Price S. J., Filipovska A. (2007) Biochem. Pharmacol. 74, 992–1002 [DOI] [PubMed] [Google Scholar]
- 44. Rigobello M. P., Gandin V., Folda A., Rundlöf A. K., Fernandes A. P., Bindoli A., Marzano C., Björnstedt M. (2009) Free Radic. Biol. Med. 47, 710–721 [DOI] [PubMed] [Google Scholar]
- 45. Lee S. R., Kim J. R., Kwon K. S., Yoon H. W., Levine R. L., Ginsburg A., Rhee S. G. (1999) J. Biol. Chem. 274, 4722–4734 [DOI] [PubMed] [Google Scholar]
- 46. Gromer S., Arscott L. D., Williams C. H., Jr., Schirmer R. H., Becker K. (1998) J. Biol. Chem. 273, 20096–20101 [DOI] [PubMed] [Google Scholar]
- 47. Zhong L., Arnér E. S., Ljung J., Aslund F., Holmgren A. (1998) J. Biol. Chem. 273, 8581–8591 [DOI] [PubMed] [Google Scholar]
- 48. Nordberg J., Zhong L., Holmgren A., Arnér E. S. (1998) J. Biol. Chem. 273, 10835–10842 [DOI] [PubMed] [Google Scholar]
- 49. Novogrodsky A., Nehring R. E., Jr., Meister A. (1979) Proc. Natl. Acad. Sci. U.S.A. 76, 4932–4935 [DOI] [PMC free article] [PubMed] [Google Scholar]
- 50. Rigobello M. P., Folda A., Scutari G., Bindoli A. (2005) Arch. Biochem. Biophys. 441, 112–122 [DOI] [PubMed] [Google Scholar]
- 51. Tonissen K. F., Di Trapani G. (2009) Mol. Nutr. Food Res. 53, 87–103 [DOI] [PubMed] [Google Scholar]
- 52. Vergara E., Casini A., Sorrentino F., Zava O., Cerrada E., Rigobello M. P., Bindoli A., Laguna M., Dyson P. J. (2010) ChemMedChem 5, 96–102 [DOI] [PubMed] [Google Scholar]
- 53. Angelucci F., Sayed A. A., Williams D. L., Boumis G., Brunori M., Dimastrogiovanni D., Miele A. E., Pauly F., Bellelli A. (2009) J. Biol. Chem. 284, 28977–28985 [DOI] [PMC free article] [PubMed] [Google Scholar]
- 54. Hirasaka K., Lago C. U., Kenaston M. A., Fathe K., Nowinski S. M., Nikawa T., Mills E. M. (2011) Antioxid. Redox Signal., doi: 10.1089/ars.2011.3888 [DOI] [PMC free article] [PubMed] [Google Scholar]
- 55. Iñarrea P., Moini H., Han D., Rettori D., Aguiló I., Alava M. A., Iturralde M., Cadenas E. (2007) Biochem. J. 405, 173–179 [DOI] [PMC free article] [PubMed] [Google Scholar]
- 56. Hu J., Dong L., Outten C. E. (2008) J. Biol. Chem. 283, 29126–29134 [DOI] [PMC free article] [PubMed] [Google Scholar]
- 57. Cox A. G., Brown K. K., Arner E. S., Hampton M. B. (2008) Biochem. Pharmacol. 76, 1097–1109 [DOI] [PubMed] [Google Scholar]
- 58. D'Autréaux B., Toledano M. B. (2007) Nat. Rev. Mol. Cell Biol. 8, 813–824 [DOI] [PubMed] [Google Scholar]
Associated Data
This section collects any data citations, data availability statements, or supplementary materials included in this article.