Abstract
The stress-inducible cytoprotective enzyme heme oxygenase-1 (HO-1) may play a critical role in the growth and metastasis of tumors. We demonstrated that overexpressed HO-1 promotes the survival of renal cancer cells by inhibiting cellular apoptosis; we also showed that the proto-oncogene H-Ras becomes activated in these cells under stress following treatment with immunosuppressive agents. However, it is not known if there is an association between Ras activation and HO-1 overexpression. Here, we examined if the activation of H-Ras pathway could induce HO-1, and promote the survival of renal cancer cells (786-0 and Caki-1). In co-transfection assays, using HO-1 promoter-luciferase construct, we found that the activated H-Ras, H-Ras(12V), promoted HO-1 transcriptional activation. The inhibition of endogenous H-Ras by specific dominant-negative mutant/siRNA markedly ablated the HO-1 promoter activity. Active H-Ras increased HO-1 mRNA and protein expression. Moreover, transfection with effector domain mutant constructs of active H-Ras showed that H-Ras-induced HO-1 overexpression was primarily mediated through the Raf signaling pathway. Using pharmacological inhibitor, we observed that ERK is a critical intermediary molecule for Ras-Raf-induced HO-1 expression. Activation of H-Ras and ERK promoted nuclear translocation of the transcription factor Nrf2 for its binding to the specific sequence of HO-1 promoter. The knockdown of Nrf2 significantly inhibited H-Ras-induced HO-1 transcription. Finally, by FACS analysis using Annexin-V staining, we demonstrated that the H-Ras-ERK-induced and HO-1-mediated pathway could protect renal cancer cells from apoptosis. Thus, targeting the Ras-Raf-ERK pathway for HO-1 overexpression may serve as novel therapeutics for the treatment of renal cancer.
Keywords: Ras, Signal Transduction, Transcription, Transcription Regulation, Tumor, HO-1, Heme Oxygenase-1
Introduction
Heme oxygenase-1 (HO-1),3 a member of the heat shock protein family, plays a key role as a sensor and regulator of oxidative stress (1, 2). It catalyzes the degradation of heme to form biliverdin, carbon monoxide (CO), and free iron (3). It plays an important protective role in the tissues by reducing oxidative injury, attenuating inflammatory response, inhibiting apoptosis, and also by regulating angiogenesis and cell proliferation (1, 4, 5). Although it is a cytoprotective enzyme, a growing body of evidence clearly suggests that HO-1 may also play a significant role in the induction of tumorigenic pathways (6–9). HO-1 is often highly up-regulated in tumor tissues, and its expression is further increased in response to therapies. The overexpressed HO-1 can inhibit apoptosis of tumor cells and promote tumor growth and metastasis (6, 10). It has been suggested that the inhibition of HO-1 expression can be a potential therapeutic approach to sensitize tumors to radiation and chemotherapy (11–14).
The mechanisms underlying HO-1 induction are complex, and tightly regulated primarily at the transcriptional level (15, 16). The HO-1 gene has two important distal enhancer regions, E1 and E2, located upstream of the transcription start site (16, 17). The dominant element in the E1 and E2 regions is the anti-oxidant response element (ARE)/stress-responsive element (StRE), which mediates transcriptional activation through the binding of transcription factors in response to most of the HO-1 inducers (18). Several transcription factors, such as nuclear factor-E2-related factor 2 (Nrf2), cAMP responsive element-binding protein-1, activator protein-1, Maf, and nuclear factor-κB play significant roles in the activation of the HO-1 promoter (19–21). Complex networks of intracellular signaling events are involved in the activation of transcription factors to induce HO-1 overexpression (21, 22). However, the intricate signaling mechanism(s) for the induction of HO-1 transcription, particularly in cancer cells, is not well defined.
The ras family of proto-oncogenes encodes small proteins that transduce mitogenic signals from tyrosine kinase receptors (23, 24). Ras proteins act as molecular switches that cycle between active GTP-bound and inactive GDP-bound forms (25–27). The three isoforms of Ras, H-Ras, K-Ras, and N-Ras, are ubiquitously expressed in mammalian cells (28). Hyperactive Ras can promote the growth and development of cancer cells even without being mutated, where it may be activated by persistent upstream signaling events (29–31). Upon activation, Ras transmits signals to a cascade of protein kinases that have MAP kinase kinase (MEK) as substrate, such as MEK kinase, c-Raf-1, and B-Raf, culminating in the activation of MAP kinase (MAPK) (32). It has been suggested that Ras may function primarily to promote the translocation of Raf-1 from the cytosol to the plasma membrane, where subsequent Ras-independent events trigger Raf-1 kinase activation (33). However, despite the evidence that Raf-1 is a critical downstream effector of Ras function, there is increasing evidence that Ras may also mediate its action through Raf-independent pathways, including Rho- and phosphatidylinositol 3-kinase (PI3K) pathways (34–36).
We have recently demonstrated that H-Ras becomes activated in human renal cancer cells under stress following treatment with immunosuppressive agents, and the activated H-Ras induces tumorigenic pathways (37). We have also observed that the expression of HO-1 is significantly up-regulated in renal cancer tissues, and the overexpressed HO-1 can inhibit tumor cell apoptosis (38). In the present study, we show that activated H-Ras promotes the transcriptional activation of HO-1 in human renal cancer cells; and H-Ras-induced HO-1 overexpression is mediated primarily through the Raf-MAPK signaling pathway involving the transcription factor Nrf2, which leads to the survival of renal cancer cells.
EXPERIMENTAL PROCEDURES
Reagents
Cobalt protoporphyrin (CoPP) was obtained from Frontier Scientific. The gene-specific small interfering RNA (siRNA) for H-Ras, Raf-1, Nrf2, HO-1, and their respective controls were purchased from Qiagen. The transfection of siRNA was performed using Lipofectamine 2000 (Invitrogen). The MEK inhibitor PD98059 and the Raf-1 kinase inhibitor I {RKI; 5-iodo-3-[(3,5-dibromo-4-hydroxy-phenyl)methylene]-2-indolinone} were purchased from Calbiochem. Recombinant human platelet-derived growth factor (PDGF) was purchased from BioLegend.
Cell Lines
The human renal cancer cell lines (786–0 and Caki-1) were obtained from American Type Culture Collection. 786-0 cells were grown in RPMI 1640, and Caki-1 cells were grown in McCoy's medium supplemented with 10% fetal bovine serum (Gibco). Human renal proximal tubular epithelial cells (RPTEC) were purchased from Clonetics and cultured in complete epithelial medium (REGM BulletKit).
Tissue Samples
Tissue samples of human renal cell cancer (RCC) were obtained from surgical specimens of patients who underwent surgery at the University Hospital (Wurzburg, Germany). The protocol to obtain tissue samples was approved by the review board of the hospital. Normal renal tissues were obtained from normal parts of the surgical specimens, and the normalcy of these tissues was confirmed by histology.
Plasmids
A human HO-1 promoter-luciferase construct was obtained as a gift from J. Alam of Alton Ochsner Medical Foundation, New Orleans, LA (20). The plasmid phHO4luc was constructed by cloning the promoter fragment from the human HO-1 gene (bp −4067 to +70 relative to transcription start site) into the luciferase reporter gene vector pSKluc. All Ras expression constructs encode mutant versions of the transforming human H-Ras(12V), and were obtained as generous gifts from Roya Khosravi-Far (Beth Israel Deaconess Medical Center, Boston, MA). The pDCR-ras(12V), pDCR-ras(12V, 35S), pDCR-ras(12V,37G), and pDCR-ras(12V,40C) mammalian constructs encode effector domain mutants of H-Ras(12V) in which expression is under the control of the cytomegalovirus promoter (34). The Ras(17N) and RhoA(19N) dominant-negative plasmids inhibit the function of endogenous Ras (27) and RhoA (34), respectively.
RNA Isolation and Real-time PCR
Total RNA was prepared using the RNeasy isolation kit (Qiagen), and cDNA was synthesized using cloned AMV first-strand synthesis kit (Invitrogen). To analyze mRNA expression, we performed real-time PCR using the Assay-on-Demand Gene Expression product (TaqMan, Mammalian Gene Collection probes) according to the manufacturer's instructions (Applied Biosystems, Foster City, CA). As an internal control, glyceraldehyde-3-phosphate dehydrogenase (GAPDH) mRNA was amplified and analyzed under identical conditions. Gene-specific primer-probe sets for human HO-1/GAPDH were obtained from Applied Biosystems. Ct value (the cycle number at which emitted fluorescence exceeded an automatically determined threshold) for gene of interest was corrected by the Ct value for GAPDH and expressed as ΔCt. The fold change of mRNA amount was calculated as follows: (fold changes) = 2X (where X = ΔCt for control group - ΔCt for experimental group).
Transfection and Luciferase Assays
786-0 or Caki-1 (2.5 × 10⁵ cells) were transfected with the Ras expression plasmids or the HO-1 promoter-luciferase plasmid using Effectene Transfection Reagent (Qiagen), according to the manufacturer's protocol. The total amount of transfected plasmid DNA was normalized using a control empty expression vector. For luciferase assay, cells were harvested 48 h after transfection, and luciferase activity was measured using a standard assay kit (Promega) in a luminometer. As an internal control for transfection efficiency, the cells were co-transfected with β-galactosidase gene under control of cytomegalovirus immediate early promoter, and β-galactosidase activity was measured using standard assay system (Promega); luciferase activity measurement was corrected for the transfection efficiency by calculating the ratio of luciferase units to β-galactosidase units, represented as the relative luciferase counts.
Western Blot Analysis
Protein samples were run on SDS-polyacrylamide gel and transferred to a polyvinylidene difluoride membrane (Millipore Corporation). The membranes were incubated with the following primary antibodies: anti-Ras (BD Transduction Laboratories); anti-HO-1 (R & D systems); anti-H-Ras, anti-Raf-1, anti-Lamin A, and anti-Nrf2 (Santa Cruz Biotechnology); anti-β-actin and anti-GAPDH (Sigma-Aldrich). The membranes were subsequently incubated with peroxidase-linked secondary antibody, and the reactive bands were detected by using chemiluminescent substrate (Pierce).
Immunohistochemistry
Immunohistochemistry was performed on frozen sections of human renal cell cancer (RCC) tissues and normal renal tissues. Briefly, acetone-fixed sections were incubated first with anti-human Nrf2 (Abcam), and second with a species-specific horseradish peroxidase-conjugated secondary antibody. Specimens were washed thoroughly in between incubations, developed in 3,3′-diaminobenzidine (BioGenex), and counterstained in Meyer's Hemalaun using standard techniques.
Preparation of Cytoplasmic and Nuclear Extracts
Cytoplasmic and nuclear extracts were prepared using a Nuclear Extract kit (Active Motif). The purities of cytoplasmic and nuclear fractions were confirmed by checking the expression of a cytoplasmic protein GAPDH and a nuclear protein Lamin A.
DNA Binding ELISA for Nrf2
The binding of the activated transcription factor Nrf2 to the specific DNA sequence was measured by using TransAM Nrf2 ELISA kit (Active Motif). Briefly, the kit contains stripwell plate to which multiple copies of specific double-stranded oligonucleotide for Nrf2 consensus-binding site (ARE) has been immobilized. When nuclear extract is added to each well, the activated Nrf2 binds specifically to this plate-bound oligonucleotide. Nrf2-specific primary antibody is then added followed by subsequent incubation with secondary antibody and developing solution. Quantitative analysis is performed by spectrophotometry at 450 nm.
Apoptosis Assay
Cellular apoptosis was measured by Annexin-V and propidium iodide (PI) staining using Annexin-V FITC/APC Apoptosis Detection Kit (eBioscience) according to the manufacturer's protocol. Following staining, the cells were analyzed by flow cytometry on a FACSCalibur.
Statistical Analysis
Statistical evaluation for data analysis was determined by Student's t test. Differences with p < 0.05 were considered statistically significant.
RESULTS
Active H-Ras Promotes Transcriptional Activation of HO-1 in Human Renal Cancer Cells
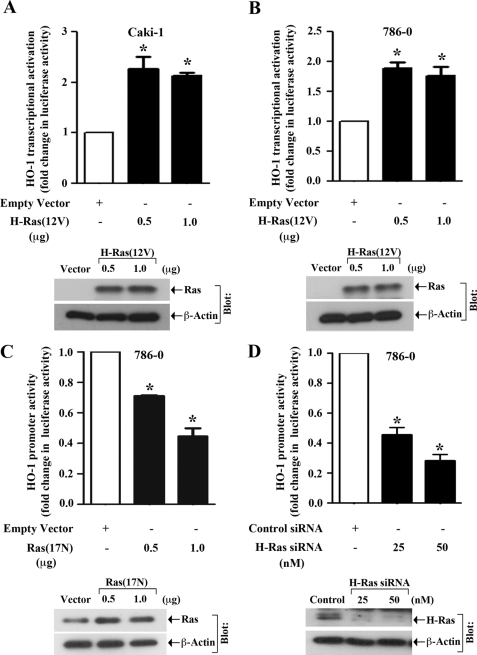
We have recently demonstrated that the activation of H-Ras plays a crucial role in the accelerated growth of human renal tumors under stress following treatment with immunosuppressive agents (37); we have also observed that HO-1 is markedly overexpressed in renal cancer tissues, and the overexpressed HO-1 can mediate anti-apoptotic signals in renal cancer cells (38). Thus, both H-Ras and HO-1 may induce pro-tumorigenic pathways in human renal cancer cells to promote rapid growth of the tumors. However, we did not examine if there is any association between H-Ras activation and HO-1 overexpression in human renal cancer. Here, we first wished to evaluate if the activation of H-Ras can regulate HO-1 promoter activity in human renal cancer cell lines (Caki-1 and 786–0). Both the cells express H-Ras, and its expression is higher in cancer cells compared with normal renal epithelial cells (supplemental Fig. S1). The cells were co-transfected with the HO-1 promoter-luciferase construct and either the plasmid expressing activated form of H-Ras, H-Ras(12V), or the empty expression vector (control). The effect of H-Ras on HO-1 promoter activation was assessed by the measurement of luciferase activity in cell lysates. As shown in Fig. 1, A and B, the activation of H-Ras significantly increased HO-1 promoter activity in both the cell lines compared with vector controls. The expression of H-Ras(12V) plasmid in the transfected cells was confirmed by Western blot analysis (Fig. 1, A and B, bottom panels).
FIGURE 1.
Activation of H-Ras induces HO-1 promoter activity: A and B, Caki-1 and 786-0 cells were co-transfected with the HO-1 promoter-luciferase construct (0.5 μg) and either different amounts (0.5 and 1.0 μg) of active H-Ras overexpression plasmid H-Ras(12V) (filled columns) or the empty expression vector (open column). C, 786-0 cells were co-transfected with the HO-1 promoter-luciferase construct (0.5 μg) and either different amounts (0.5 and 1.0 μg) of the Ras dominant-negative plasmid Ras(17N) (filled columns) or the empty expression vector (open column). D, 786-0 cells were transfected with either different concentrations (25 and 50 nm) of H-Ras siRNA (filled columns) or control siRNA (open column). Following 24 h of siRNA transfection, the cells were transfected with the HO-1 promoter-luciferase construct (0.5 μg). The cells (A–D) were harvested after 48 h of plasmid transfection, and fold change in luciferase activity was calculated as the relative luciferase counts from each group of cells compared with that of cells transfected with empty vector/control siRNA. Results are representative of three independent experiments. Columns, average of triplicate readings of two different samples; error bars, S.D. *, p < 0.01 compared with empty vector-/control siRNA-transfected cells. A–D, bottom, the overexpression of H-Ras(12V)/Ras(17N) plasmid in transfected cells, or the knockdown of H-Ras through siRNA was confirmed by Western blot analysis using anti-Ras/anti-H-Ras; and the expression of β-actin was measured as internal control. The expression of Ras in vector-transfected cells did not show up (in A and B) due to significantly high overexpression of the gene in H-Ras(12V)-transfected cells.
Next, to check whether the inhibition of endogenous H-Ras can block HO-1 transcription, we first used a dominant-negative plasmid construct of Ras, Ras(17N). 786-0 cells were co-transfected with the HO-1 promoter-luciferase construct and either Ras(17N) or the empty expression vector. We observed that transfection with Ras(17N) significantly inhibited HO-1 promoter activity compared with vector controls (Fig. 1C). The expression of Ras(17N) plasmid in the transfected cells was confirmed by Western blot analysis (Fig. 1C, bottom panel). We also found that the knockdown of endogenous H-Ras in 786-0 cells by siRNA transfection significantly down-regulated HO-1 promoter activity compared with control siRNA-transfected cells (Fig. 1D). The knockdown of H-Ras was confirmed by Western blot analysis (Fig. 1D, bottom panel).
It has been reported that the growth factor PDGF can induce Ras pathway through the tyrosine kinase receptor PDGFR (39), known to be expressed in renal cancer cells (40). Thus, we also tested if PDGF treatment can promote HO-1 transcriptional activation in renal cancer cells. We observed that the treatment with PDGF indeed increased HO-1 promoter activity in Caki-1 cells (supplemental Fig. S2A). Together, these observations suggest that activation of H-Ras promotes the transcriptional activation of HO-1 in human renal cancer cells.
Activation of H-Ras Promotes Overexpression of HO-1 in Renal Cancer Cells
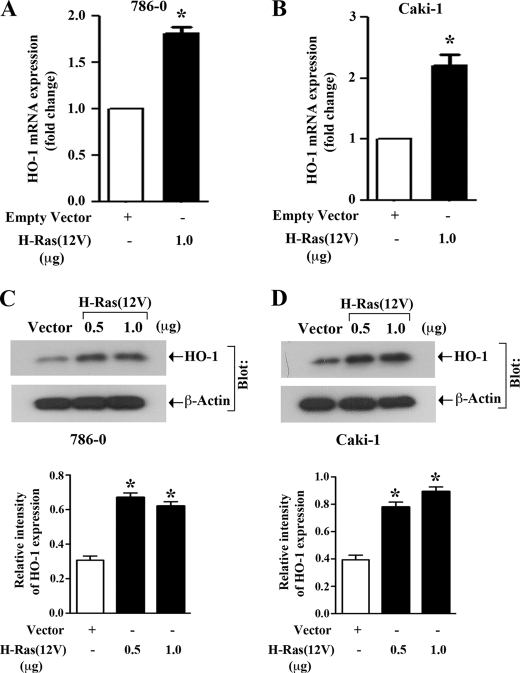
Here, we examined if the activation of H-Ras could increase mRNA and protein expression of HO-1 in 786-0 and Caki-1 cells. The cells were transfected with either H-Ras(12V) or the empty expression vector. Through real-time PCR, we found that in both the cell lines, transfection of active H-Ras significantly increased the expression of HO-1 mRNA compared with vector controls (Fig. 2, A and B). We next checked the expression level of HO-1 protein following H-Ras activation. Through Western blot analysis, we observed that active H-Ras markedly induced HO-1 protein expression compared with vector controls (Fig. 2, C and D); however, there was no significant change (data not shown) in the expression of HO-2, which is the non-inducible and constitutive isoform of the enzyme. Thus, the activation of H-Ras in renal cancer cells promotes HO-1 overexpression at both mRNA and protein levels.
FIGURE 2.
Activation of H-Ras promotes overexpression of HO-1 mRNA and protein: A and B, 786-0 and Caki-1 cells were transfected with either H-Ras(12V) (filled column) or the empty expression vector (open column). Following 48 h of transfection, total RNA was isolated from these cells and reverse-transcribed. Fold change in HO-1 mRNA expression was measured by real-time PCR. Data reflect three independent experiments, resulting from duplicate readings of two different samples. Columns, average value of HO-1 mRNA expression, bars, S.D. C and D, 786-0 and Caki-1 cells were transfected with either different amounts (0.5 and 1.0 μg) of H-Ras(12V) or the empty expression vector. Following 48 h of transfection, whole cell lysates were prepared, and Western blot analysis was performed to quantitate HO-1 protein expression (top). β-actin was used as loading control (bottom). The bar graphs below the Western blots illustrate the relative expression of HO-1 by densitometry, wherein the signals were standardized to the expression of the internal control β-actin. Representative of three independent experiments. Columns, average of relative intensity of HO-1 expression from two different blots; error bars, S.D. In A–D, *, p < 0.01 compared with empty vector-transfected cells.
H-Ras-induced HO-1 Transcriptional Activation Is Mediated Primarily through the Raf Signaling Pathway
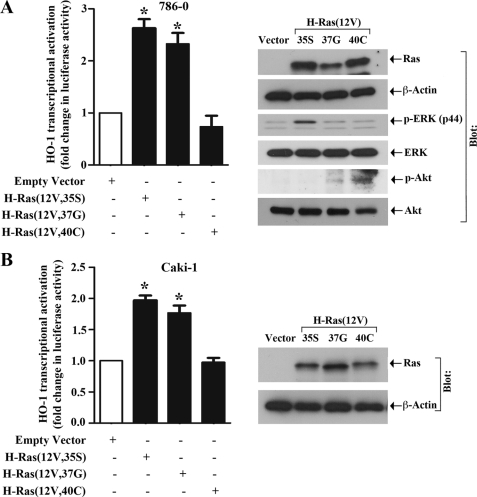
It is established that the activation of Ras can trigger several associated signaling molecules, including Raf, Rho, and PI3K (34–36). Here, we wanted to evaluate which effector molecule(s) is involved in channeling H-Ras-induced signals for HO-1 transcriptional activation. To this end, we made use of three effector loop mutant constructs of H-Ras; H-Ras(12V,35S) retains full-length Raf-1 binding activity, H-Ras(12V,37G) retains Rho binding activity, and H-Ras(12V,40C) retains PI3K binding activity (34). 786-0 and Caki-1 cells were transfected with the HO-1 promoter-luciferase construct, and either one of the H-Ras effector domain mutants or the empty expression vector; and luciferase assay was performed. As shown in Fig. 3, A and B, we observed that in both the cell lines, there was significant increase in HO-1 promoter activity following transfection with H-Ras(12V,35S) compared with vector controls. The mutant H-Ras(12V,37G) also induced HO-1 promoter activity, however, the effect was less compared with H-Ras(12V,35S). In contrast, the mutant H-Ras(12V,40C) failed to induce HO-1 promoter activity in both the cell lines. The protein expression of the H-Ras effector loop mutant constructs in the transfected cells was confirmed by Western blot analysis (Fig. 3, A and B, right panels). Also, we confirmed that only H-Ras(12V,35S) can induce the phosphorylation of ERK (p44), while H-Ras(12V,40C) can induce the phosphorylation of Akt (Fig. 3A, right panels). Together, these observations suggest that the Raf signaling pathway is primarily involved in channeling H-Ras-induced signals for HO-1 transcriptional activation in renal cancer cells; also, the PI3K pathway may not be involved in H-Ras-induced activation of the HO-1 promoter.
FIGURE 3.
H-Ras promotes HO-1 transcriptional activation primarily through the Raf signaling pathway: A and B, 786–0 and Caki-1 cells were transfected with the HO-1 promoter-luciferase construct (0.5 μg) and either 0.5 μg of an effector domain mutant of H-Ras [either Ras(12V,35S), Ras(12V,37G), or Ras(12V,40C)] (filled columns) or the empty expression vector (open column). The cells were harvested after 48 h, and fold change in luciferase activity was calculated as the relative luciferase counts from each group of cells compared with that of cells transfected with empty vector alone. Results are representative of three independent experiments. Columns, average of triplicate readings of two different samples; error bars, S.D. *, p < 0.01 compared with empty vector-transfected cells. A and B, right panel, the overexpression of H-Ras, and the expression of p-ERK, ERK, p-Akt, and Akt in H-Ras effector domain mutant plasmid-transfected cells was confirmed by Western blot analysis; and the expression of β-actin was measured as internal control.
Raf-1 and ERK Are Key Intermediary Signaling Molecules in H-Ras-induced HO-1 Transcriptional Activation
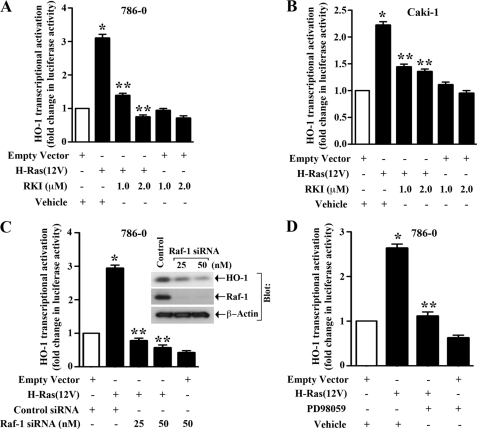
Our previous experiment suggested a role of the Raf signaling pathway in H-Ras-induced HO-1 transcription. To confirm the role of Raf-1 kinase in this process, we co-transfected our cells (786-0 and Caki-1) with the HO-1 promoter-luciferase construct and the H-Ras(12V) plasmid in absence or presence of Raf-1 kinase inhibitor (RKI); and luciferase assay was performed. As shown in Fig. 4, A and B, the activation of H-Ras significantly increased HO-1 promoter activity compared with empty vector controls; and the inhibition of Raf-1 with pharmacological inhibitor markedly decreased H-Ras-induced HO-1 transcriptional activation compared with vehicle-treated controls. We also confirmed that the knockdown of Raf-1 in 786-0 cells using siRNA significantly down-regulated H-Ras-induced HO-1 transcriptional activation (Fig. 4C). In addition, the knockdown of Raf-1 was associated with a significant decrease in HO-1 protein expression as observed by Western blot analysis (Fig. 4C, right panel). We also found that the knockdown of Raf-1 inhibited PDGF-induced (known to activate the Ras pathway) HO-1 transcriptional activation (supplemental Fig. S2B).
FIGURE 4.
Raf-1 and ERK are important intermediary molecules for H-Ras-induced HO-1 transcription: A and B, 786–0 and Caki-1 cells were pre-treated with RKI/vehicle, and then co-transfected with the HO-1 promoter-luciferase construct (0.5 μg) and either H-Ras(12V) (0.5 μg) or the empty expression vector in the absence or presence of RKI. C, 786-0 cells were transfected with either different concentrations (25 and 50 nm) of Raf-1 siRNA or the control siRNA. Following 24 h of siRNA transfection, the cells were co-transfected with the HO-1 promoter-luciferase construct (0.5 μg) and either H-Ras(12V) (0.5 μg) or the empty expression vector. D, 786-0 cells were pretreated with 50 μm PD98059/vehicle, and then co-transfected with the HO-1 promoter-luciferase construct (0.5 μg) and either H-Ras(12V) (0.5 μg) or the empty expression vector in the absence or presence of PD98059. The cells (A–D) were harvested after 48 h of plasmid transfection, and fold change in luciferase activity was calculated as the relative luciferase counts from each group of cells compared with: that of cells transfected with empty vector and treated with vehicle alone (A, B, and D), and that of cells transfected with control siRNA and empty vector alone (C). Results are representative of three independent experiments. Columns, average of triplicate readings of two different samples; error bars, S.D. *, p < 0.01 compared with empty vector-transfected and vehicle-treated cells; or control siRNA- and empty vector-transfected cells; **, p < 0.01 compared with H-Ras(12V)-transfected and vehicle-treated cells; or control siRNA- and H-Ras(12V)-transfected cells. C, right, the expression of Raf-1 and HO-1 in Raf-1 siRNA-transfected cells was examined by Western blot analysis.
Our earlier experiments suggested that although the Raf signaling pathway is primarily involved in channeling H-Ras-induced signals for HO-1 transcription, the Rho pathway may also play some role. Here, we used a dominant-negative plasmid of RhoA [RhoA(19N)] to check if it can downregulate H-Ras-induced HO-1 transcriptional activation. We observed that with the transfection of RhoA(19N), there was a partial, but not significant inhibition of H-Ras-induced HO-1 promoter activity (supplemental Fig. S3).
It is established that the extracellular signal-regulated kinase (ERK) is a critical downstream effector molecule of the Ras-Raf signaling cascade (32, 34). Thus, we next examined if ERK plays a role in H-Ras-induced HO-1 transcription. 786–0 cells were co-transfected with the HO-1 promoter-luciferase construct and H-Ras(12V) in the absence or presence of MEK inhibitor PD98059 (known to inhibit ERK), and luciferase assay was performed. We found that in presence of PD98059, there was a significant decrease in H-Ras-induced HO-1 promoter activity compared with vehicle-treated controls (Fig. 4D). Together, our findings suggest that Raf and ERK are critical intermediary signaling molecules in H-Ras-induced HO-1 transcriptional activation.
The Transcription Factor Nrf2 Is Overexpressed in Renal Cancer Tissues and Plays an Important Role in HO-1 Expression
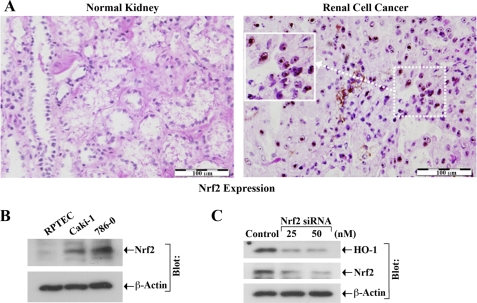
Nrf2 is one of the most important transcription factors for HO-1 expression (16, 17, 20, 21). Interestingly, there may be overexpression of Nrf2 in different types of cancer (41, 42). We found that the expression of Nrf2 was very minimal in normal renal tissues, and it was markedly up-regulated in human renal cell cancer (RCC) tissues (Fig. 5A). We also observed that the expression of Nrf2 was significantly high in human renal cancer cells (Caki-1 and 786-0) compared with normal renal epithelial cells (Fig. 5B).
FIGURE 5.
Nrf2 is overexpressed in RCC, and plays an important role in HO-1 expression. A, representative photomicrographs show the expression of Nrf2 in human RCC and normal kidney tissues detected by immunohistochemistry. Brown color dots, expression of Nrf2. Scale bar, 100 μm. B, whole cell lysates were prepared from RPTEC, Caki-1, and 786-0 cells, and assayed for Nrf2 expression by Western blot analysis. C, 786-0 cells were transfected with either different concentrations (25 and 50 nm) of Nrf2 siRNA or control siRNA. Following 72 h of siRNA transfection, cells were lysed, and expression of HO-1 and Nrf2 was analyzed by Western blot analysis. β-actin was used as loading control. Results (A–C) are representative of three independent experiments.
Next, we examined the role of Nrf2 in the expression of HO-1 in renal cancer cells. We observed that the knockdown of Nrf2 was associated with a marked decrease in HO-1 expression in 786–0 cells (Fig. 5C, top panel). The knockdown of Nrf2 was confirmed by Western blot analysis (Fig. 5C, middle panel). Thus, the overexpressed Nrf2 in renal cancer cells plays a major role in regulating HO-1 expression.
Activation of H-Ras and ERK Induces Nuclear Translocation of Nrf2, and Promotes Nrf2-mediated HO-1 Transcription
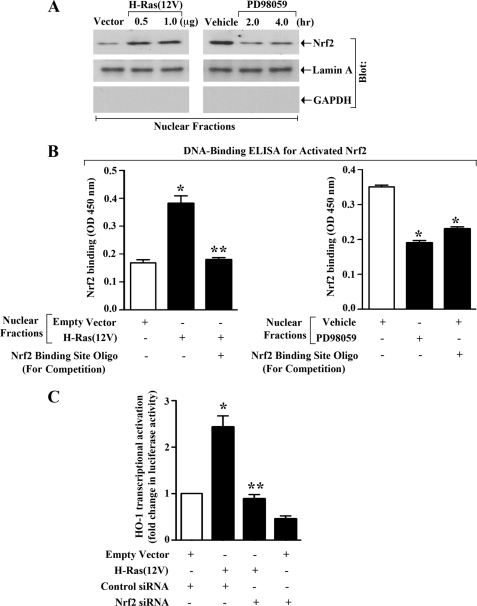
It is known that following activation, Nrf2 is translocated from cytoplasm to nucleus to promote ARE-mediated gene transcription (43). Our earlier experiments suggested that the activation of H-Ras and ERK pathway can promote HO-1 transcription in renal cancer cells. Here, we wished to study if the activation of H-Ras and ERK could induce nuclear translocation of Nrf2. To this end, 786-0 cells were either transfected with H-Ras(12V) plasmid, or treated with MEK inhibitor PD98059. Empty vector-transfected or vehicle-treated cells served as controls. Cytoplasmic and nuclear fractions were isolated from the cells, and the expression of Nrf2 was measured by Western blot analysis. We observed that following activation of H-Ras, indeed there was an increase in the expression level of nuclear Nrf2 compared with controls (Fig. 6A, left panel); as expected, there was also a decrease in the expression level of cytoplasmic Nrf2 following H-Ras activation (supplemental Fig. S4, left panel). In contrast, we found that following inhibition of ERK, there was a decrease in the expression of nuclear Nrf2 (Fig. 6A, right panel); as expected, there was also an increase in the expression of cytoplasmic Nrf2 following inhibition of ERK (supplemental Fig. S4, right panel). We observed (data not shown) that there was no significant change in the expression of total Nrf2 following H-Ras activation or ERK inhibition. These results suggest that the activation of H-Ras and ERK can induce translocation of Nrf2 from cytoplasm to nucleus of renal cancer cells.
FIGURE 6.
Nrf2 is important for H-Ras- and ERK-induced HO-1 transcription: A, 786-0 cells were transfected (overnight) with either different concentrations of H-Ras(12V) or empty vector (left panel); treated with either PD98059 (50 μm) or vehicle alone for different time intervals (right panel). Nuclear fractions were isolated from these cells, and Western blot analysis was performed to quantitate the expression of Nrf2 (top panels). The purities of nuclear fractions were determined through Western blot analysis to quantitate the expression of Lamin A (positive control) (middle panel) and GAPDH (negative control) (bottom panel), respectively. Results are representative of three independent experiments. B, 786-0 cells were transfected (overnight) with either H-Ras(12V) (1.0 μg) or empty vector (left panel); treated with either PD98059 (50 μm) or vehicle alone for 2 h (right panel). Nuclear fractions were isolated from these cells, and subjected to DNA binding ELISA for activated Nrf2 using the TransAM Nrf2 ELISA kit as described under “Experimental Procedures.” Nrf2 consensus binding site oligo was used to compete Nrf2 binding in order to monitor the specificity of the assay. Results are representative of two independent experiments. Columns, average of triplicate readings of two different samples; error bars, S.D. *, p < 0.05 compared with nuclear lysates from empty vector-transfected/vehicle-treated cells; **, p < 0.05 compared with nuclear lysates from H-Ras(12V)-transfected cells without any competitive inhibition. C, 786–0 cells were first transfected with either control or Nrf2 siRNA (25 nm). Following 24 h of siRNA transfection, the cells were co-transfected with the HO-1 promoter-luciferase construct (0.5 μg) and either H-Ras(12V) (0.5 μg) or the empty expression vector. The cells were harvested after 48 h of plasmid transfection, and fold change in luciferase activity was calculated as the relative luciferase counts from each group of cells compared with that of cells transfected with control siRNA and empty vector. Results are representative of three independent experiments. Columns, average of triplicate readings of two different samples; error bars, S.D. *, p < 0.01 compared with control siRNA- and empty vector-transfected cells; **, p < 0.01 compared with control siRNA- and H-Ras(12V)-transfected cells.
As described earlier, Nrf2 binds to ARE, located at the enhancer sites (E1 and E2) of the HO-1 promoter (18). Here, we examined if the activation of H-Ras and ERK promotes the binding of Nrf2 to the ARE site. Using the Nrf2 DNA binding ELISA kit, we observed that activation of H-Ras in 786-0 cells through the transfection of H-Ras(12V) increased the binding of activated Nrf2 to the specific DNA sequence, containing ARE site of the HO-1 promoter (Fig. 6B, left panel); and the binding of Nrf2 to the DNA was confirmed by competition assay using Nrf2 binding site oligo. We also found that the inhibition of ERK (through PD98059 treatment) decreased the DNA binding of Nrf2 (Fig. 6B, right panel).
Next, we wanted to dissect if Nrf2 is critical for H-Ras-induced HO-1 overexpression. 786-0 cells were transfected with either Nrf2 siRNA or the control siRNA to knockdown Nrf2 as shown in our earlier experiment in Fig. 5C. Following siRNA transfection, the cells were co-transfected with the HO-1 promoter-luciferase construct and either H-Ras(12V) or the empty expression vector, and luciferase assay was performed. As shown in Fig. 6C, we observed that the activation of H-Ras significantly increased HO-1 promoter activity in control siRNA-transfected cells; however, in Nrf2 siRNA-transfected cells, the activated H-Ras failed to induce HO-1 promoter activity. Together, these observations suggest that the H-Ras-ERK pathway activates Nrf2 in renal cancer cells, and promotes Nrf2-mediated HO-1 transcription.
H-Ras and ERK Pathway Can Regulate Apoptosis of Renal Cancer Cells through HO-1
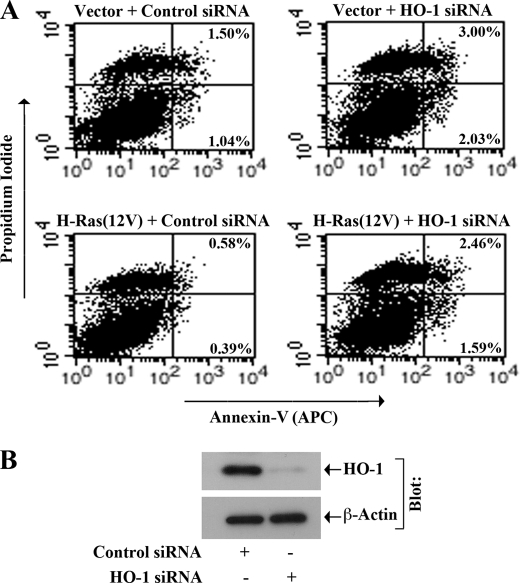
Our earlier experiments suggested that the H-Ras-ERK signaling pathway plays an important role in the overexpression of anti-apoptotic HO-1. Here, first we evaluated if the activation of H-Ras could decrease apoptosis of renal cancer cells through HO-1. 786-0 cells were transfected with different combinations of active H-Ras(12V) and HO-1 siRNA; empty vector and control siRNA-transfected cells served as respective controls. To check the apoptotic index of the cells, they were stained with Annexin-V and propidium iodide, and analyzed by flow cytometry. As shown in Fig. 7A, activation of H-Ras decreased the apoptosis of renal cancer cells; the percentage of early apoptotic cells decreased from 1.04% (vector + control siRNA-transfected cells) to 0.39% (H-Ras12V + control siRNA-transfected cells). However, the knockdown of HO-1 markedly increased the cellular apoptosis in H-Ras(12V)-transfected cells; the percentage of early apoptotic cells increased from 0.39% (H-Ras12V + control siRNA-transfected cells) to 1.59% (H-Ras12V + HO-1 siRNA-transfected cells) (Fig. 7A). The knockdown of HO-1 was confirmed by Western blot analysis (Fig. 7B).
FIGURE 7.
H-Ras-induced survival of renal cancer cells involves HO-1. 786-0 cells were transfected with either HO-1 siRNA (50 nm) or control siRNA. Following 24 h of siRNA transfection, the cells were transfected with H-Ras(12V) (1.0 μg) or empty vector, and incubated for another 48 h. A, apoptotic index of the cells was determined by Annexin-V (APC) and propidium iodide staining using an Apoptosis Detection kit as described under “Experimental Procedures.” B, knockdown of HO-1 following siRNA transfection was confirmed by Western blot analysis. Results are representative of three independent experiments.
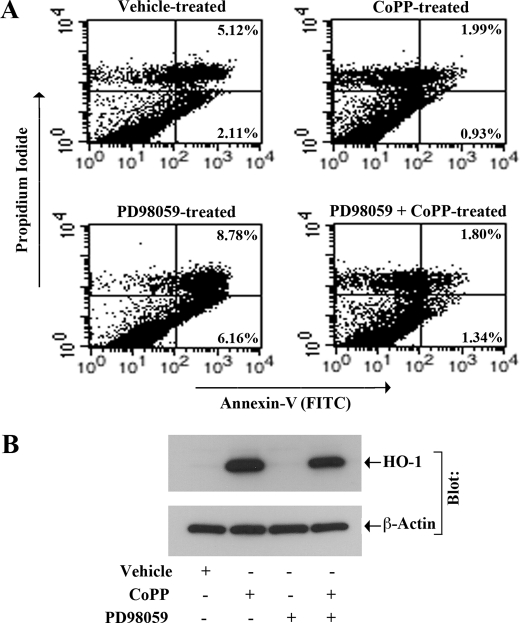
Next, we examined if the inhibition of ERK could induce apoptosis of renal cancer cells and if the overexpression of HO-1 could overcome the induced apoptosis. To this end, 786-0 cells were treated with the MEK inhibitor PD98059 in absence or presence of CoPP (the known inducer of HO-1 expression); vehicle-treated cells served as controls. As shown in Fig. 8A, treatment with PD98059 markedly increased the apoptosis of renal cancer cells compared with vehicle-treated controls; the percentage of early apoptotic cells increased from 2.11% (vehicle-treated control cells) to 6.16% (PD98059-treated cells). However, the overexpression of HO-1 following CoPP treatment significantly decreased PD98059-induced cellular apoptosis almost to the basal level; the percentage of early apoptotic cells decreased from 6.16% (PD98059-treated cells) to 1.34% (PD98059+CoPP-treated cells) (Fig. 8A). The overexpression of HO-1 in these cells following CoPP treatment was confirmed by Western blot analysis (Fig. 8B). Together, we suggest that the signaling through H-Ras and ERK pathway plays a crucial role in preventing apoptosis of renal cancer cells; and HO-1 may serve as a key player in H-Ras-ERK-mediated cell survival pathway.
FIGURE 8.
Inhibition of ERK induces apoptosis of renal cancer cells, and the overexpression of HO-1 can inhibit this process: 786-0 cells were treated with different combinations of CoPP (10 μm) and PD98059 (50 μm) for 24 h; control cells were treated with the vehicle alone. A, apoptotic index of the cells was determined by Annexin-V (FITC) and propidium iodide staining using an Apoptosis Detection kit as described under “Experimental Procedures.” B, overexpression of HO-1 following CoPP treatment was confirmed by Western blot analysis. Results are representative of three independent experiments.
DISCUSSION
The cytoprotective enzyme HO-1 plays a pivotal role in maintaining cellular homeostasis during inflammation (1, 4, 5). However, recent studies highlight its role in cancer (6–9); the expression of HO-1 is significantly up-regulated in different types of cancer, and the overexpressed HO-1 has been found to promote survival of tumor cells. In the present study, we show that activation of the Ras-Raf-ERK signaling cascade in human renal cancer cells can induce transcriptional activation of HO-1 through the transcription factor Nrf2; and the overexpressed HO-1 can promote survival of these tumor cells through inhibition of apoptosis.
HO-1 is induced in different cell types by a wide range of oxidative stress stimuli, like the generation of reactive oxygen species (ROS) (16, 21). An increased level of ROS may promote significant damage to cell structure and functions (11, 44). The anti-inflammatory and anti-apoptotic effects of HO-1 and its metabolites protect the cells and tissues from ROS-mediated injuries. Thus, overexpression of HO-1 may be beneficial for the treatment of various inflammatory disorders (3); induction of HO-1 can inhibit inflammatory reactions, and can even prevent the course of the disease. However, different human cancers express significant levels of HO-1, which may provide an advantage for the growth and metastasis of cancer cells (6–10, 45). In addition, tumor cells may bypass the killing effects of different chemotherapeutic agents due to the overexpression of HO-1. Accordingly, it has been suggested that HO-1 may be used as one of the potential targets in antitumor therapy to increase the level of ROS within the tumor and promote effective killing of tumor cells (11, 13, 14, 46).
We have recently demonstrated that HO-1 is highly up-regulated in human renal cancer tissues, and the overexpressed HO-1 can inhibit apoptosis of renal cancer cells (38). It is established that the mechanism of HO-1 expression is tightly regulated at the transcriptional level (15, 16). However, the regulatory mechanism(s) of HO-1 overexpression in cancer cells, including renal cancer, is not well defined. Previously, we have shown that the proto-oncogene H-Ras is activated in human renal cancer cells following immunosuppressive therapy, and the activated H-Ras can mediate proliferation of tumor cells (37). In this study, for the first time, we demonstrate that activated H-Ras can promote HO-1 transcriptional activation and protein overexpression in renal cancer cells. However, we suggest that H-Ras-induced protein overexpression might involve transcriptional as well as post-transcriptional events. Thus, the activated H-Ras can mediate a pro-survival signal through the overexpression of anti-apoptotic HO-1. Although we have found the critical role of H-Ras, we cannot rule out the effect of the other two Ras isoforms (K-Ras and N-Ras) in regulating HO-1 overexpression. Interestingly, it is known that PDGF treatment can activate the Ras pathway (39); and previously it has been demonstrated that it can induce HO-1 expression in vascular smooth muscle cells (47). However, no further signaling mechanism(s) have been defined for HO-1 expression. In this study, we find that PDGF can also promote HO-1 expression in renal cancer cells, known to express PDGFR (40).
The signals from active Ras can be channeled through several effector molecules. Here, we show that H-Ras-induced HO-1 transcription is mediated primarily through the Ras-Raf-ERK signaling pathway; however, the Rho pathway may also have some role in H-Ras-induced HO-1 overexpression. In support of our findings, it has been reported that the Ras-ERK and Rho-Rho kinase pathways can cooperate to regulate cellular functions (48). It is possible that there is some form of cross talk between the Rho kinase signal transduction pathway and the ERK pathway or even that they are part of the same signaling pathway (49). Our findings in this study suggest that the activation of ERK positively regulates HO-1 transcription. Interestingly, Naidu et al. (50) have demonstrated that p38, another member of the MAPK family, can negatively regulate HO-1 expression; and the inhibition of p38 MAPK up-regulates HO-1 through the ERK signaling pathway. Thus, it is possible that there is a fine balance between the ERK and p38 MAPK pathways for the regulation of HO-1 expression; and this balance may get disrupted in cancer cells.
As discussed earlier, Nrf2 is a critical transcription factor for HO-1 expression, and it binds to the ARE site of the gene promoter (16, 17, 20, 21). It has been reported that the expression of Nrf2 may be up-regulated in different types of cancer (41, 42); and blockade of Nrf2 can suppress tumor angiogenesis (42). In this study, we observe that Nrf2 is markedly overexpressed in human renal cancer tissues and cells, and plays a significant role in H-Ras-induced HO-1 transcriptional activation. It is known that Nrf2 is retained in the cytoplasm under normal conditions by interaction with its inhibitor KEAP1; but following activation, it is released from the inhibitor and translocates to the nucleus for activation of ARE-mediated gene expression (43). Here, we demonstrate that the activation of H-Ras and ERK induces nuclear translocation of activated Nrf2, and promotes its binding to the specific DNA sequence, containing ARE site of the HO-1 promoter. In support of our findings, it has been shown that the MAPK pathway can activate Nrf2 (51–53). Shen et al. (54) have demonstrated that the ERK pathway can positively regulate Nrf2 transactivation domain activity; however, it has also been suggested that the ERK pathway may induce Nrf2 by an indirect mechanism through the regulation of some co-activators. Our study suggests that although the H-Ras-ERK pathway can activate Nrf2, it may not be involved in Nrf2 overexpression; however, in future, it will also be interesting to dissect possible mechanism(s) of Nrf2 up-regulation in renal cancer.
In summary, H-Ras-induced HO-1 overexpression may play a critical role in the survival of human renal cancer cells from pro-apoptotic signals. Inhibition of HO-1 expression may facilitate effective killing of the tumor cells following treatment with chemotherapeutic agents. Thus, targeting the Ras-mediated signaling pathway for HO-1 expression may serve as novel therapeutics for the treatment of human renal cancer.
Supplementary Material
This work was supported, in whole or in part, by National Institutes of Health Grant R01 CA131145 (to S. P.).

The on-line version of this article (available at http://www.jbc.org) contains supplemental Figs. S1–S4.
- HO-1
- heme oxygenase-1
- ARE
- anti-oxidant response element
- CoPP
- cobalt protoporphyrin.
REFERENCES
- 1. Agarwal A., Nick H. S. (2000) J. Am Soc. Nephrol. 11, 965–973 [DOI] [PubMed] [Google Scholar]
- 2. Nath K. A. (2006) Kidney Int. 70, 432–443 [DOI] [PubMed] [Google Scholar]
- 3. Otterbein L. E., Soares M. P., Yamashita K., Bach F. H. (2003) Trends Immunol. 24, 449–455 [DOI] [PubMed] [Google Scholar]
- 4. Akagi R., Takahashi T., Sassa S. (2005) Contrib. Nephrol. 148, 70–85 [DOI] [PubMed] [Google Scholar]
- 5. Wagener F. A., Eggert A., Boerman O. C., Oyen W. J., Verhofstad A., Abraham N. G., Adema G., van Kooyk Y., de Witte T., Figdor C. G. (2001) Blood 98, 1802–1811 [DOI] [PubMed] [Google Scholar]
- 6. Jozkowicz A., Was H., Dulak J. (2007) Antioxid. Redox. Signal 9, 2099–2117 [DOI] [PMC free article] [PubMed] [Google Scholar]
- 7. Sass G., Leukel P., Schmitz V., Raskopf E., Ocker M., Neureiter D., Meissnitzer M., Tasika E., Tannapfel A., Tiegs G. (2008) Int. J. Cancer 123, 1269–1277 [DOI] [PubMed] [Google Scholar]
- 8. Goodman A. I., Choudhury M., da Silva J. L., Schwartzman M. L., Abraham N. G. (1997) Proc. Soc. Exp. Biol. Med. 214, 54–61 [DOI] [PubMed] [Google Scholar]
- 9. Miyake M., Fujimoto K., Anai S., Ohnishi S., Kuwada M., Nakai Y., Inoue T., Matsumura Y., Tomioka A., Ikeda T., Tanaka N., Hirao Y. (2011) Oncol. Rep. 25, 653–660 [DOI] [PubMed] [Google Scholar]
- 10. Was H., Dulak J., Jozkowicz A. (2010) Curr. Drug Targets 11, 1551–1570 [DOI] [PubMed] [Google Scholar]
- 11. Fang J., Seki T., Maeda H. (2009) Adv. Drug. Deliv. Rev. 61, 290–302 [DOI] [PubMed] [Google Scholar]
- 12. Fang J., Akaike T., Maeda H. (2004) Apoptosis 9, 27–35 [DOI] [PubMed] [Google Scholar]
- 13. Alaoui-Jamali M. A., Bismar T. A., Gupta A., Szarek W. A., Su J., Song W., Xu Y., Xu B., Liu G., Vlahakis J. Z., Roman G., Jiao J., Schipper H. M. (2009) Cancer Res. 69, 8017–8024 [DOI] [PubMed] [Google Scholar]
- 14. Rushworth S. A., Bowles K. M., Raninga P., MacEwan D. J. (2010) Cancer Res. 70, 2973–2983 [DOI] [PubMed] [Google Scholar]
- 15. Lavrovsky Y., Schwartzman M. L., Levere R. D., Kappas A., Abraham N. G. (1994) Proc. Natl. Acad. Sci. U.S.A. 91, 5987–5991 [DOI] [PMC free article] [PubMed] [Google Scholar]
- 16. Ryter S. W., Choi A. M. (2002) Antioxid. Redox Signal. 4, 625–632 [DOI] [PubMed] [Google Scholar]
- 17. Srisook K., Kim C., Cha Y. N. (2005) Antioxid. Redox Signal. 7, 1674–1687 [DOI] [PubMed] [Google Scholar]
- 18. Kivelä A. M., Kansanen E., Jyrkkänen H. K., Nurmi T., Ylä-Herttuala S., Levonen A. L. (2008) J. Nutr. 138, 1263–1268 [DOI] [PubMed] [Google Scholar]
- 19. Hock T. D., Liby K., Wright M. M., McConnell S., Schorpp-Kistner M., Ryan T. M., Agarwal A. (2007) J. Biol. Chem. 282, 6875–6886 [DOI] [PubMed] [Google Scholar]
- 20. Alam J., Wicks C., Stewart D., Gong P., Touchard C., Otterbein S., Choi A. M., Burow M. E., Tou J. (2000) J. Biol. Chem. 275, 27694–27702 [DOI] [PubMed] [Google Scholar]
- 21. Ferrándiz M. L., Devesa I. (2008) Curr. Pharm. Des. 14, 473–486 [DOI] [PubMed] [Google Scholar]
- 22. Rojo A. I., Salina M., Salazar M., Takahashi S., Suske G., Calvo V., de Sagarra M. R., Cuadrado A. (2006) Free Radic. Biol. Med. 41, 247–261 [DOI] [PubMed] [Google Scholar]
- 23. Schlessinger J. (1993) Trends Biochem. Sci. 18, 273–275 [DOI] [PubMed] [Google Scholar]
- 24. Downward J. (2003) Nat. Rev. Cancer 3, 11–22 [DOI] [PubMed] [Google Scholar]
- 25. Settleman J., Albright C. F., Foster L. C., Weinberg R. A. (1992) Nature 359, 153–154 [DOI] [PubMed] [Google Scholar]
- 26. Boguski M. S., McCormick F. (1993) Nature 366, 643–654 [DOI] [PubMed] [Google Scholar]
- 27. Khosravi-Far R., Chrzanowska-Wodnicka M., Solski P. A., Eva A., Burridge K., Der C. J. (1994) Mol. Cell. Biol. 14, 6848–6857 [DOI] [PMC free article] [PubMed] [Google Scholar]
- 28. Omerovic J., Hammond D. E., Clague M. J., Prior I. A. (2008) Oncogene 27, 2754–2762 [DOI] [PMC free article] [PubMed] [Google Scholar]
- 29. Datta D., Flaxenburg J. A., Laxmanan S., Geehan C., Grimm M., Waaga-Gasser A. M., Briscoe D. M., Pal S. (2006) Cancer Res. 66, 9509–9518 [DOI] [PubMed] [Google Scholar]
- 30. Mo L., Zheng X., Huang H. Y., Shapiro E., Lepor H., Cordon-Cardo C., Sun T. T., Wu X. R. (2007) J. Clin. Invest. 117, 314–325 [DOI] [PMC free article] [PubMed] [Google Scholar]
- 31. Eckert L. B., Repasky G. A., Ulkü A. S., McFall A., Zhou H., Sartor C. I., Der C. J. (2004) Cancer Res. 64, 4585–4592 [DOI] [PubMed] [Google Scholar]
- 32. Crespo P., Xu N., Simonds W. F., Gutkind J. S. (1994) Nature 369, 418–420 [DOI] [PubMed] [Google Scholar]
- 33. Leevers S. J., Paterson H. F., Marshall C. J. (1994) Nature 369, 411–414 [DOI] [PubMed] [Google Scholar]
- 34. Khosravi-Far R., White M. A., Westwick J. K., Solski P. A., Chrzanowska-Wodnicka M., Van Aelst L., Wigler M. H., Der C. J. (1996) Mol. Cell. Biol. 16, 3923–3933 [DOI] [PMC free article] [PubMed] [Google Scholar]
- 35. Rodriguez-Viciana P., Warne P. H., Dhand R., Vanhaesebroeck B., Gout I., Fry M. J., Waterfield M. D., Downward J. (1994) Nature 370, 527–532 [DOI] [PubMed] [Google Scholar]
- 36. Qiu R. G., Chen J., Kirn D., McCormick F., Symons M. (1995) Nature 374, 457–459 [DOI] [PubMed] [Google Scholar]
- 37. Datta D., Contreras A. G., Basu A., Dormond O., Flynn E., Briscoe D. M., Pal S. (2009) Cancer Res. 69, 8902–8909 [DOI] [PMC free article] [PubMed] [Google Scholar]
- 38. Datta D., Banerjee P., Gasser M., Waaga-Gasser A. M., Pal S. (2010) J. Biol. Chem. 285, 36842–36848 [DOI] [PMC free article] [PubMed] [Google Scholar]
- 39. Ekman S., Thuresson E. R., Heldin C. H., Rönnstrand L. (1999) Oncogene 18, 2481–2488 [DOI] [PubMed] [Google Scholar]
- 40. Xu L., Tong R., Cochran D. M., Jain R. K. (2005) Cancer Res. 65, 5711–5719 [DOI] [PubMed] [Google Scholar]
- 41. Stacy D. R., Ely K., Massion P. P., Yarbrough W. G., Hallahan D. E., Sekhar K. R., Freeman M. L. (2006) Head Neck 28, 813–818 [DOI] [PubMed] [Google Scholar]
- 42. Kim T. H., Hur E. G., Kang S. J., Kim J. A., Thapa D., Lee Y. M., Ku S. K., Jung Y., Kwak M. K. (2011) Cancer Res. 71 [DOI] [PubMed] [Google Scholar]
- 43. Satoh T., Okamoto S. I., Cui J., Watanabe Y., Furuta K., Suzuki M., Tohyama K., Lipton S. A. (2006) Proc. Natl. Acad. Sci. U.S.A. 103, 768–773 [DOI] [PMC free article] [PubMed] [Google Scholar]
- 44. Ryter S. W., Choi A. M. (2005) Antioxid. Redox Signal. 7, 80–91 [DOI] [PubMed] [Google Scholar]
- 45. Rushworth S. A., MacEwan D. J. (2008) Blood 111, 3793–3801 [DOI] [PubMed] [Google Scholar]
- 46. Berberat P. O., Dambrauskas Z., Gulbinas A., Giese T., Giese N., Künzli B., Autschbach F., Meuer S., Büchler M. W., Friess H. (2005) Clin Cancer Res. 11, 3790–3798 [DOI] [PubMed] [Google Scholar]
- 47. Durante W., Peyton K. J., Schafer A. I. (1999) Arterioscler. Thromb. Vasc. Biol. 19, 2666–2672 [DOI] [PubMed] [Google Scholar]
- 48. Jo M., Thomas K. S., Somlyo A. V., Somlyo A. P., Gonias S. L. (2002) J. Biol. Chem. 277, 12479–12485 [DOI] [PubMed] [Google Scholar]
- 49. Roberts R. E. (2004) J. Pharmacol. Exp. Ther. 311, 742–747 [DOI] [PubMed] [Google Scholar]
- 50. Naidu S., Vijayan V., Santoso S., Kietzmann T., Immenschuh S. (2009) J. Immunol. 182, 7048–7057 [DOI] [PubMed] [Google Scholar]
- 51. Zipper L. M., Mulcahy R. T. (2000) Biochem. Biophys. Res. Commun. 278, 484–492 [DOI] [PubMed] [Google Scholar]
- 52. Yu R., Chen C., Mo Y. Y., Hebbar V., Owuor E. D., Tan T. H., Kong A. N. (2000) J. Biol. Chem. 275, 39907–39913 [DOI] [PubMed] [Google Scholar]
- 53. Papaiahgari S., Kleeberger S. R., Cho H. Y., Kalvakolanu D. V., Reddy S. P. (2004) J. Biol. Chem. 279, 42302–42312 [DOI] [PubMed] [Google Scholar]
- 54. Shen G., Hebbar V., Nair S., Xu C., Li W., Lin W., Keum Y. S., Han J., Gallo M. A., Kong A. N. (2004) J. Biol. Chem. 279, 23052–23060 [DOI] [PubMed] [Google Scholar]
Associated Data
This section collects any data citations, data availability statements, or supplementary materials included in this article.


