

Abstract
The 15-kDa selenoprotein (Sep15) is a thioredoxin-like, endoplasmic reticulum-resident protein involved in the quality control of glycoprotein folding through its interaction with UDP-glucose:glycoprotein glucosyltransferase. Expression of Sep15 is regulated by dietary selenium and the unfolded protein response, but its specific function is not known. In this study, we developed and characterized Sep15 KO mice by targeted removal of exon 2 of the Sep15 gene coding for the cysteine-rich UDP-glucose:glycoprotein glucosyltransferase-binding domain. These KO mice synthesized a mutant mRNA, but the shortened protein product could be detected neither in tissues nor in Sep15 KO embryonic fibroblasts. Sep15 KO mice were viable and fertile, showed normal brain morphology, and did not activate endoplasmic reticulum stress pathways. However, parameters of oxidative stress were elevated in the livers of these mice. We found that Sep15 mRNA was enriched during lens development. Further phenotypic characterization of Sep15 KO mice revealed a prominent nuclear cataract that developed at an early age. These cataracts did not appear to be associated with severe oxidative stress or glucose dysregulation. We suggest that the cataracts resulted from an improper folding status of lens proteins caused by Sep15 deficiency.
Keywords: Antioxidants, Eye, Gene Knockout, Oxidation Reduction, Protein Folding, Selenium, Sep15, Cataract, Redox Homeostasis
Introduction
Selenium (Se) is a trace element that plays a role in immune function, reducing cancer incidence, and redox homeostasis in mammals (1–3). Se is primarily used in the form of selenocysteine, known as the 21st amino acid, which is encoded by UGA codon and located in the active sites of oxidoreductases (4, 5).
The 15-kDa selenoprotein (Sep15) was identified in mammals 13 years ago as a protein of unknown function (6). The NMR structure of the Drosophila melanogaster Sep15 revealed a thioredoxin-like fold within its oxidoreductase domain, with selenocysteine (Sec)2 located in the predicted catalytic position (7). Previous studies showed that Sep15 resides in the endoplasmic reticulum (ER) and interacts with UDP-glucose:glycoprotein glucosyltransferase (UGT) (8). The latter protein is a part of the calnexin-calreticulin glycoprotein folding cycle and is known to be responsible for targeting unfolded glycoproteins for calcium-dependent transient glucosylation. Sep15 contains the ER targeting peptide, but lacks an ER retention signal. The tight binding to UGT allows retention of Sep15 in the ER. These findings suggested that Sep15 may assist UGT function and control folding or secretion of certain glycoproteins.
Recently, Sep15 was found to be regulated by ER stress. Sep15 expression was up-regulated in response to adaptive ER stress caused by tunicamycin and brefeldin A. At the same time, more robust ER stress caused by DTT and thapsigargin treatments induced rapid proteasomal degradation of Sep15 (9). Presumably, disruption of Sep15-UGT interaction because of reduction of disulfide bonds in the Sep15 UGT-binding domain displaced Sep15 from the ER. Expression of Sep15 is higher in tissues with secretory functions, such as liver, kidney, prostate, and thyroid (10). Comparison of expression of Sep15 and other components of the protein folding quality control machinery revealed similar expression patterns in mouse brain, including enriched levels in the hippocampus and cerebellum. This observation further pointed to the role of Sep15 in glycoprotein folding (9).
Several studies suggested a role of Sep15 in cancer prevention. First, the human Sep15 gene is located on chromosome 1p31, in the locus often deleted or mutated in human cancers. In addition, Sep15 has two polymorphic sites that differentially regulate expression of this protein in response to selenium supplementation (11). Moreover, levels of Sep15 were decreased in prostate cancer cell lines and in hepatocarcinoma compared with non-transformed cells and tissues. Sep15 expression is also lowered in malignant lung, breast, prostate, and liver (12). These observations suggest a role of Sep15 in tumor suppression, possibly through regulation of folding and/or secretion of cancer-related glycoprotein substrates. However, the specific function of Sep15 in this process is not understood. At the same time, recent research demonstrated an opposite role for Sep15 in the promotion of growth of colon cancer cells (13, 14). Stable knockdown of Sep15 significantly reduced growth of CT26 cells in culture and prevented formation of colonies on soft agar. Mice injected with the Sep15-deficient cells developed fewer tumors and did not form pulmonary metastases as did mice injected with control cells. However, Sep15 deficiency had no effect on the growth of lung cells.
In this study, we describe Sep15 KO mice lacking exon 2 of the gene. Although the mutant mRNA was detected, the shortened dysfunctional Sep15 form was not present in these mice. Analyses of Sep15 KO mice did not reveal signs of ER stress and gross abnormalities. However, livers of Sep15 KO mice showed increased levels of malondialdehyde and protein carbonyls, indicative of mild oxidative stress. During the course of further analyses, we found that Sep15 mRNA was enriched in the developing ocular lens. Consistent with this observation, deficiency in the protein because of Sep15 KO resulted in the development of cataracts. This study highlights the roles of Sep15 in redox homeostasis and glycoprotein folding and indicates its function in the maintenance of lens transparency.
EXPERIMENTAL PROCEDURES
Development of Sep15 KO Mice
The Sep15 KO construct was prepared as follows. A 4202-bp fragment of Intron 1 was amplified from 129/Sv mouse genomic DNA by nested PCR with the following primers: round 1, 5′-CCAGTTAACTTCTACGGGTCTGTTACAAGTGGT-3′ and 5′-GTCCAGGCTGGCCCTGAACTAGCTCTGTGC-3′; and round 2, 5′-GTGGTCTCGAGTGGAAGCATCATTGACAGTTGATGGTACTGAAGTG-3′ and 5′-CTGTGCTCGAGACGACCTCACCCTGATTCTCCTGTCCAGTTCAGG-3′. The amplified fragment was cloned into the XhoI site of the pPNT vector. A second fragment of 4246 bp of intron 2 was amplified from 129/Sv mouse genomic DNA by nested PCR with the following primers: round 1, 5′-GCATACCAGGATTCATTCCACTGAGGCTGTCC-3′ and 5′-ACCCATCTTTATGGACGGTGTCACATGTC-3′; and round 2, 5′-AGGACCGGATCCCAGGATCACCATTGCCCTAGGCTTCCTGG-3′ and 5′-CCTGTGGATCCTGACTCTGCTGGCTGTGGTGGTTGTAGAGAAGC-3′. The amplified fragment was cloned into the BamHI site of the pPNT vector. The correct insert orientation of the fragments was confirmed by restriction analysis. The construct was digested with NotI, DNA fragments were separated by agarose gel electrophoresis, and the targeting DNA was purified from the gel. 129/Sv embryonic stem cells were transfected with the targeting construct, and recombinants were selected by growing stem cells in a neomycin-containing medium. Clones with successful construct recombination were identified by nested PCR with the following primer pairs for the neo-cassette and genomic DNA that was not part of the targeting construct: fragment 1, round 1, 5′-GGGAAGACAGTACCTTGTCATGTAAGTGG-3′ and 5′-GCTGCTAAAGCGCATGCTCCAGACTGCCTTGG-3′; fragment 1, round 2, 5′-CCAGTTAACTTCTACGGGTCTGTTACAAGTGG-3′ and 5′-CCTACCCGGTAGAATTGACCTGCAGG-3′; fragment 2, round 1, 5′-GAACGAGATCAGCAGCCTCTGTTCCAC-3′ and 5′-ACCCATCTTTATGGACGGTGTCACATGTC-3′; and fragment 2, round 2, 5′-GTTCTAATTCCATCAGAAGCTGACTCTAGA-3′ and 5′-CAGTCATGTTGCGCTGCCTTCCTGCCT-3′. Cells with proper construct integration were microinjected into C57Bl/6 blastocysts. The resulting chimeric mice were then mated with C57Bl/6 mice. Germ line transmission was confirmed by nested PCR as described above. The KO allele was transferred to the C57Bl/6 background through five rounds of cross-breeding with C57Bl/6 mice, and homozygous Sep15 KO animals were then generated by cross-breeding of Sep15 KO heterozygous mice. The KO phenotype was confirmed by Southern blotting, 75Se metabolic labeling, and immunoblot analyses as described under “Results.” For the RT-PCR experiments, total liver RNA was isolated by TRIzol extraction according to the manufacturer's protocol (Invitrogen). Genomic DNA was removed using a DNA removal kit (Ambion, Inc.). RNA was quantified with a spectrophotometer, and 5 μg were transcribed with 50 ng of random primer and 200 units of SuperScript III reverse transcriptase (Invitrogen). 1 μl of the resulting cDNA was used for analysis with primers specific for various regions of the mouse Sep15 gene.
Isolation of Mouse Embryonic Fibroblasts (MEFs) and Metabolic Labeling with 75Se
Embryos generated from WT and Sep15 KO mice were dissected out at embryonic day 13.5 and separated from maternal tissues. The embryos were treated with 0.05% trypsin at 4 °C for 30 min and incubated at 37 °C for 1 h. Embryonic cells were cultured in DMEM supplemented with 20% fetal bovine serum, 2 mm glutamine, 50 μm β-mercaptoethanol, and 100 units/ml penicillin/streptomycin. After 4 weeks, an aliquot of cells was frozen, and another aliquot was used for further experiments. For the analysis of Sep15 expression, WT and Sep15 KO MEFs were grown in DMEM supplemented with freshly neutralized 75Se-selenious acid (specific activity 1000 Ci/mmol, final concentration in the medium, 1 nm) for 24 h. Sep15 was immunoprecipitated using a protein G immunoprecipitation kit (Sigma) and 5 μl of Sep15-specific antibodies. Selenoproteins were visualized by SDS-PAGE followed by autoradiography using a PhosphorImager.
Cloning and in Vitro Expression of the Sep15 and Sep15Δ2 Forms
To analyze the possibility of expression of the Sep15 form lacking the Cys-rich UGT-binding domain encoded by exon 2 (Sep15Δ2), the Sep15Δ2 nucleotide sequence was amplified from Sep15 KO cDNA (prepared from total liver RNA) with primers 5′-ATCACTCGAGATGGCGGCAGGGCAGG-3′ and 5′-TGACTCTAGATTAATGATGATGATGATGATGTATGCGTTCCAACTTCTCG-3′ containing the XhoI and XbaI restriction sites and subcloned into pCI-neo using the corresponding restriction enzymes. The SECIS (Sec Insertion Sequence) element was separately amplified with the 5′-TGACTCTAGATTAGTAGTTTTTATACTAATC-3′ and 5′-ATGACGATCTGCGGCCGCTTTTTTTTAAAATCAAACATATTTGAAAG-3′ primers and cloned into the resulting vector at the Xba1 and Not1 sites. For localization experiments, the full-length Sep15 and Sep15Δ2 sequences were cloned into the pEGFPN1 vector with primers 5′-ATCAGCTAGCATGGCGGCAGGGCAGG-3′ and 5′-ACTTACAATATTACCGGTATTATGCGTTCCAACTTCTCG-3′ containing the NheI and AgeI restriction sites. All constructs were verified by sequencing. Sec was substituted with Cys by site-directed mutagenesis with primers 5′-CTTGAAGTCTGCGGATGTAAATTGGGGAGGTTCC-3′ and 5′-GGAACCTCCCCAATTTACATCCGCAGACTTCAAG-3′ (the introduced mutations are underlined).
Cell Culture Studies
Human HEK293 cells, mouse NIH 3T3 cells, and MEFs were cultured in DMEM supplemented with 10% FBS, 100 units/ml penicillin, and 100 units/ml streptomycin. Transfections were carried out using Lipofectamine (Invitrogen) according to the manufacturer's instructions. To analyze expression of Sep15 and Sep15Δ2, HEK293 cells were transfected with the pCI-neo vector coding for full-length Sep15 and Sep15Δ2 forms, and 18 h after transfection, the medium was replaced with that containing freshly neutralized 75Se-selenious acid (specific activity, 1000 Ci/mmol; final concentration in the medium, 1 nm). Cells were metabolically labeled for 24 h, and expression of selenoproteins was analyzed by SDS-PAGE followed by autoradiography.
To further analyze the expression of the full-length and Sep15Δ2 forms, NIH 3T3 cells were grown in 6-well plates and transfected with the corresponding EGFP fusion constructs or with an empty vector. Twenty-four hours after transfection, the original medium was replaced with serum-free medium, and after an additional 24 h, cells and media were collected. Cell lysates were prepared using CellLytic buffer (Sigma) according to the manufacturer's instructions. The conditioned media were concentrated to 40 μl using Centricon concentrators (Millipore). Cell extracts and concentrated media samples were analyzed by Western blotting using GFP-specific antibodies (Sigma).
To further characterize the expression of the full-length and Sep15Δ2 forms, NIH 3T3 cells were grown on coverslips, transfected with the corresponding constructs in pEGFPN1 expression vector, and 24 h after transfection, treated with 1 μm ER-Tracker Blue-White DPX dye (Invitrogen) for 20 min. Then, cells were washed with PBS, fixed in 4% formaldehyde in PBS, and mounted with mount media. Images were collected using a Bio-Rad MRC1024ES laser scanning microscope.
Metabolic Labeling of WT and Sep15 KO Mice
WT, heterozygous, and homozygous Sep15 KO mice received an intraperitoneal injection of 40 μCi of freshly neutralized 75 Se-selenious acid and were maintained on a 12-h light/dark cycle and a regular diet. After 48 h, mice were sacrificed, and extracts were prepared from various tissues in ice-cold PBS (pH 7.6) supplemented with complete protease inhibitor mixture (Roche). Extracts from the indicated tissues were subjected to SDS-PAGE, and proteins were transferred onto polyvinylidene difluoride membranes and analyzed with a PhosphorImager.
Tissue and Blood Preparation
Blood was obtained from sacrificed Sep15 KO and control mice from the heart vein. Brain and prostate tissues were immediately fixed in 10% neutral buffered formalin and washed with PBS. PBS-washed tissues were embedded in paraffin and cut on a standard microtome to 5-μm sections. The sections were deparaffinized in xylene and stained with hematoxylin (Invitrogen) and eosin (Sigma) to reveal the fine tissue structure. Images were taken using a light Olympus AX70 microscope. For prostate-specific antigen (PSA) analysis, erythrocytes were removed by centrifugation, and 30 μg of serum proteins were analyzed by Western blotting with PSA-specific antibodies (Dako). Brains were stained with the indicated antibodies at dilutions of 1:1000–1:5000 at 4 °C overnight.
Analyses of Oxidative Stress Parameters
Protein extracts from liver, kidney, heart, testis, and brain were prepared in PBS containing a complete protease inhibitor mixture. Malondialdehyde was measured using the Oxiselect Thiobarbituric Acid Reactive Substances (TBARS) assay kit (Cell Biolabs, San Diego, CA) according to the manufacturer's instructions. Protein carbonyl content was assayed using 2,4-dinitrophenyl hydrazine (molar extinction coefficient of 22 mm−1 cm−1). Total and protein thiol contents were measured using 5,5′-dithiobis(2-nitrobenzoic acid).
Analysis of SelP Secretion in Hepatocytes
Hepatocytes of WT and Sep15 KO mice were obtained according to the procedures published previously (15, 16). Briefly, livers from 3-month-old mice were perfused with Ca2+- and SO42−-free buffer (6 mm glucose, 115 mm NaCl, 25 mm NaHCO3, 6 mm KCl, 1 mm MgCl2x6H2O, 1 mm NaH2PO4). After liver was cleared from the blood, collagenase (700 units/ml, Sigma) was added at the concentration of 0.1 mg/ml. Tissues were removed and dissociated by gentle rubbing in perfusion buffer. The suspension was then filtered through a 70-μm cell strainer by gravity flow. Then, hepatocytes were washed three times in Williams E medium (Sigma) supplemented with 2 mm l-glutamine (Invitrogen) seeded on collagen-coated 5-cm plates. Forty-eight hours later, the medium was replaced with 3 ml of serum-free medium containing freshly neutralized 75Se selenious acid and supplemented with dimethyl sulfoxide or ER stress-inducing agents, 1 mm DTT, 10 μg/ml brefeldin A, 5 μg/ml tunicamycin, or 20 μm monensin. Cells and media were collected 24 h later, and media samples were concentrated as described above for NIH 3T3 cells. Cell lysates and concentrated media were analyzed by SDS-PAGE followed by autoradiography.
Tunicamycin Injection
WT and Sep15 KO mice were given a single 1 μg/g body weight intraperitoneal injection of a 0.05 mg/ml suspension of tunicamycin in 150 mm dextrose as described (17). These mice were euthanized 72 h after injection, and their livers were removed. Protein lysates were resolved by SDS-PAGE and analyzed by Western blotting using antibodies specific for Sep15, BiP, and β-actin.
Analysis of Sep15 Expression in the Lens During Embryonic Development
Mouse embryonic head tissues were fixed in 4% p-formaldehyde solution for 30 min on ice, equilibrated with 30% sucrose overnight at 4 °C, and embedded in OCT for cryosectioning. Coronal sections at 13-μm thickness were generated using a cryostat (Leica). Frozen sections of embryos at various stages of development were brought to room temperature (RT), blocked for 15 min at RT with a blocking solution containing 5% chicken serum and 0.01% Tween in PBS, and incubated at 4 °C overnight with a rabbit anti-mouse Sep15 antibody at 1:50 dilution in blocking buffer. After three 5-min washes with PBS, sections were incubated for 1 h at room temperature with chicken anti-rabbit Alexa Fluor 595 secondary antibodies (Invitrogen). Sections were stained with DAPI for 5 min followed by washing, mounting, and image collection. All experiments were performed with primary and secondary antibody-only controls that exhibited no detectable signal, and images were obtained by confocal microscopy using a Leica model TCS SP2 instrument with optical sections of 0.6–1.0 μm. Digitized images were processed with Adobe Photoshop.
Phenotypic Screening of Cataracts
Phenotypic screening was performed via slit lamp examination as described (18). Mouse pupils were dilated by 1% atropine, and 15 min later lenses were examined with a slit lamp. Observed opacities were quantified using the Lens Opacities Classification System, version II (18–20). For ex vivo phenotyping, eyes were dissected for lens phenotyping by ex vivo dark field photomicroscopy as described previously (21, 22). For measurement of glucose levels, mice were fasted for 8 h. Glucose was measured in blood from the tail vein using the Elite system (Bayer) glucometer as described by the manufacturer. The data were analyzed with analysis of variance (p < 0.05 for limit).
RESULTS
Generation of Sep15 KO Mice
Sep15 KO mice were generated by homologous recombination. The KO construct was designed to exchange exon 2 with the selection marker followed by a transcription termination signal (Fig. 1, A and B). Genotypes of mice were confirmed by PCR analysis. However, subsequent RT-PCR analysis showed a signal of Sep15 mRNA in Sep15 KO tissues. To determine the organization of this mRNA, we used primer pairs for various parts of the Sep15 mRNA (Fig. 1C). Amplification with primers specific for the first and third exons gave fragments of different sizes in WT and Sep15 KO mice, whereas the use of primers downstream of exon 3 showed fragments of similar size. Further sequencing of the fragment amplified with primers specific for exons 1 and 5 revealed that the truncated Sep15 KO mRNA lacked exon 2. However, because the reading frame was preserved and the shortened mRNA form had both an in-frame UGA codon and a SECIS element in the 3′ UTR, the possibility that the mutant mRNA supported Sec insertion and therefore selenoprotein synthesis had to be considered. To test for possible expression of the shortened protein product in Sep15 KO mice, we prepared MEFs from WT and Sep15 KO mice and subjected them to metabolic labeling with 75Se (Fig. 1D). Selenoprotein patterns were similar in WT and Sep15 KO MEFs, with the exception of a 14-kDa band that was missing in Sep15 KO MEFs. This band corresponded to the migration property of Sep15 following removal of the N-terminal signal peptide. To verify that the 14-kDa band was Sep15, we carried out immunoprecipitation with Sep15-specific antibodies. This analysis precipitated a 14-kDa protein in WT MEFs but not in Sep15 KO MEFs (Fig. 1D). In addition, we did not detect any selenoprotein bands migrating lower than 14 kDa in either WT or Sep15 KO samples subjected to immunoprecipitation. These data suggest that Sep15 KO mice express neither Sep15 nor its shortened form lacking sequences encoded by exon 2.
FIGURE 1.

Preparation of Sep15 KO mice. A, structure of the mouse Sep15 gene. B, structure of the KO allele. Coding regions are shown in light gray, and DNA flanking regions used for homologous recombination are shown in dark gray. The second exon was replaced with the Neo gene containing a transcription termination signal. C, RT-PCR analysis of Sep15 mRNA in WT and Sep15 KO mice with primers for the indicated regions of Sep15. The aldolase gene was used as a control. D, analysis of Sep15 expression in MEFs derived from WT and Sep15 KO mice. Cells were labeled with 75Se followed by immunoprecipitation with antibodies specific for Sep15. The two left lanes show labeled MEFs. Immunoprecipitated (i.p.) and flow-through (flow) fractions are shown for each MEF line in the right lanes. The arrow on the right indicates migration of Sep15.
Characterization of the Truncated Sep15Δ2Form
Because Sep15 KO mice synthesized a shortened mRNA form, we further examined the possibility that it could code for a protein fragment. The predicted size of Sep15 selenoprotein lacking the region encoded by exon 2 (further designated Sep15Δ2) is 107 amino acids (11.6 kDa) (Fig. 2, A and B). Transfection of the Sep15Δ2 construct into HEK293 cells did not reveal a band of the expected size when cells were labeled with 75Se (Fig. 2C). We also tested the possibility that Sep15Δ2 was secreted by cells because it lacked the domain that retained the protein in the ER due to interaction with UGT. To exclude this possibility, we prepared constructs for Cys mutants (i.e. Cys replacing Sec) of Sep15Δ2 and Sep15 fused with GFP. HEK293 cells transfected with these constructs showed Sep15Δ2-GFP and Sep15-GFP bands, and these protein forms were absent in the medium (Fig. 2D). We also transfected NIH 3T3 cells with the same constructs and examined localization of Sep15 protein forms (Fig. 2E). Full-length Sep15-GFP colocalized with the ER tracker, whereas Sep15Δ2-GFP showed a different localization pattern wherein the protein seemed to be in granules (it did not correspond to mitochondria or lysosomes). Thus, Sep15Δ2 was not expressed in transfected mammalian cells on the basis of Western blot analysis data, extremely sensitive 75Se labeling of cell lysates, and immunoprecipitation of Sep15 from 75Se-labeled cells. When Sep15Δ2 was fused to a large globular protein (i.e. GFP) and, in addition, had its Sec replaced with Cys (Sec insertion is very slow, and replacing this residue with Cys is a method used to dramatically increase protein expression), the protein could be expressed, but it changed localization. We conclude from the above observations that Sep15 KO cells lack functional Sep15.
FIGURE 2.

Characterization of a shortened Sep15 form. A, amino acid sequence and predicted size of Sep15Δ2. B, schematic representation of domain organization of Sep15 and its correspondence to gene structure. C, Sep15 and Sep15Δ2 were expressed in HEK293 cells followed by labeling of cells with 75Se. Expression of proteins was compared with the selenoprotein expression profile in MEFs derived from WT and Sep15 KO mice. D, Western blot analysis of Cys mutants of Sep15-EGFP and Sep15Δ2-EGFP expressed in NIH 3T3 cells. Protein expression was analyzed in cell extracts and concentrated media. E, localization of Sep15 and Sep15Δ2. Colocalization of Sep15 forms (green) and the ER marker (blue) are shown.
Absence of Sep15 Does Not Affect Expression of Other Selenoproteins
Selenoprotein expression depends on availability of dietary Se (23, 24). In addition, removal of one selenoprotein may affect expression of other selenoproteins, e.g. because of increased availability of Sec-tRNA or by influencing redox homeostasis. To examine this possibility, WT and heterozygous and homozygous Sep15 KO mice were metabolically labeled with 75Se (supplemental Fig. S1). However, expression of other selenoproteins was unchanged.
Oxidative Stress in Sep15 KO Mice
We examined parameters of oxidative stress in livers of WT and Sep15 KO mice. Sep15 KO livers showed increased levels of malondialdehyde (p < 0.0001) and protein carbonyls (p < 0.0001), whereas amounts of total thiols and protein thiols were found to be decreased compared with controls (p < 0.05) (Fig. 3). The data show increased lipid and protein oxidation and suggest mild oxidative stress in Sep15 KO livers.
FIGURE 3.

Oxidative stress in Sep15 KO mice. Levels of malondialdehyde, protein carbonyls, total thiols, and protein thiols in livers of WT (white bars) and Sep15 KO (black bars) mice are shown as mean ± S.D. *, p < 0.001.
Analysis of Sep15 KO Mice for Prostate and Brain Pathologies
Sep15 is expressed at elevated levels in prostate, liver, kidney, testis, and brain (25). At the same time, Sep15 expression is decreased in malignant prostate cell lines and in hepatocarcinoma. We examined Sep15 KO mice for phenotypes associated with prostate and brain. Prostate was examined in 1.5 year-old males (n = 13) (supplemental Fig. S2A). No signs of neoplasia were observed. PSA is a plasma protein whose expression is increased during prostate pathologies, such as inflammation and malignant transformation. No differences in PSA levels were observed in serum samples of WT and Sep15 KO mice (supplemental Fig. S2B).
Selenoprotein deficiency is also known to be associated with neuronal pathology (24). For example, mice lacking SelP show seizures and ataxia and die before weaning when fed a Se-deficient diet (26). Comparative analysis of gene expression data in the Allen Brain Atlas revealed expression of all selenoproteins and selenocysteine incorporative machinery in the brain, including high expression of Sep15 (27). In addition, disruption of neuronal expression of selenoproteins led to neurological symptoms and neurodegeneration (28, 29). Similar symptoms were observed in glutathione peroxidase 4 (GPx4) KO mice (30) and in TrspΔAE/AE mice expressing hypomorphic tRNA(Ser)Sec (28). Sep15 expression is high in Ammon's horn and the dentate gyrus of the hippocampus and in Purkinje cells of the cerebellar cortex (27). We analyzed brains of Sep15 KO mice (supplemental Fig. S2). The hippocampal and cortex areas of Sep15 KO mice showed no signs of astrogliosis, and its levels of glial fibrillary acidic protein and parvalbumin were similar to those in WT mice. Thus, Sep15 deficiency did not lead to the loss of parvalbumin-positive interneurons observed in mouse models with a general deficiency in selenoprotein expression. Analysis of cerebellar morphology of Sep15 KO mice also did not reveal abnormalities. Thus, Sep15 deficiency does not lead to spontaneous neurodegeneration, consistent with an apparent lack of behavioral phenotypes.
Sep15 Deficiency Does Not Influence SelP Secretion
As a UGT-binding partner, Sep15 may be involved in protein folding and secretion. Sep15 is also regulated by the unfolded protein response (UPR). SelP is a major plasma selenoprotein synthesized in the liver and transporting Se to other organs. SelP maturation, intracellular transport, and secretion occur through the common ER-Golgi pathway in the liver (31). We examined the possibility that Sep15 KO affects SelP secretion. Hepatocytes from WT and Sep15 KO mice were isolated and metabolically labeled with 75Se. The cells were also treated with compounds that compromise function of the ER-Golgi pathway (supplemental Fig. S3). This treatment did not affect the viability of cells (data not shown). Treatment of hepatocytes with brefeldin A is known to abrogate SelP secretion, which is what we observed in both WT and Sep15 KO hepatocytes, whereas treatment with tunicamycin and monensin caused accumulation of intracellular non-glycosylated or partially glycosylated SelP forms. As expected, treatment with this compound induced expression of BiP in both WT and Sep15 KO hepatocytes.
Sep15 Deficiency Does Not Lead to Activation of the UPR
To further assess the function of Sep15, WT and Sep15 KO mice were injected intraperitoneally with 1 μg/g body weight tunicamycin or vehicle and sacrificed 72 h after injection. This treatment induced both BiP and Sep15 expression in WT mice (Fig. 4), consistent with previous data in cell culture (9). BiP was elevated similarly in WT and Sep15 KO mice, so the absence of Sep15 did not augment the UPR.
FIGURE 4.
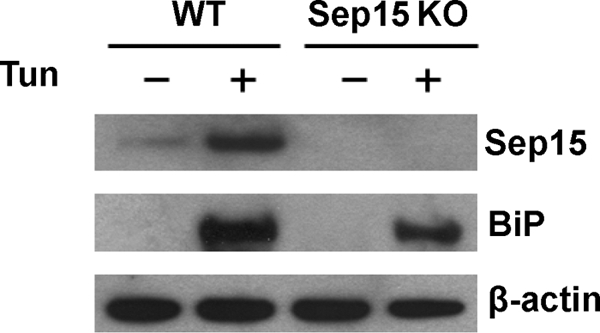
Sep15 deficiency does not lead to activation of the UPR. WT and Sep15 KO mice were injected intraperitoneally with tunicamycin (Tun) (1 μg/g body weight) or vehicle. 72 h after injection, mice were euthanized, livers extracted, and protein lysates from livers probed by immunoblot assays with polyclonal antibodies specific for Sep15 and BiP or monoclonal β-actin antibody as a loading control.
Sep15 mRNA Expression Is Progressively Lens-enriched during Mouse Development
Because our data suggested that Sep15 may play a role in the quality control of protein folding, we hypothesized that deficiency in this protein may lead to protein misfolding or aggregation. A prominent human disease associated with altered protein folding is cataract formation, with opacities caused by aggregation of lens structural proteins such as α-crystallins. It has been proposed that genes that are expressed in a lens-enriched manner in the developing mouse lens may have a functional role in the development and maintenance of lens transparency and, therefore, may represent candidate genes for cataract formation (32). In this approach, lens enrichment of a candidate gene is scored against its expression in whole embryonic tissues at various stages in development3 This approach has been successful in identifying cataract loci (33). Therefore, we investigated whether Sep15 mRNA was enriched in the lens during stages of lens invagination (E10.5) through primary fiber cell differentiation (E12.5). We found expression of Sep15 mRNA to be progressively enriched at E12.5 (Fig. 5). To gain insights into Sep15 protein expression in the lens, we performed immunofluorescence experiments using Sep15 antibodies and analyzed lens sections at various stages of mouse embryonic development (Fig. 5B and supplemental Fig. S4). Our data indicate that Sep15 protein is expressed in the anterior epithelium of the lens. In addition, conforming to the progressive enrichment of Sep15 transcripts in the lens, Sep15 protein expression was also found to be progressively enriched during lens development. For example, Sep15 expression in the lens anterior epithelium was found to be significantly higher in the E18.5 when compared with the E13.5 embryos. Together, the expression data are consistent with an important role of Sep15 during lens development.
FIGURE 5.

Enrichment of Sep15 mRNA during lens development. A, Sep15 mRNA expression was analyzed at the indicated stages of embryogenesis and compared with the whole body Sep15 mRNA expression. *, p < 0.05. Over 150 lenses (representing each embryonic stage) from E10.5-, E11.5-, and E12.5-stage mouse embryos were pooled for each biological replicate, and the microarray was performed in triplicate. The graph is based on the expression values, in the lens or whole body samples, of normalized fluorescent signal intensities for the probe dataset specific to the Sep15 gene. B, immunofluorescent staining of lens at E13.3 and E18.5. AEL, anterior epithelium of the lens; FC, fiber cells. Sep15 staining is shown in red, and DAPI staining is shown in blue. The asterisks indicate a significant increase in Sep15 signal in the anterior epithelium of the lens.
Development of Cataract in Sep15 KO Mice
To directly assess cataract formation in Sep15 KO mice, we carried out slit lamp examination for cataract scoring, which revealed lens opacity in both male (n = 10) and female (n = 7) Sep15 KO mice (Fig. 6A). Observed opacities were quantified using the Lens Opacities Classification System, version II. Nuclear changes were classified by scoring the degree of opalescence. In our experiment, a clear lens was assigned a grade of 0 and a fully opaque lens a grade of 5. The opacity grade increased with age, on the basis of the comparison of 1.5 and 6-month old females (n = 12). Fundus camera examination was also conducted, and representative images are shown in Fig. 6B. A group of Sep15 KO mice was examined by slit lamp followed with ex vivo phenotyping, including lens dissection followed by microscopy analyses. In this experiment, we used 2.5-month old males (n = 3) and females (n = 3) as well as 10-month-old males (n = 4) and females (n = 3). Both lenses of each KO mouse showed nuclear opacity that increased in size with age. Sep15 KO mice predominantly developed nuclear cataracts. Representative images of the lenses dissected from 2-month and 10-month Sep15 KO and control mice are shown in Fig. 6, C–H, and supplemental Fig. S5. Although some of the 10-month-old control mice developed age-related punctate opacity (Fig. 6H), cataract formation in Sep15 KO mice was more prominent and occurred in all mice. Moreover, all examined 2-month-old Sep15 KO mice had cataracts, whereas cataract formation was not observed in 2-month-old controls. To further characterize cataracts, we performed a histological analysis of lenses derived from 3-month-old Sep15 KO and control mice. Lenses from Sep15 KO mice demonstrated extensive vacuolization and aberrant structure of fiber cells evident in the lens nuclear region (supplemental Fig. S6). Together, the expression data suggest an important role for Sep 15 in development and maintenance of lens transparency.
FIGURE 6.

Development of cataracts in Sep15 KO mice. A, quantification of slit lamp examination of control and Sep15 KO mice. Opacity was quantified using the Lens Opacities Classification System, version II. The scale was from a completely clear (grade 0) to a fully opaque (grade 5) lens. L, left; R, right. B, representative images of opacities in Sep15 KO mice using a fundus camera. Six-month-old WT and Sep15 KO females were used. L, left; R, right. C–H, representative cataracts in Sep15 KO mice. Each panel shows lenses from the same animal. The left panels represent in vivo slit lamp examination, and the right panels show dark field analyses of the same lens examined in vitro. C and D, representative lenses from 2-month-old Sep15 KO females. Nuclear opacity is shown with a red arrow. E, 2-month-old WT female (control) showing no nuclear opacity. F and G, 10-month-old Sep15 KO females. Nuclear opacity is shown with red arrows. H, 10-month-old WT female that developed age-related punctate opacity.
DISCUSSION
Sep15 is an ER-resident protein implicated in the calnexin-dependent quality control cycle. Our previous studies showed that Sep15 forms a 1:1 complex with UGT, a protein that recognizes improperly folded or partially unfolded glycoproteins and subjects them to the calnexin cycle. In addition to the Cys-rich UGT-binding domain, Sep15 has a thioredoxin-like domain containing a redox active CXU (Cys and Sec separated by another residue) motif, suggesting a thiol oxidoreductase function for this protein. Sep15 is also differentially regulated by ER stress. Adaptive ER stress caused by tunicamycin or brefeldin A treatments induces Sep15 expression, whereas acute stress caused by treatments with disulfide-reducing DTT or thapsigargin, a compound that disrupts calcium flux from the ER, leads to a rapid proteasomal degradation of Sep15 (9). However, the specific function of Sep15 in these processes is not known. Sep15 is expressed at elevated levels in secretory organs such as prostate, liver, kidney, testis, and brain. At the same time, Sep15 expression is decreased in prostate cancer cells and in hepatocarcinoma. Stable Sep15 knockdown was also found to make cells more susceptible to oxidative stress.
In this study, we generated and characterized Sep15 KO mice that were viable and fertile and with no obvious phenotypes during development and growth. These mice were obtained by deleting exon 2 coding for the UGT-binding domain of Sep15. Although the mRNA for a shortened Sep15 form was synthesized, the corresponding protein could not be detected under any conditions tested. Moreover, even when this protein form was forced into expression in cell culture by fusion with GFP and replacement of Sec with Cys, it had an abnormal localization. Therefore, Sep15 KO mice lacked functional Sep15.
Initial characterization of Sep15 KO mice revealed no phenotypes with regard to expression of other selenoproteins, susceptibility to treatments that induce ER stress, or protein secretion. Strong interaction between Sep15 with UGT implied the role of Sep15 in the quality control of glycoprotein folding. Thus, we analyzed the effect of Sep15 deficiency on secretion of plasma glycoprotein SelP. However, no differences were found between WT and Sep15 KO hepatocytes subjected or not subjected to ER stress. Apparently, SelP is not a target of Sep15. Previous experiments in cell culture also suggested the involvement of Sep15 in the UPR. Therefore, we examined the levels of BiP (a marker of UPR) in WT and Sep15 KO hepatocytes. Tunicamycin treatment led to a robust increase in BiP expression in Sep15 KO hepatocytes. However, this protein was induced to a similar level in WT and Sep15 KO mice.
Although the observed phenotypes of Sep15 KO mice were mild, we reasoned that because Sep15 is elevated by the UPR, Sep15 deficiency might modulate development of certain ER stress-associated diseases. One such disease is cataract formation resulting from improper protein folding and posttranslational modifications, leading to decreased lens transparency. It has been proposed that lens-enriched genes may represent promising targets associated with cataract formation. Recently, deficiency of a gene with a highly lens-enriched expression pattern was found to cause congenital cataracts in humans, mice, and chickens (29, 30). We found that Sep15 mRNA was progressively enriched in three critical stages of mouse lens development. In addition, transcripts for several proteins functionally linked to Sep15 were found to be enriched in the lens (e.g. UGT1, calreticulin), whereas others (e.g. UGT2, calnexin, ERp57, and SelM), although not enriched, were expressed in the lens. This provides further support that Sep15 function is important in the lens.
Further analysis revealed that nearly every Sep15 KO mouse developed mild nuclear cataracts, some as early as 1.5 months of age. One of the factors that may influence cataract formation is glucose imbalance. We analyzed glucose levels in fasted mice, but they were comparable with those in WT controls (supplemental Fig. S7). Cataracts may also result from increased protein oxidation and aggregation. Indeed, we found that Sep15 KO mice showed increased levels of both lipid and protein oxidation. To further examine this possibility, we analyzed the ratio of reduced to oxidized glutathione and levels of thiols in lenses. However, these parameters were similar in Sep15 KO and WT lenses (supplemental Fig. S7, B and C). Therefore, it remains to be determined whether Sep15 KO induced cataracts are directly associated with general oxidative stress. Another explanation for cataract formation is the improper folding or disulfide status of Sep15 targets. For example, similar symptoms were described previously in mice lacking connexin 46 (34, 35). Connexins are a family of gap junction proteins whose mutations are associated with cataract development in human subjects (36, 37). In the case of Sep15 KO cataracts, further studies are needed to determine the precise function of Sep15 in protein folding, but interaction of this selenoprotein with the protein folding sensor is consistent with the role of protein misfolding in Sep15-dependent cataract development.
Overall, this study shows that the absence of Sep15 does not affect viability and does not lead to obvious phenotypes in mice. To better understand Sep15 function and the role of this selenoprotein in glycoprotein folding, it would be important to identify the subset of Sep15 targets and examine their posttranslational modifications in WT and Sep15 KO mice. Cataracts are the major cause of blindness in the world. Several types of cataracts are associated with excessive ER stress and the UPR (38, 39). However, little is known about the link between defective protein secretion pathways and cataract formation. Future experiments in this direction may lead to a better understanding of the association between abnormal glycoprotein folding/modification and human disease.
Supplementary Material
This study was supported, in whole or in part, by National Institutes of Health Grant CA080946 (to V. N. G.) and the Intramural Research Program of the Center for Cancer Research, National Cancer Institute, National Institutes of Health (to D. L. H.).

The on-line version of this article (available at http://www.jbc.org) contains supplemental Figs. S1–S7.
S. A. Lachke, G. V. Kryukov, J. W. Ho, D. J. O'Connell, S. E. Choe, A. Aboukhalil, M. L. Bulyk, P. Park, S. R. Sunyaev, and R. L. Maas, manuscript in preparation.
- Sec
- selenocysteine
- ER
- endoplasmic reticulum
- UGT
- UDP-glucose:glycoprotein glucosyltransferase
- MEF
- mouse embryonic fibroblasts
- PSA
- prostate-specific antigen
- Sep15
- the 15-kDa selenoprotein
- SelP
- selenoprotein P
- UPR
- unfolded protein response
- E10.5
- embryonic day 10.5.
REFERENCES
- 1. Battin E. E., Brumaghim J. L. (2009) Cell Biochem. Biophys. 55, 1–23 [DOI] [PubMed] [Google Scholar]
- 2. Hoffmann P. R., Berry M. J. (2008) Mol. Nutr. Food Res. 52, 1273–1280 [DOI] [PMC free article] [PubMed] [Google Scholar]
- 3. Jackson M. I., Combs G. F., Jr. (2008) Curr. Opin. Clin. Nutr. Metab. Care 11, 718–726 [DOI] [PubMed] [Google Scholar]
- 4. Papp L. V., Lu J., Holmgren A., Khanna K. K. (2007) Antioxid. Redox Signal. 9, 775–806 [DOI] [PubMed] [Google Scholar]
- 5. Lobanov A. V., Hatfield D. L., Gladyshev V. N. (2009) Biochim. Biophys. Acta 1790, 1424–1428 [DOI] [PMC free article] [PubMed] [Google Scholar]
- 6. Gladyshev V. N., Jeang K. T., Wootton J. C., Hatfield D. L. (1998) J. Biol. Chem. 273, 8910–8915 [DOI] [PubMed] [Google Scholar]
- 7. Ferguson A. D., Labunskyy V. M., Fomenko D. E., Araç D., Chelliah Y., Amezcua C. A., Rizo J., Gladyshev V. N., Deisenhofer J. (2006) J. Biol. Chem. 281, 3536–3543 [DOI] [PubMed] [Google Scholar]
- 8. Korotkov K. V., Kumaraswamy E., Zhou Y., Hatfield D. L., Gladyshev V. N. (2001) J. Biol. Chem. 276, 15330–15336 [DOI] [PubMed] [Google Scholar]
- 9. Labunskyy V. M., Yoo M. H., Hatfield D. L., Gladyshev V. N. (2009) Biochemistry 48, 8458–8465 [DOI] [PMC free article] [PubMed] [Google Scholar]
- 10. Hu Y. J., Korotkov K. V., Mehta R., Hatfield D. L., Rotimi C. N., Luke A., Prewitt T. E., Cooper R. S., Stock W., Vokes E. E., Dolan M. E., Gladyshev V. N., Diamond A. M. (2001) Cancer Res. 61, 2307–2310 [PubMed] [Google Scholar]
- 11. Kumaraswamy E., Malykh A., Korotkov K. V., Kozyavkin S., Hu Y., Kwon S. Y., Moustafa M. E., Carlson B. A., Berry M. J., Lee B. J., Hatfield D. L., Diamond A. M., Gladyshev V. N. (2000) J. Biol. Chem. 275, 35540–35547 [DOI] [PubMed] [Google Scholar]
- 12. Kumaraswamy E., Korotkov K. V., Diamond A. M., Gladyshev V. N., Hatfield D. L. (2002) Methods Enzymol. 347, 187–197 [DOI] [PubMed] [Google Scholar]
- 13. Irons R., Tsuji P. A., Carlson B. A., Ouyang P., Yoo M. H., Xu X. M., Hatfield D. L., Gladyshev V. N., Davis C. D. (2010) Cancer. Prev. Res. (Phila.) 3, 630–639 [DOI] [PMC free article] [PubMed] [Google Scholar]
- 14. Hatfield D. L., Yoo M. H., Carlson B. A., Gladyshev V. N. (2009) Biochim. Biophys. Acta 1790, 1541–1545 [DOI] [PMC free article] [PubMed] [Google Scholar]
- 15. Bahjat F. R., Dharnidharka V. R., Fukuzuka K., Morel L., Crawford J. M., Clare-Salzler M. J., Moldawer L. L. (2000) J. Immunol. 165, 6559–6567 [DOI] [PubMed] [Google Scholar]
- 16. Gohla A., Klement K., Piekorz R. P., Pexa K., vom Dahl S., Spicher K., Dreval V., Häussinger D., Birnbaumer L., Nürnberg B. (2007) Proc. Natl. Acad. Sci. U.S.A. 104, 3003–3008 [DOI] [PMC free article] [PubMed] [Google Scholar]
- 17. Zinszner H., Kuroda M., Wang X., Batchvarova N., Lightfoot R. T., Remotti H., Stevens J. L., Ron D. (1998) Genes Dev. 12, 982–995 [DOI] [PMC free article] [PubMed] [Google Scholar]
- 18. Wang K., Cheng C., Li L., Liu H., Huang Q., Xia C. H., Yao K., Sun P., Horwitz J., Gong X. (2007) Invest. Ophthalmol. Vis. Sci. 48, 3719–3728 [DOI] [PubMed] [Google Scholar]
- 19. Taylor H. R., Lee J. A., Wang F., Muñoz B. (1991) Invest. Ophthalmol. Vis. Sci. 32, 529–532 [PubMed] [Google Scholar]
- 20. Leske M. C., Chylack L. T., Jr, Sperduto R., Khu P., Wu S. Y., McCarthy D. (1988) Arch. Ophthalmol. 106, 327–329 [DOI] [PubMed] [Google Scholar]
- 21. Goldstein L. E., Muffat J. A., Cherny R. A., Moir R. D., Ericsson M. H., Huang X., Mavros C., Coccia J. A., Faget K. Y., Fitch K. A., Masters C. L., Tanzi R. E., Chylack L. T., Jr., Bush A. I. (2003) Lancet 361, 1258–1265 [DOI] [PubMed] [Google Scholar]
- 22. Moncaster J. A., Pineda R., Moir R. D., Lu S., Burton M. A., Ghosh J. G., Ericsson M., Soscia S. J., Mocofanescu A., Folkerth R. D., Robb R. M., Kuszak J. R., Clark J. I., Tanzi R. E., Hunter D. G., Goldstein L. E. (2010) PLoS ONE 5, e10659 [DOI] [PMC free article] [PubMed] [Google Scholar]
- 23. Schomburg L., Schweizer U. (2009) Biochim. Biophys. Acta 1790, 1453–1462 [DOI] [PubMed] [Google Scholar]
- 24. Schweizer U., Bräuer A. U., Köhrle J., Nitsch R., Savaskan N. E. (2004) Brain Res. Brain Res. Rev. 45, 164–178 [DOI] [PubMed] [Google Scholar]
- 25. Labunskyy V. M., Hatfield D. L., Gladyshev V. N. (2007) IUBMB Life 59, 1–5 [DOI] [PubMed] [Google Scholar]
- 26. Schweizer U., Michaelis M., Köhrle J., Schomburg L. (2004) Biochem. J. 378, 21–26 [DOI] [PMC free article] [PubMed] [Google Scholar]
- 27. Zhang Y., Zhou Y., Schweizer U., Savaskan N. E., Hua D., Kipnis J., Hatfield D. L., Gladyshev V. N. (2008) J. Biol. Chem. 283, 2427–2438 [DOI] [PubMed] [Google Scholar]
- 28. Carlson B. A., Schweizer U., Perella C., Shrimali R. K., Feigenbaum L., Shen L., Speransky S., Floss T., Jeong S. J., Watts J., Hoffmann V., Combs G. F., Gladyshev V. N., Hatfield D. L. (2009) Biochem. J. 418, 61–71 [DOI] [PMC free article] [PubMed] [Google Scholar]
- 29. Wirth E. K., Conrad M., Winterer J., Wozny C., Carlson B. A., Roth S., Schmitz D., Bornkamm G. W., Coppola V., Tessarollo L., Schomburg L., Köhrle J., Hatfield D. L., Schweizer U. (2010) FASEB J. 24, 844–852 [DOI] [PMC free article] [PubMed] [Google Scholar]
- 30. Seiler A., Schneider M., Förster H., Roth S., Wirth E. K., Culmsee C., Plesnila N., Kremmer E., Rådmark O., Wurst W., Bornkamm G. W., Schweizer U., Conrad M. (2008) Cell Metab. 8, 237–248 [DOI] [PubMed] [Google Scholar]
- 31. Steinbrenner H., Alili L., Stuhlmann D., Sies H., Brenneisen P. (2007) Biol. Chem. 388, 1043–1051 [DOI] [PubMed] [Google Scholar]
- 32. Lachke S. A., Maas R. L. (2010) Wiley Interdiscip. Rev. Syst. Biol. Med. 2, 305–323 [DOI] [PMC free article] [PubMed] [Google Scholar]
- 33. Lachke S. A., Alkuraya F. S., Kneeland S. C., Ohn T., Aboukhalil A., Howell G. R., Saadi I., Cavallesco R., Yue Y., Tsai A. C., Nair K. S., Cosma M. I., Smith R. S., Hodges E., Alfadhli S. M., Al-Hajeri A., Shamseldin H. E., Behbehani A., Hannon G. J., Bulyk M. L., Drack A. V., Anderson P. J., John S. W., Maas R. L. (2011) Science 331, 1571–1576 [DOI] [PMC free article] [PubMed] [Google Scholar]
- 34. Gong X., Agopian K., Kumar N. M., Gilula N. B. (1999) Dev. Genet. 24, 27–32 [DOI] [PubMed] [Google Scholar]
- 35. Graw J. (2009) J. Genet. 88, 469–486 [DOI] [PubMed] [Google Scholar]
- 36. Pfenniger A., Wohlwend A., Kwak B. R. (2011) Eur. J. Clin. Invest. 41, 103–116 [DOI] [PubMed] [Google Scholar]
- 37. Santhiya S. T., Kumar G. S., Sudhakar P., Gupta N., Klopp N., Illig T., Söker T., Groth M., Platzer M., Gopinath P. M., Graw J. (2010) Mol. Vis. 16, 1837–1847 [PMC free article] [PubMed] [Google Scholar]
- 38. Ikesugi K., Yamamoto R., Mulhern M. L., Shinohara T. (2006) Exp. Eye Res. 83, 508–516 [DOI] [PubMed] [Google Scholar]
- 39. Shinohara T., Ikesugi K., Mulhern M. L. (2006) Med. Hypotheses 66, 365–370 [DOI] [PubMed] [Google Scholar]
Associated Data
This section collects any data citations, data availability statements, or supplementary materials included in this article.