Abstract
The modern multi-channel cochlear implant is widely considered to be the most successful neural prosthesis for its ability to restore partial hearing to post-lingually deafened adults and to allow essentially normal language development in pre-lingually deafened children. However, the implant performance varies greatly in individuals and is still limited in background noise, tonal language understanding, and music perception. One main cause for the individual variability and the limited performance in cochlear implants is spatial channel interaction from the stimulating electrodes to the auditory nerve and brain. Here we systematically examined spatial channel interactions at the physical, physiological, and perceptual levels in the same 5 modern cochlear implant subjects. The physical interaction was examined using an electric field imaging technique, which measured voltage distribution as a function of electrode position in the cochlea in response to stimulation of a single electrode. The physiological interaction was examined by recording electrically evoked compound action potentials as a function of electrode position in response to stimulation of the same single electrode position. The perceptual interactions were characterized by changes in detection threshold as well as loudness summation in response to in-phase or out-of-phase dual-electrode stimulation. To minimize potentially confounding effects of temporal factors on spatial channel interactions, stimulus rates were limited to 100 Hz or lower in all measures. Several quantitative channel interaction indexes were developed to define and compare the width, slope, and symmetry of the spatial excitation patterns derived from these physical, physiological, and perceptual measures. The electric field imaging data revealed a broad but uniformly asymmetrical intracochlear electric field pattern, with the apical side producing wider half-width and shallower slope than the basal side. On the contrary, the evoked compound action potential and perceptual channel interaction data showed much greater individual variability. It is likely that actual reduction in neural and higher level interactions, instead of simple sharpening of electric current field, would be the key to predict and hopefully improve the variable cochlear implant performance. The present results are obtained with auditory prostheses but can be applied to other neural prostheses, in which independent spatial channels, rather than high stimulation rate, are critical to their performance.
Keywords: Electric stimulation, Auditory nerve, Electric field, Compound action potential, Threshold, Loudness, Neural interface, Neural prosthesis
1. INTRODUCTION
Electric stimulation serves as an effective means of activating nerves and controlling activity patterns in a wide range of man-machine interfaces, including sensory neuroprostheses (Rutten, 2002), brain-computer interfaces (Pesaran et al., 2006), and functional electrical stimulation (Peckham and Knutson, 2005). Generally speaking, electric stimulation of the neural tissue has a main advantage and a main drawback. The main advantage of electric stimulation is that the fast distribution of charges in neural tissue allows accurate reproduction of complicated temporal firing patterns. The main drawback is that spatial selectivity of the excitation pattern is severely limited by the widespread nature of electric fields in the extracellular tissue.
As the most successful neural prosthesis to date, the cochlear implant (CI) has partially restored functional hearing to more than 200,000 profoundly deafened persons. Modern multi-channel cochlear implants can deliver rapid electric stimulation at a rate as high as several thousands of Hertz per electrode but have only 12 to 22 intracochlear electrodes, much less than the 3,000 inner hair cells in a normal human cochlea (e.g., Zeng et al., 2008). In spite of the success, modern CI users still face two major challenges at present. Firstly, the individual performance varies greatly among the present implant users. The reasons for this great variability remain unclear (e.g., Skinner et al., 2002). Secondly, compared with normal-hearing listeners, cochlear-implant listeners still have extreme difficulty in music perception, speech recognition in noise, and tonal language understanding (e.g., Zeng, 2004). In addition to a lack of encoding of temporal fine structure in the modern cochlear implants (e.g., Wilson et al., 1991), insufficient independent channels due to spatial interaction is likely responsible for the great individual variability and difficulty in music perception and speech recognition in noise (e.g., Zeng, 2004, Smith et al., 2002, Shannon et al., 2004).
To increase the number of independent spatial channels, recent CI research has focused on either reducing channel interaction or taking advantage of channel interaction. First, coiled electrode arrays or positioners have been designed to place the electrodes closer to the neurons than earlier electrode arrays, presumably reducing stimulation threshold and channel interaction (e.g., Tykocinski et al., 2001, Stickney et al., 2006). Second, bipolar or tripolar stimulation mode can produce more narrowly-focused electric fields than monopolar stimulation (e.g., Bierer, 2007, Srinivasan et al., 2010). Third, stimulation waveform shapes such as anodic-first pulses, pseudo-monophasic pulses, or tri-phasic pulses may also increase spatial selectivity (e.g., van Wieringen et al., 2005). Finally, stimulating two or more electrodes may produce a “virtual channel” that is perceptually distinctive from each of the two real channels represented by the physical electrode (e.g., Bonham and Litvak, 2008, Wilson et al., 2003). Despite significant effort, these methods of increasing the number of independent channels have not yet produced improved CI performance (e.g., Berenstein et al., 2008, Donaldson et al., 2011, Chua et al., 2011). A main reason for this unsatisfactory result is likely to be a lack of fundamental understanding of channel interactions in particular and its relationship to performance in general.
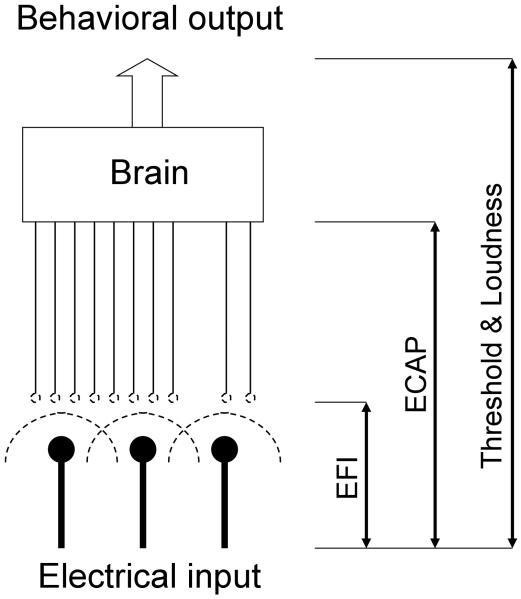
The present study addresses this lack of understanding by focusing on spatial channel interactions at electrical, neural, and perceptual levels. Fig. 1 illustrates three major sources of channel interactions and different measures that can be used to delineate these sources. At the physical level, the degree of electric field interactions between two stimulating electrodes depends on both electric stimulation parameters such as amplitude and duration (e.g., Grill and Mortimer, 1996) as well as electrode-tissue interface parameters such as electrode configuration and impedance (e.g., Frijns et al., 1995, Jolly et al., 1996, Rattay et al., 2001, Ranck, 1975). Modern cochlear implants have employed an electric field imaging (EFI) technique to measure potential distributions across the entire electrode array in the cochlea (e.g., Vanpoucke et al., 2004a, Vanpoucke et al., 2004b).
Figure 1.
Schematic diagram showing channel interactions in the electrode-neuron-brain interface. Electrical field imaging (EFI) is used to characterize direct electric interactions between electrodes (dashed semi-circular lines); Evoked compound action potentials (ECAP) to characterize neural interactions; Threshold and loudness measures to characterize behavioral channel interactions.
Channel interactions also arise at the neural level, which can be totally independent of electric field interactions. Imagine an extreme case where only one neuron is present: No matter how many independent electrodes are provided, there is only one functionally independent channel at the neural level. Another example of neural interaction is in the time domain: electric fields can be simultaneously turned on and off, but neural interactions still occur if two stimuli are presented within the refractory period of the nerve fibers, e.g., up to several milliseconds (van den Honert and Stypulkowski, 1984). Modern cochlear implants use a non-stimulating electrode in the cochlea to record the Electrically Evoked Compound Action Potential (ECAP) from a population of nerve fibers (Brown et al., 1990, Brown et al., 1996, Rubinstein, 2004). The ECAP can be used to quantify channel interactions at the neural level (Abbas et al., 2004, Cohen et al., 2003, Cohen et al., 2004, Hughes and Abbas, 2006b, Hughes and Abbas, 2006a, Eisen and Franck, 2005, Eisen and Franck, 2004a).
Channel interactions can be reflected by behavioral measures, which may have a peripheral origin, or a central origin, or both. For example, detection thresholds may be lowered by in-phase, sub-threshold simultaneous stimulation on two adjacent electrodes, but elevated by out-of-phase stimulation (de Balthasar et al., 2003, Eddington, 1978, Favre and Pelizzone, 1993). This change in threshold is likely a result of electric field summations at the physical level. Another example is the elevated perceptual threshold in the presence of prior stimulation, which probably reflects refractory properties at the neural level (Nelson and Donaldson, 2001). Finally, loudness summation, which is measured as increased loudness in response to two or more physically independent stimuli, is presumably a result of neural processing at the central level (Chatterjee and Oba, 2004, Chatterjee and Shannon, 1998, Abbas and Brown, 1988, McKay et al., 1995, Shannon, 1983).
The present study used low-rate (≤100 Hz) stimulation to focus on spatial channel interaction because potentially confounding temporal factors such as residual charge and refractoriness rarely last longer than several milliseconds. At these low rates with at least 10-ms inter-stimulus interval, electric stimulation is unlikely to affect either electrical field distribution or the neural and behavioral responses. For example, electric dynamic range changes significantly for stimulation rates higher than 300 Hz but is essentially constant for stimulation rates lower than 100 Hz (Shannon, 1985, Zeng and Shannon, 1994). In contrast to previous studies, the present work systematically measured channel interactions at physical, physiological, and behavioral levels in the same cochlear-implant subjects, allowing assessment of relative contributions of electrical, neural and perceptual factors to channel interactions. The first experiment recorded the distribution of intracochlear potentials as a function of electrode position in response to simultaneous stimulation of one or two electrode sites. The second experiment measured ECAP growth functions at each of the 16 electrodes as well as neural interactions in three locations near the apical, middle, and basal part of the electrode array. The third experiment evaluated changes in detection thresholds and loudness summation as a function of phase difference between simultaneous stimulation of two electrodes. Several new measures were introduced to assess quantitatively the width of the excitation pattern and the degree of asymmetry in these measured channel interaction patterns. Correlation analysis was conducted to delineate the relationship of these different channel interaction measures and their relative contribution to speech performance. Implication of the present results will be discussed in relation to development of future cochlear implants and other neural prostheses.
2. METHODS
2.1. Subjects
Five cochlear-implant users participated in the present study. Table 1 displays the demographic information regarding these subjects. Three subjects (S1, S2 and S3) used a Clarion CII device, and the other two subjects (S4 and S5) used a HiRes 90K device (Advanced Bionics Corporation, Valencia, CA). All subjects were implanted with a HiFocus electrode array without the positioner (1.1mm separation between electrodes). The age of the subjects at the time of the experiments ranged from 46 to 71 yrs. The duration of implant use ranged from 1 to 5 yrs. The Institutional Review Board of the University of California, Irvine approved the subject recruitment and testing protocols.
Table 1.
Subject demographical information. The duration of deafness was defined as the time at which the subject first noticed hearing loss to the time at which the subject received a cochlear implant. Percent correct scores of HINT sentence recognition using clinically-mapped speech processors were obtained in quiet and in speech-spectrumshaped noise (10 dB signal-to-noise ratio)
| Subject |
Age (yrs) |
Device type |
Duration of implant use (yrs) |
Duration of deafness (yrs) |
Sentence score in quiet (%) |
Sentence score in noise (%) |
Etiology |
|---|---|---|---|---|---|---|---|
| S1 | 71 | CII | 5 | 20 | 94 | 70 | Hereditary |
| S2 | 63 | CII | 3 | 61 | 72 | 33 | Spinal meningitis |
| S3 | 68 | CII | 5 | 62 | 91 | 40 | Unknown |
| S4 | 47 | HiRes 90K |
1 | 2 | 74 | 6 | Sudden hearing lossa |
| S5 | 46 | HiRes 90K |
2 | 11 | 100 | 80 | Unknown |
S4 had normal hearing in the left ear. The subject was implanted as a result of severe tinnitus after sudden hearing loss.
2.2. Electric Field Imaging (EFI)
All electric stimuli were generated and controlled by the Bionic Ear Data Collection System software (BEDCS v1.17.208, 2006, Advanced Bionics Corporation, Valencia, CA). Monopolar electrode configuration (Ex) was used, where x represents the intracochlear electrode number ranging from the most apical (1) to the most basal position (16), with the reference electrode being located near the implant receiver case outside of the cochlea.
EFI spatial profiles were obtained by applying an electric pulse at one electrode while recording the voltage potential at the remaining electrodes, using the customized BEDCS backward telemetry system. EFI spatial profiles were recorded for stimulating the apical electrode E1, middle electrode E9, and basal electrode E15. To test linearity, EFI spatial profiles were recorded by simultaneous stimulation of two locations at E1 and E9, E9 and E15, or E1 and E15, respectively. The stimuli were single, charge-balanced, biphasic pulses with 53.9 μs/phase in the EFI experiment. Stimulation level was set to 50 μA with one-electrode stimulation or 25 μA with two-electrode simultaneous stimulation. The intra-cochlear potentials were acquired with a 9-bit analog-to-digital converter at a sampling rate of 55.6 kHz. The gain setting of the internal recording was 30.4 dB. The recording started before the onset of the stimulus and had a total duration of 8 ms.
2.3. Electric Compound Action Potential (ECAP)
ECAP recordings were obtained using the same equipment and parameters as the EFI experiment, except for the following parametric settings. First, a 60 dB gain was used in the preamplifier to capture the relatively small neural potentials. Furthermore, 32 sweeps were averaged to increase the signal-to-noise ratio. The inter-sweep interval was 48 ms, resulting in a nominal rate of about 20 Hz for the ECAP recording. Finally, stimulation level was selected to cover the entire dynamic range of the single electric stimulus. Dynamic range was defined as the electric current difference between the threshold and the most comfortable level (MCL). Threshold of the single pulse was obtained using an adaptive, three-interval, forced choice (3IFC) with trial-by-trial feedback (Levitt, 1971), while the MCL of the same single pulse was measured using a method of limits with the ascending sequence only (Zeng et al., 1998).
A forward-masking subtraction technique was used to remove the stimulus artifact (Brown et al., 1990). This subtraction technique took advantage of the neural refractory properties and used 3 biphasic (32.32 μs/phase) pulses, including: (A) Masker only, (B) Probe only, and (C) Masker and Probe with a masker-probe-interval MPI of 452.6 μs, which was assumed to be shorter than the absolute refractory period of the auditory fibers.
Fig. 2 explains the rationale of using these three stimuli and shows the exemplary recording waveform. The masker only condition (A) produced a neural response to the masker Rm plus its electric artifact Am. The probe only condition (B) produced a neural response to the probe pulse Rp plus its electric artifact Ap. The combined masker and probe condition (C) produced the same neural response to the masker but no neural response to the probe due to the refractory effect. Because the combined condition still produced the same electric artifacts Am and Ap, adding (A) and (B) subtracting (C) effectively removed the neural response to the masker and cancelled the electric artifacts, yielding a neural response to the probe. Finally, the neural response was enhanced by off-line averaging the responses to the anodic and cathodic-leading pulses, which produced slight differences in latency between the two responses that needed to be corrected by the off-line procedure (Klop et al., 2004). The bottom trace of Fig. 2 shows a representative ECAP waveform. The ECAP amplitude is defined as the difference between the first negative peak (N1) and the following depolarization (P2) peak.
Figure 2.
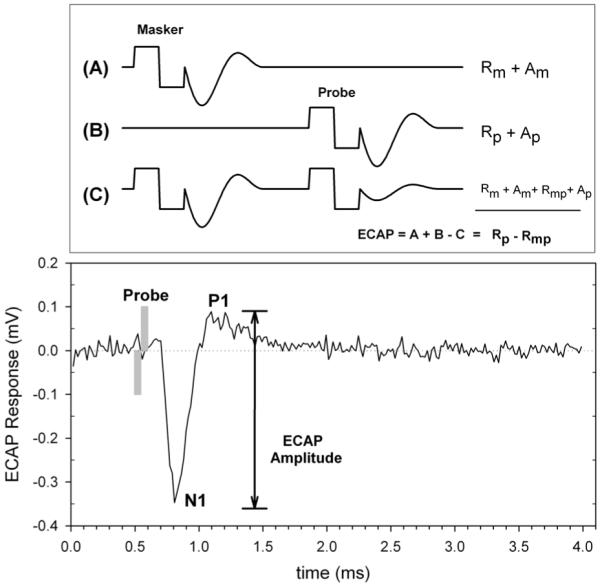
Forward-masking artifact subtraction technique (top panel) and the resulting ECAP response (bottom panel). The ECAP amplitude is defined as the difference between the negative (N1) and positive (P1) peaks of the compound action potential. See text for details.
By applying the forward masker to one electrode and the probe to another electrode, we can estimate the spatial overlap in the neural excitation pattern between the two electrodes. In contrast to the electric field interaction, which only counts the overlap between two electric fields, the extent of the neural interaction actually measures the relative overlap between the population of neurons excited by masker and probe. To systematically measure the neural interaction across the cochlea, the masker was presented to all electrodes other than the recording electrode. The probe electrode was E1, E9 or E15, with the adjacent electrode E2, E10 or E16 serving as the recording electrode, respectively.
2.4. Threshold interaction
The threshold was measured using an adaptive, three-interval, forced choice (3IFC) with trial-by-trial feedback (Levitt, 1971). The stimulus level was decreased with two correct responses and increased with one incorrect response. A reversal occurred with a change in the response direction from either correct to incorrect responses or vice versa. The stop criteria were either 40 trials or 8 reversals, whichever occurred first. The step size for varying the signal level was 10 μA for the first 2 reversals and 2.5 μA for the next 3-8 reversals. The threshold was obtained by averaging the values from the reversals with the smaller step size and approximated the 71% correct point on the psychometric function.
To measure behavioral channel interaction, simultaneous stimulation of two electrodes was used with electrode E1, E9 or E15 being the first electrode site, while the remaining odd-numbered electrodes were being used as the second site. The stimuli were 100-Hz, 500-ms biphasic (107.8 μs/phase) pulse trains. The electric current of the second stimulation site was presented at 2 subthreshold levels (20% and 60% of the threshold). Thresholds were obtained first at all electrodes with anodic-leading pulse trains. A positive probe level indicated that the probe and the masker were in phase, while a negative probe level indicated that the probe and the masker had opposite phases.
Similar to previous studies (Eddington et al., 1978, Shannon, 1983, Stickney et al., 2006), the following simple linear equation was used to calculate the behavioral channel interaction index at the threshold level (CIIth)
| (1) |
where Iprobe is the probe level needed to reach threshold in the presence of a masker, Imasker is the masker level, and Thprobe is the probe threshold without masker.
2.5. Loudness interaction
Different from threshold interaction, in which the masker was always presented at a sub-threshold level, the probe and the masker were both presented at a supra-threshold level (i.e., audible) in loudness interaction. Three suprathreshold levels, namely, very soft, medium soft, and soft, were used in the loudness interaction experiment.
The most comfortable loudness level (MCL) for all single electrodes was first measured using the method of limits with an ascending sequence only and used as a reference point. A loudness balance procedure was then used, in which two stimuli (A and B) were presented to the subject: A was single electrode stimulation at MCL and B was dual-electrode stimulation with a fixed masker level. The subject was instructed to bracket the point of equal loudness by first adjusting the probe level on stimuli B to a level that B was just-noticeably louder than A, then to a level that B was just-noticeably softer, and then to the level of equal loudness. The subject clicked the “up” or “down” button on the computer screen to adjust the level. One electrode was used as the probe and the other electrode was used as a masker. The probe and masker electrodes were reversed to counter balance any pitch related influences on loudness judgment. For each pair of electrodes, six data points were obtained to construct the equal loudness contour.
To derive a new loudness interaction model, an exponential loudness growth function was used for single-electrode stimulation (Zeng and Shannon, 1994)
| (2) |
where L is the perceived loudness as an exponential function of electric stimulation E, k and α are constants that depend on stimulation modes and parameters. For two-electrode simultaneous stimulation, the total loudness is presumably determined by three components, the no overlapping component from electrode 1, the overlapping component between electrodes 1 and 2, and the no overlapping component from electrode 2
| (3) |
where L is the perceived loudness of two-electrode stimulation, CIIl is the loudness channel interaction index between 0 and 1, E1 is the stimulation level on electrode 1, and E2 is the stimulation level on electrode 2. When loudness is balanced between single-electrode stimulation and two-electrode stimulation, the following equation is satisfied
| (4) |
Re-arranging Eq. (4), we obtain
| (5) |
Considering the following two boundary conditions. If CIIl = 1, then total interaction occurs between the two electrodes. Eq. (5) is simplified to:
| (6) |
If CIIl=0, then no direct electric interaction occurs between the two electrodes. The total loudness is the sum of loudness of two independent electric stimuli, so Eq. (5) becomes
| (7) |
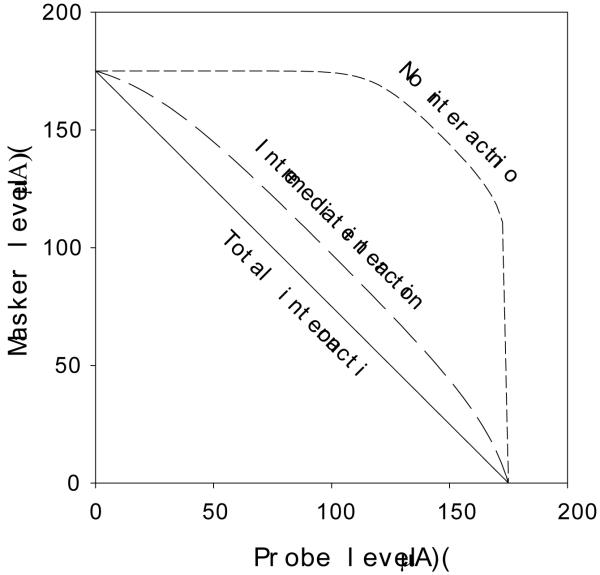
Figure 3 shows three loudness scenarios representative of channel interaction. If there were no interaction between the masker and the probe, then loudness of dual electrode stimulation would be the sum of the loudness evoked by the masker and the probe (no-interaction scenario where CIIl=0). On the other hand, when significant interaction occurs, electric fields would be summed up before exponential transformation for the perceived loudness. The solid diagonal line represented this total interaction scenario (CIIl=1). The dashed line represented an intermediate interaction case. The present loudness summation model will be used to derive loudness channel interaction index and to compare with other channel interaction indexes.
Figure 3.
Representative channel interactions modeled by loudness summation.
3. RESULTS
3.1. Channel interactions at the physical level
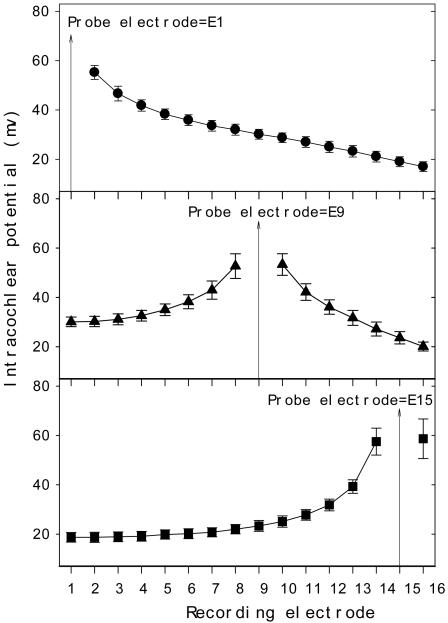
Figure 4 shows the group mean Electrical Field Imaging (EFI), representing intracochlear potential data as a function of the recording electrode in response to electric stimulation on E1, E9 or E15 (indicated by the vertically arrowed line in top, middle, and bottom panel, respectively). First, note the small standard error of the mean (average=2.6 mV, range=1.8-8.0mV), indicating a highly uniform electric field profile across these five subjects. Second, note an asymmetrical distribution of the EFI profile, with the apical side decaying more steeply (from E8 to E1 in the middle panel and from E14 to E1 in the bottom panel) than the basal side (from E2 to E16 in top panel and from E10 to E16 in the middle panel). Third, note an apical plateau around 30 mV from E1 to E3 in the middle panel and 20 mV from E1 to E6 in the bottom panel that decays on the basal side.
Figure 4.
Electrode field imaging data at E1 (top panel), E9 (middle panel), and E15 (bottom panel): Mean and standard error of the intracochlear potentials as a function of recording electrode position from five subjects.
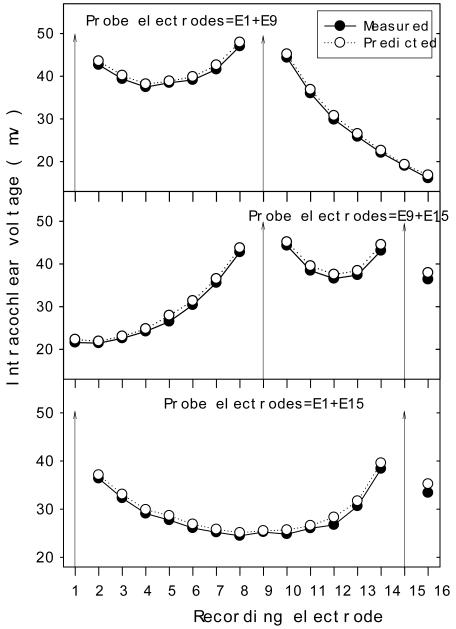
Fig. 5 shows measured (solid circle) and predicted (open circle) intracochlear potentials in response to 3 dual-electrode stimulation sites (E1 and E9 in top panel; E9 and E15 in middle panel; E1 and E15 in bottom panel) in subject S2. Predicted intracochlear potentials assumed a simple linear summation of the measured intracochlear potentials from single-electrode stimulation. Data from the other 4 subjects (not shown) were also highly consistent, with the overall root mean squared error being only 2.3% between the measured and predicted values across all subjects. This accurate prediction of the dual-electrode stimulation data from the single-electrode stimulation data, coupled with the highly consistent across-subjects data, indicates that channel interactions at the electrical level can be simply modeled as a linear function.
Figure 5.
Measured (solid circles) intracochlear potentials in response to dual-electrode simultaneous stimulation with the same amplitude and phase in S2. Predicted (open circles) data calculated from linear summation of the two single-electrode stimulation data.
3.2. Channel interactions at the neural level
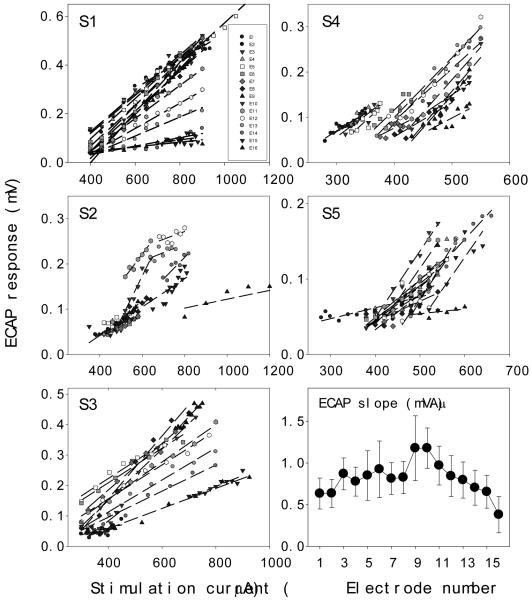
Fig. 6 shows the ECAP responses as a function of stimulation currents for all electrodes in the 5 individual subjects (all panels except for the bottom-right one). Dashed lines are linear fit to the individual electrode data (mean r2 = 0.81, se = 0.02, p<0.05). S1 and S3 have similar ECAP thresholds and dynamic ranges across all electrodes, but S2, S4, and S5 have different thresholds and dynamic ranges between electrodes, with the apical electrodes more likely having lower thresholds than the basal electrodes. These individual differences in dynamic range, particularly the different individual criterion to determine the MCL, introduce variability in both measures and their related analysis.
Figure 6.
ECAP growth functions for all electrodes (different symbols) in 5 subjects (individual panels labeled by S1-S5). Dashed lines are the best fit to the ECAP data. The bottom-right panel shows the mean ECAP slope (circles) and its standard error (error bars) as a function of masker electrode in the cochlea.
The bottom-right panel shows the average ECAP slope as a function of electrode position with the error bar representing the standard error of the mean. In contrast to the tight distribution in the individual EFI data (Fig. 4), much greater individual variability is apparent in the ECAP slope data. A pair wise post-hoc multiple comparison procedure reveals that the ECAP slope is significantly steeper at the middle electrode E9 than at the most basal electrode E16 (Tukey’s HSD criterion, F(1,8) = 7.88, p<0.05). The dependence of the ECAP slope on stimulation site has also observed in other cochlear implant devices and suggested to be proportional to local nerve density (e.g., Brill et al., 2009, Eisen and Franck, 2004b). The steepest ECAP slope at the middle electrode is likely a combined result of the ability of the middle electrode to recruit neurons from both sides of the cochlea and generally greater local nerve survival on the apical side than the basal side (e.g., Nadol, 1997).
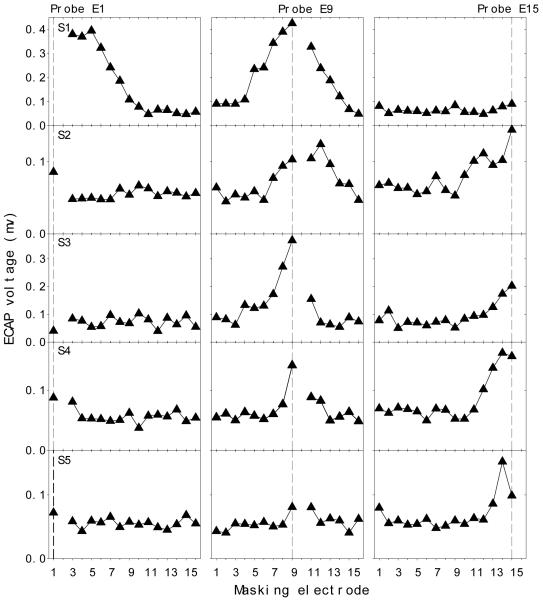
Fig. 7 shows individual ECAP spatial profiles (rows) as a function of the masking electrode (x-axis) with electrode E1, E9, or E15 being the stimulation site (the vertical dotted line in each panel). In contrast to the EFI profile, the ECAP data show great between-subjects as well as within-subjects variability. For instance, subject S1 shows higher masking on stimulation electrodes E1 and E9 but no masking on E15; subject S3 shows masking on E9 and E15 but no masking on E1; on the other hand, subject S5 only shows minimal masking on E15 but no masking on E1 and E9. This great inter- and intra-subject variability suggests that channel interactions at the neural level cannot be modeled as a simple linear function. Both the source and the implication of this great variability will be discussed later.
Figure 7.
Individual ECAP spatial profiles (5 rows labeled by S1-S5) as a function of masker electrode produced by stimulating E1 (left panels), E9 (middle panels) and E15 (right panels), respectively.
3.3. Channel interactions at the perceptual level
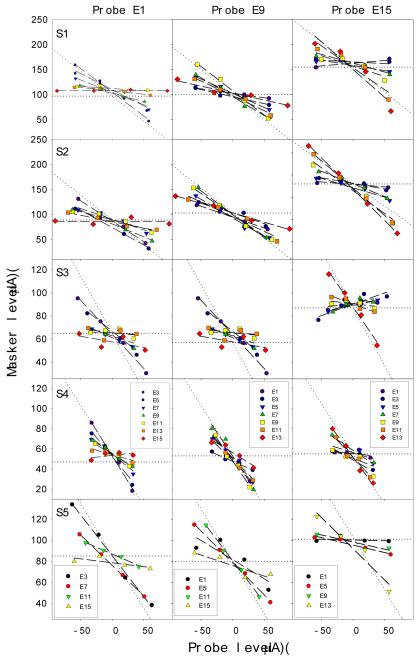
Fig. 8 shows the individual (rows) channel interaction data at the behavioral threshold level on three probe electrode positions (columns). The masker level is plotted as a function of the probe level, with a positive value representing the in-phase condition and a negative value representing the out-of-phase condition. The horizontal dotted line represents no interaction, whereas the dashed line at −450 represents total interaction. The threshold channel interaction data can be adequately modeled by a linear function (dashed lines, mean R2=0.82, se=0.03, p<0.05). In general, the channel interaction index, namely the slope of the fitted linear function, decreases as the distance between the probe and the masker increases. For example, the most basal electrode E15 (diamonds) did not interact detection of the most apical probe electrode E1 (left columns) but totally interact with detection of itself as expected (right columns). The reverse pattern can be observed between the most apical probe and the most basal masker electrodes.
Figure 8.
Individual threshold channel interaction profiles (5 rows labeled by S1-S5) for three probe conditions: E1 (left panels), E9 (middle panels), and E15 (right panels). Different symbols represent different masker electrodes. Dashed lines are the best fit to the threshold channel interaction index [see Eq. (1) in the text for details].
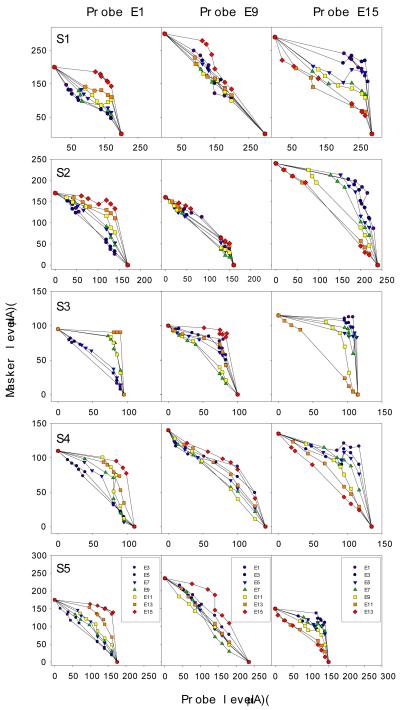
Fig. 9 shows the individual loudness summation data (rows) in response to simultaneous two-electrode stimulation at the three different probe electrode locations (columns). The masker level is plotted as a function of the probe level that reaches comfortable loudness, with different symbols representing different masker electrodes. Despite individual differences in absolute stimulation levels reaching comfortable loudness, all subjects produced consistent patterns of results: direct electric field summation accounts for nearby probe and masker electrodes (the −450 diagonal line), whereas loudness summation for distant probe and masker electrodes (the significantly curved line). The present loudness channel interaction model, Eq. (5), yielded excellent fit to the loudness summation data (mean R2=0.94, se=0.06, p<0.05).
Figure 9.
Individual loudness channel interaction profiles (5 rows labeled by S1-S5) for three probe conditions: E1 (left panels), E9 (middle panels), and E15 (right panels). Different symbols represent different masker electrodes.
3.4. Comparison of channel interactions at different levels
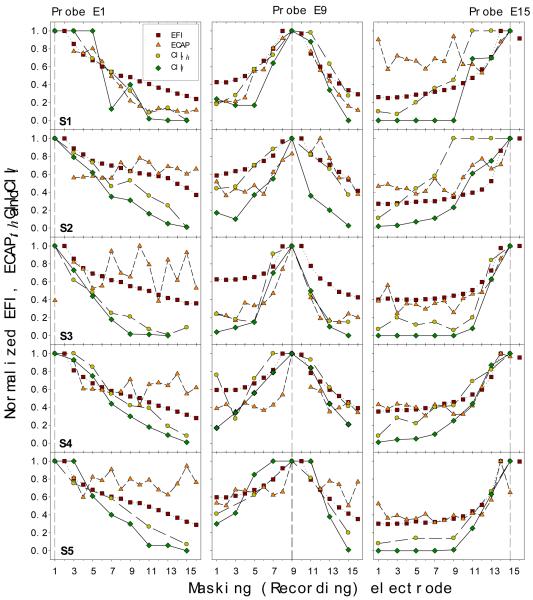
To compare between these different channel interaction measures, each measure was normalized dividing by its corresponding largest value. Fig. 10 shows the normalized spatial profiles of the EFI (squares), ECAP (triangles), behavioral detection threshold (circles), and loudness data (diamonds). Rows represent different subjects and columns represent the probe electrode. There is an expected general trend in this highly variable result: The closer the probe is to the masker, the greater the interactions observed at all levels. In addition, the data can be roughly classified into the following three patterns. First, six of the fifteen cases show a consistent correlated pattern between all four measures (E9 in S1, E9 in S2, E15 in S3, E9 and E15 in S4, and E9 in S5). Second, five cases shows diverse patterns for four measures (E15 in S1, E1 in S2, S3, S4, and S5). Third, four cases show the same pattern between some of the four measures (CIth, CIl and ECAP on E1 in S1 and E9 in S3, EFI and ECAP on E15 in S2 and E15 in S5). In the next section, we define two global indices to quantify a spatial profile and to compare between two spatial profiles.
Figure 10.
Normalized spatial profiles for EFI (squares), ECAP (triangles), threshold (circles), and loudness (diamonds) channel interaction measures. Individual data are presented in rows, whereas the probe electrodes are presented in columns.
3.4.1. Half-Width of the spatial profiles
A two-parameter rounded exponential (roex) function was used to fit the spatial profile for each measure:
| (8) |
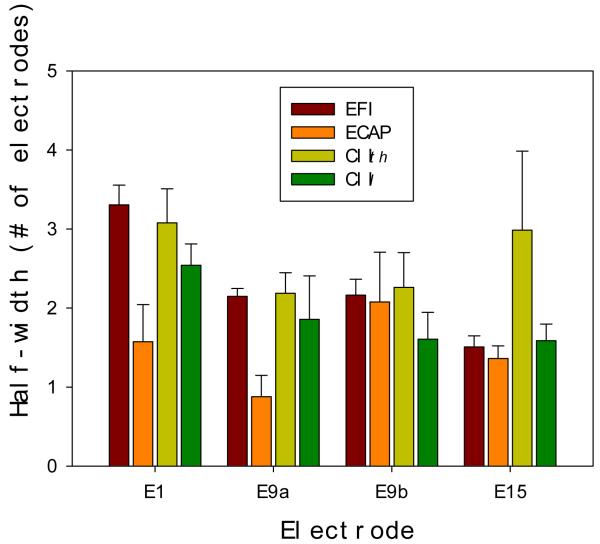
where xs corresponds to the probe electrode number (1, 9 or 15) and α and w correspond to the decay length and decay height of the profile, respectively (Patterson et al., 1982). The roex fit was applied to four different locations, including E1, E9a (apical side of E9), E9b (basal side of E9), and E15. The spatial profile half-width was defined as the distance in number of electrodes, at which the roex profile had a value of 0.8. Compared with other models such as a cubic or linear function, the roex fit yielded more consistent and interpretable results (r2 = 0.97 for EFI, r2 = 0.67 for ECAP, r2 = 0.85 for CIth, and r2 = 0.97 for CIl).
Fig. 11 shows mean and standard error of the half-width derived from the four measures at location E1, E9a (apical side), E9b (basal side), and E15. Several interesting observations can be made from these data. First, the EFI half-width decreases significantly from apex to base [mean =3.3 at E1, and 1.5 at E15; F(3,16)=20.9, p<0.05]. This decrease in the EFI half-width from apex to base is consistent with several previous psychophysical and physiological studies, which found larger electrode interactions at the apex than at the base (Favre and Pelizzone, 1993, Eisen and Franck, 2004a, Cohen et al., 2003, Abbas et al., 2004, Hughes and Abbas, 2006b, Chatterjee and Shannon, 1998, Stickney et al., 2006). On the other hand, no such systematic difference is apparent in the half-width for the other three measures. Second, the average ECAP half-width across electrodes (mean=1.47; se=0.49) is significantly narrower than the EFI width (mean=2.28; se=0.37; F(1,38)=9.71, p<0.01). This difference can be understood because not all electric fields would excite a neural response and, additionally, even if an electric field is strong enough, it may not elicit any neural response due to ganglion cell loss. Third, the EFI half-width data have the least variability (se/mean=0.08), the ECAP the most (0.26), and the most (0.26), and the CIth (0.19) and CIl (0.18) in the middle. The variability analysis suggests that behavioral channel interactions are likely dependent upon both the uniform intracochlear electric field distribution and the heterogeneous nerve survival pattern.
Figure 11.
Mean and standard error of the half-width for the EFI (Burgundy), ECAP (Orange), threshold (CIth, Yellowgreen), and loudness (CIl, Green) spatial profiles at different locations of the probe electrode (x-axis). See text for details.
3.4.2. Asymmetry of the spatial profiles
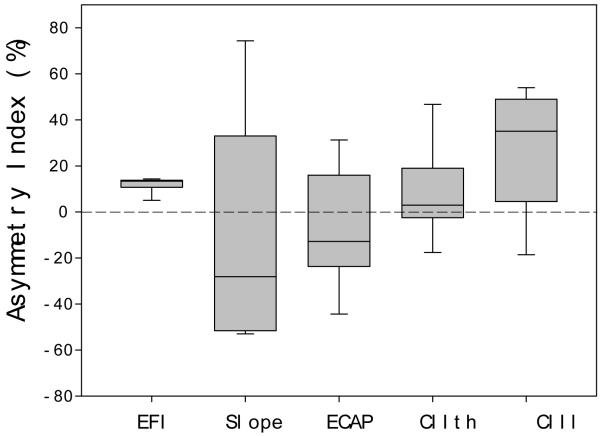
For a given spatial measure S, its Asymmetry Index (AI) can be defined as the percentage of the mean difference between corresponding apical (i=2 to 8) and basal (i=10 to 16) values divided by the mean value of the overall spatial profile:
| (9) |
where a positive AI corresponded to more spread on the apical side than on the basal side; a zero AI indicated perfect symmetry between the apical and basal sides in the spatial profile.
Fig. 12 shows a box plot of the asymmetry index for the 5 spatial profiles at the E9, including EFI, ECAP slope, ECAP, CIth and CIl. One consistent finding is that the EFI profile has a positive asymmetry index for all subjects (mean=11.42%; se=2.15%; t(4)=6.92, p<0.01), indicating greater spread of current towards the apex than the base. This asymmetry in the intracochlear voltage profile was noted in previous studies and thought to be a consequence of the low-resistance path of the current flow from the apex to the base (e.g., Jolly et al., 1996, Vanpoucke et al., 2004a, Vanpoucke et al., 2004b). The other consistent finding is that the two neural and the two behavioral measures, particularly the ECAP slope, have much greater variability than the electric measure. The lack of apparent dependence of the two behavioral measures on either the EFI or ECAP measure reinforces the suggestion from the half-width analysis that the behavioral measure is dependent upon both electric and neural properties.
Figure 12.
Box plot of the asymmetry index (AI) for the EFI, ECAP slope, ECAP, threshold (CIth) and loudness (CIl) spatial profile. The box represents the 25-75% range, the error bars represent the min-max range, while the line within the box represents the median. See text for details.
4. Discussion
4.1. Mechanisms of channel interaction
Channel interaction is subject to electric stimulus and its transformation from electrical potentials to neural responses and perceptual interpretation. The transformation from electric potentials to neural responses is primarily determined by an “all-or-none” threshold mechanism, followed by a facilitating or inhibitory process when the two electric stimuli are close to each other in time. Because the highest rate was 100 Hz, equivalent to a 10-ms interval between two adjacent pulses, the present result was unlikely affected by this temporal interaction of the electric-to-neural transformation. The transformation from neural firing to perceptual measures, such as threshold and loudness, is not clear but is certainly a non-linear mechanism. The effect of these transformations on threshold and loudness has been studied in electric hearing, assuming generally uniform nerve survival pattern (Bruce et al., 1999, Xu and Collins, 2005). If the neurons are uniformly distributed along the cochlea, then channel interactions are determined by the electric potential distribution and its transformations only. Thus, all channel interaction spatial profiles should be relatively similar to the electric field profile, including more masking on the apical side than the basal side. Subjects 3, 4 and 5 generally showed these predicted patterns (Fig. 10) and therefore had presumably a relatively uniform distribution of the survived neurons. On the contrary, in cases of poor electrode-neuron interface due to a dead region, or cochlear ossification, or simply the great distance between electrodes and neurons (e.g., Bierer et al., 2010, Moore, 2004), then these electrodes will function interactively because they will likely activate the same group of the closest neurons. For example, the saturated channel interaction index for apical electrodes from 1 to 5 in S1 and basal electrodes from 8 to 16 in S2 (Fig. 10) indicated either dead regions underneath these electrodes or great distance between the electrodes and the neurons. Unfortunately, both possibilities were consistent with the elevated evoked neural thresholds for these electrodes (Fig. 6). Alternative methods need to be explored to differentiate between dead region and distant stimulation in the future.
4.2. Relation to function
Channel interaction is frequently related to CI speech performance (e.g., Bierer, 2010). The present study produced no significant correlation between speech performance (Table 1) and any of the channel interaction measures. The largest, but still insignificant correlation was found between speech scores in quiet and threshold interaction (R2=0.29) and speech scores in quiet and ECAP slope (R2=0.23). One reason for a lack of correlation was the discrepancy in stimulation rate between the present measures (α100 Hz) and speech processors (>500 Hz). Another reason for this lack of correlation was the small sample size in the present study. To get meaningful correlation data, strategically simplified channel interaction measures need to be conducted over a large sample size. For example, loudness interaction would be correlated with detection of spectral peaks and vowel recognition (e.g., Henry and Turner, 2003).
4.3. Implications
It is worth noting that alternative approaches have been proposed to reduce the spatial channel interaction problem in electric stimulation. Instead of intra-cochlear electrode placement, the auditory nerve implant directly places a thin-film microelectrode array in the auditory nerve bundle, shortening the stimulation path and reducing channel interaction (Middlebrooks and Snyder, 2007). Similarly, a new version of the auditory brainstem implant uses bundled needle-like electrodes to penetrate the tissue and directly place the electrode next to the nerve (McCreery, 2008). To avoid the widespread problem of electric stimulation altogether, optical stimulation has been used to greatly reduce channel interaction because only those neural tissues that are in the direct path of the laser can be stimulated (Izzo et al., 2007). It is also worth noting that, except for auditory prostheses that require high rate stimulation, other neural prostheses use stimulation rate that rarely exceeds several hundred Hertz. Instead, spatial channel interaction is a particularly significant problem in these neural prostheses. For example, a retinal implant has to provide sufficient independent pixels to support meaningful visual function (e.g., Chader et al., 2009). A vestibular implant has to provide independent functional channels while limiting current spread to avoid undesirable auditory or other facial nerve stimulation (Fridman et al., 2010). Similarly, targeted electric stimulation is important for avoiding side effects while increasing efficacy in spinal cord stimulation, deep brain stimulation, and other neural modulation devices (e.g., Kuncel and Grill, 2004, Sankarasubramanian et al., 2011, Pikov et al., 2010). It is conceivable that the present approach characterizing spatial channel interactions at the physical, neural and behavioral levels can be generalized to all forms of physical energy from electric to magnetic or optical stimulation, as well as to most neural prostheses and modulation devices.
5. Conclusions
A functional channel carries independent information. The number of functional channels can be different from, generally less than the number of physical electrodes, depending on electric stimulation parameters and the interfacing neural tissue. The present study used low-rate (≤100 Hz) stimulation to focus on spatial channel interaction. Although spatial channel interactions have been measured at electric, neural and behavioral levels previously, the present study provided systematical measures from the same subjects, allowing direct comparison and identification of inter and intra-subject variability sources. By quantitatively comparing global as well as local spatial profiles across these different measures, the present study found that:
Electric potential distribution is broad but uniform within- and between-subjects. Channel interaction at the physical level can be modeled as a linear system in the present cochlear implant system.
On the contrary, neural survival patterns as reflected by evoked potentials vary significantly, producing highly variable neural interactions within- and between-subjects.
A novel model combining linear electric field summation and exponential loudness growth can capture channel interaction at a behaviorally relevant level. Behavioral channel interaction is determined by at least three factors including the electrical field distribution, the peripheral nerve survival pattern, and the central nonlinear transformation.
In the foreseeable future, electricity will likely remain the dominant means of stimulation in neural prostheses. As a result, channel interaction in electric stimulation remains a significant challenge. It is critical to understand the distribution of the electric field in a biological environment and the interaction between the electric field and the nerve tissue for these factors play a key role in determining the ultimate performance of neural prostheses.
Acknowledgements
We thank our cochlear implant subjects for their dedication and time. We thank Leo Litvak for assistance in the Advanced Bionics research interface and Tom Lu, Grace Hunter and two anonymous reviewers for comments. This project was supported in part by the National Institutes of Health, United States Department of Health and Human Services (RO1 DC008858, P30 DC008369, and UL1 RR031985) and Spanish Ministry of Science and Innovation MICINN through project (DPI2009-06999).
REFERENCES
- ABBAS PJ, BROWN CJ. Electrically evoked brainstem potentials in cochlear implant patients with multi-electrode stimulation. Hear Res. 1988;36:153–62. doi: 10.1016/0378-5955(88)90057-3. [DOI] [PubMed] [Google Scholar]
- ABBAS PJ, HUGHES ML, BROWN CJ, MILLER CA, SOUTH H. Channel interaction in cochlear implant users evaluated using the electrically evoked compound action potential. Audiol Neurootol. 2004;9:203–13. doi: 10.1159/000078390. [DOI] [PubMed] [Google Scholar]
- BERENSTEIN CK, MENS LH, MULDER JJ, VANPOUCKE FJ. Current steering and current focusing in cochlear implants: comparison of monopolar, tripolar, and virtual channel electrode configurations. Ear and Hearing. 2008;29:250–60. doi: 10.1097/aud.0b013e3181645336. [DOI] [PubMed] [Google Scholar]
- BIERER JA. Threshold and channel interaction in cochlear implant users: evaluation of the tripolar electrode configuration. J Acoust Soc Am. 2007;121:1642–53. doi: 10.1121/1.2436712. [DOI] [PubMed] [Google Scholar]
- BIERER JA. Probing the electrode-neuron interface with focused cochlear implant stimulation. Trends Amplif. 2010;14:84–95. doi: 10.1177/1084713810375249. [DOI] [PMC free article] [PubMed] [Google Scholar]
- BIERER JA, FAULKNER KF, TREMBLAY KL. Identifying Cochlear Implant Channels With Poor Electrode-Neuron Interfaces: Electrically Evoked Auditory Brain Stem Responses Measured With the Partial Tripolar Configuration. Ear and Hearing. 2010 doi: 10.1097/AUD.0b013e3181ff33ab. [DOI] [PMC free article] [PubMed] [Google Scholar]
- BONHAM BH, LITVAK LM. Current focusing and steering: Modeling, physiology, and psychophysics. Hear Res. 2008 doi: 10.1016/j.heares.2008.03.006. [DOI] [PMC free article] [PubMed] [Google Scholar]
- BRILL S, MULLER J, HAGEN R, MOLTNER A, BROCKMEIER SJ, STARK T, HELBIG S, MAURER J, ZAHNERT T, ZIERHOFER C, NOPP P, ANDERSON I, STRAHL S. Site of cochlear stimulation and its effect on electrically evoked compound action potentials using the MED-EL standard electrode array. Biomed Eng Online. 2009;8:40. doi: 10.1186/1475-925X-8-40. [DOI] [PMC free article] [PubMed] [Google Scholar]
- BROWN CJ, ABBAS PJ, BORLAND J, BERTSCHY MR. Electrically evoked whole nerve action potentials in Ineraid cochlear implant users: responses to different stimulating electrode configurations and comparison to psychophysical responses. J Speech Hear Res. 1996;39:453–67. doi: 10.1044/jshr.3903.453. [DOI] [PubMed] [Google Scholar]
- BROWN CJ, ABBAS PJ, GANTZ B. Electrically evoked whole-nerve action potentials: data from human cochlear implant users. J Acoust Soc Am. 1990;88:1385–91. doi: 10.1121/1.399716. [DOI] [PubMed] [Google Scholar]
- BRUCE IC, WHITE MW, IRLICHT LS, O’LEARY SJ, CLARK GM. The effects of stochastic neural activity in a model predicting intensity perception with cochlear implants: low-rate stimulation. IEEE Trans Biomed Eng. 1999;46:1393–404. doi: 10.1109/10.804567. [DOI] [PubMed] [Google Scholar]
- CHADER GJ, WEILAND J, HUMAYUN MS. Artificial vision: needs, functioning, and testing of a retinal electronic prosthesis. Progress in Brain Research. 2009;175:317–32. doi: 10.1016/S0079-6123(09)17522-2. [DOI] [PubMed] [Google Scholar]
- CHATTERJEE M, OBA SI. Across- and within-channel envelope interactions in cochlear implant listeners. J Assoc Res Otolaryngol. 2004;5:360–75. doi: 10.1007/s10162-004-4050-5. [DOI] [PMC free article] [PubMed] [Google Scholar]
- CHATTERJEE M, SHANNON RV. Forward masked excitation patterns in multielectrode electrical stimulation. J Acoust Soc Am. 1998;103:2565–72. doi: 10.1121/1.422777. [DOI] [PubMed] [Google Scholar]
- CHUA TE, BACHMAN M, ZENG FG. Intensity Coding in Electric Hearing: Effects of Electrode Configurations and Stimulation Waveforms. Ear and Hearing. 2011 doi: 10.1097/AUD.0b013e31821a47df. in press. [DOI] [PMC free article] [PubMed] [Google Scholar]
- COHEN LT, RICHARDSON LM, SAUNDERS E, COWAN RS. Spatial spread of neural excitation in cochlear implant recipients: comparison of improved ECAP method and psychophysical forward masking. Hear Res. 2003;179:72–87. doi: 10.1016/s0378-5955(03)00096-0. [DOI] [PubMed] [Google Scholar]
- COHEN LT, SAUNDERS E, RICHARDSON LM. Spatial spread of neural excitation: comparison of compound action potential and forward-masking data in cochlear implant recipients. Int J Audiol. 2004;43:346–55. doi: 10.1080/14992020400050044. [DOI] [PubMed] [Google Scholar]
- DE BALTHASAR C, BOEX C, COSENDAI G, VALENTINI G, SIGRIST A, PELIZZONE M. Channel interactions with high-rate biphasic electrical stimulation in cochlear implant subjects. Hear Res. 2003;182:77–87. doi: 10.1016/s0378-5955(03)00174-6. [DOI] [PubMed] [Google Scholar]
- DONALDSON GS, DAWSON PK, BORDEN LZ. Within-subjects comparison of the HiRes and Fidelity120 speech processing strategies: speech perception and its relation to place-pitch sensitivity. Ear and Hearing. 2011;32:238–50. doi: 10.1097/AUD.0b013e3181fb8390. [DOI] [PMC free article] [PubMed] [Google Scholar]
- EDDINGTON DK, DOBELLE WH, BRACKMANN DE, MLADEJOVSKY MG, PARKIN JL. Auditory prostheses research with multiple channel intracochlear stimulation in man. Ann Otol Rhinol Laryngol. 1978;87:1–39. [PubMed] [Google Scholar]
- EDDINGTON DK, DOBELLE WH, BRACKMANN DE, MLADEVOSKY MG, PARKIN JL. Auditory prosthesis research with multiple channel intracochlear stimulation in man. Ann. Otol. Rhinol. Laryngol. 1978;87:1–39. [PubMed] [Google Scholar]
- EISEN MD, FRANCK KH. Electrically evoked compound action potential amplitude growth functions and HiResolution programming levels in pediatric CII implant subjects. Ear Hear. 2004a;25:528–38. doi: 10.1097/00003446-200412000-00002. [DOI] [PubMed] [Google Scholar]
- EISEN MD, FRANCK KH. Electrically evoked compound action potential amplitude growth functions and HiResolution programming levels in pediatric CII implant subjects. Ear and Hearing. 2004b;25:528–38. doi: 10.1097/00003446-200412000-00002. [DOI] [PubMed] [Google Scholar]
- EISEN MD, FRANCK KH. Electrode interaction in pediatric cochlear implant subjects. J Assoc Res Otolaryngol. 2005;6:160–70. doi: 10.1007/s10162-005-5057-2. [DOI] [PMC free article] [PubMed] [Google Scholar]
- FAVRE E, PELIZZONE M. Channel interactions in patients using the Ineraid multichannel cochlear implant. Hear Res. 1993;66:150–6. doi: 10.1016/0378-5955(93)90136-o. [DOI] [PubMed] [Google Scholar]
- FRIDMAN GY, DAVIDOVICS NS, DAI C, MIGLIACCIO AA, DELLA SANTINA CC. Vestibulo-ocular reflex responses to a multichannel vestibular prosthesis incorporating a 3D coordinate transformation for correction of misalignment. J Assoc Res Otolaryngol. 2010;11:367–81. doi: 10.1007/s10162-010-0208-5. [DOI] [PMC free article] [PubMed] [Google Scholar]
- FRIJNS JH, DE SNOO SL, SCHOONHOVEN R. Potential distributions and neural excitation patterns in a rotationally symmetric model of the electrically stimulated cochlea. Hear Res. 1995;87:170–86. doi: 10.1016/0378-5955(95)00090-q. [DOI] [PubMed] [Google Scholar]
- GRILL WM, JR., MORTIMER JT. The effect of stimulus pulse duration on selectivity of neural stimulation. IEEE Trans Biomed Eng. 1996;43:161–6. doi: 10.1109/10.481985. [DOI] [PubMed] [Google Scholar]
- HENRY BA, TURNER CW. The resolution of complex spectral patterns by cochlear implant and normal-hearing listeners. J Acoust Soc Am. 2003;113:2861–73. doi: 10.1121/1.1561900. [DOI] [PubMed] [Google Scholar]
- HUGHES ML, ABBAS PJ. Electrophysiologic channel interaction, electrode pitch ranking, and behavioral threshold in straight versus perimodiolar cochlear implant electrode arrays. J Acoust Soc Am. 2006a;119:1538–47. doi: 10.1121/1.2164969. [DOI] [PubMed] [Google Scholar]
- HUGHES ML, ABBAS PJ. The relation between electrophysiologic channel interaction and electrode pitch ranking in cochlear implant recipients. J Acoust Soc Am. 2006b;119:1527–37. doi: 10.1121/1.2163273. [DOI] [PubMed] [Google Scholar]
- IZZO AD, WALSH JT, JR., JANSEN ED, BENDETT M, WEBB J, RALPH H, RICHTER CP. Optical parameter variability in laser nerve stimulation: a study of pulse duration, repetition rate, and wavelength. IEEE Trans Biomed Eng. 2007;54:1108–14. doi: 10.1109/TBME.2007.892925. [DOI] [PMC free article] [PubMed] [Google Scholar]
- JOLLY CN, SPELMAN FA, CLOPTON BM. Quadrupolar stimulation for Cochlear prostheses: modeling and experimental data. IEEE Trans Biomed Eng. 1996;43:857–65. doi: 10.1109/10.508549. [DOI] [PubMed] [Google Scholar]
- KLOP WM, HARTLOOPER A, BRIARE JJ, FRIJNS JH. A new method for dealing with the stimulus artefact in electrically evoked compound action potential measurements. Acta Otolaryngol. 2004;124:137–43. doi: 10.1080/00016480310016901. [DOI] [PubMed] [Google Scholar]
- KUNCEL AM, GRILL WM. Selection of stimulus parameters for deep brain stimulation. Clinical Neurophysiology. 2004;115:2431–41. doi: 10.1016/j.clinph.2004.05.031. [DOI] [PubMed] [Google Scholar]
- LEVITT H. Transformed up-down methods in psychoacoustics. J. Acoust. Soc. Am. 1971;49:467–477. [PubMed] [Google Scholar]
- MCCREERY DB. Cochlear nucleus auditory prostheses. Hear Res. 2008;242:64–73. doi: 10.1016/j.heares.2007.11.014. [DOI] [PubMed] [Google Scholar]
- MCKAY CM, MCDERMOTT HJ, CLARK GM. Loudness summation for two channels of stimulation in cochlear implants: effects of spatial and temporal separation. Ann Otol Rhinol Laryngol Suppl. 1995;166:230–3. [PubMed] [Google Scholar]
- MIDDLEBROOKS JC, SNYDER RL. Auditory prosthesis with a penetrating nerve array. J Assoc Res Otolaryngol. 2007;8:258–79. doi: 10.1007/s10162-007-0070-2. [DOI] [PMC free article] [PubMed] [Google Scholar]
- MOORE BC. Dead regions in the cochlea: conceptual foundations, diagnosis, and clinical applications. Ear and Hearing. 2004;25:98–116. doi: 10.1097/01.aud.0000120359.49711.d7. [DOI] [PubMed] [Google Scholar]
- NADOL JB., JR. Patterns of neural degeneration in the human cochlea and auditory nerve: implications for cochlear implantation. Otolaryngol Head Neck Surg. 1997;117:220–8. doi: 10.1016/s0194-5998(97)70178-5. [DOI] [PubMed] [Google Scholar]
- NELSON DA, DONALDSON GS. Psychophysical recovery from single-pulse forward masking in electric hearing. J Acoust Soc Am. 2001;109:2921–33. doi: 10.1121/1.1371762. [DOI] [PubMed] [Google Scholar]
- PATTERSON RD, NIMMO-SMITH I, WEBER DL, MILROY R. The deterioration of hearing with age: frequency selectivity, the critical ratio, the audiogram, and speech threshold. J Acoust Soc Am. 1982;72:1788–803. doi: 10.1121/1.388652. [DOI] [PubMed] [Google Scholar]
- PECKHAM PH, KNUTSON JS. Functional electrical stimulation for neuromuscular applications. Annu Rev Biomed Eng. 2005;7:327–60. doi: 10.1146/annurev.bioeng.6.040803.140103. [DOI] [PubMed] [Google Scholar]
- PESARAN B, MUSALLAM S, ANDERSEN RA. Cognitive neural prosthetics. Curr Biol. 2006;16:R77–80. doi: 10.1016/j.cub.2006.01.043. [DOI] [PubMed] [Google Scholar]
- PIKOV V, ARAKAKI X, HARRINGTON M, FRASER SE, SIEGEL PH. Modulation of neuronal activity and plasma membrane properties with low-power millimeter waves in organotypic cortical slices. J Neural Eng. 2010;7:045003. doi: 10.1088/1741-2560/7/4/045003. [DOI] [PubMed] [Google Scholar]
- RANCK JB., JR. Which elements are excited in electrical stimulation of mammalian central nervous system: a review. Brain Res. 1975;98:417–40. doi: 10.1016/0006-8993(75)90364-9. [DOI] [PubMed] [Google Scholar]
- RATTAY F, LUTTER P, FELIX H. A model of the electrically excited human cochlear neuron. I. Contribution of neural substructures to the generation and propagation of spikes. Hear Res. 2001;153:43–63. doi: 10.1016/s0378-5955(00)00256-2. [DOI] [PubMed] [Google Scholar]
- RUBINSTEIN JT. An introduction to the biophysics of the electrically evoked compound action potential. Int J Audiol. 2004;43(Suppl 1):S3–9. [PubMed] [Google Scholar]
- RUTTEN WL. Selective electrical interfaces with the nervous system. Annu Rev Biomed Eng. 2002;4:407–52. doi: 10.1146/annurev.bioeng.4.020702.153427. [DOI] [PubMed] [Google Scholar]
- SANKARASUBRAMANIAN V, BUITENWEG JR, HOLSHEIMER J, VELTINK P. Electrode alignment of transverse tripoles using a percutaneous triple-lead approach in spinal cord stimulation. J Neural Eng. 2011;8:016010. doi: 10.1088/1741-2560/8/1/016010. [DOI] [PubMed] [Google Scholar]
- SHANNON RV. Multichannel electrical stimulation of the auditory nerve in man. II. Channel interaction. Hear Res. 1983;12:1–16. doi: 10.1016/0378-5955(83)90115-6. [DOI] [PubMed] [Google Scholar]
- SHANNON RV. Threshold and loudness functions for pulsatile stimulation of cochlear implants. Hear Res. 1985;18:135–43. doi: 10.1016/0378-5955(85)90005-x. [DOI] [PubMed] [Google Scholar]
- SHANNON RV, FU QJ, GALVIN J., 3RD The number of spectral channels required for speech recognition depends on the difficulty of the listening situation. Acta Otolaryngol Suppl. 2004:50–4. doi: 10.1080/03655230410017562. [DOI] [PubMed] [Google Scholar]
- SKINNER MW, HOLDEN LK, WHITFORD LA, PLANT KL, PSARROS C, HOLDEN TA. Speech recognition with the nucleus 24 SPEAK, ACE, and CIS speech coding strategies in newly implanted adults. Ear Hear. 2002;23:207–23. doi: 10.1097/00003446-200206000-00005. [DOI] [PubMed] [Google Scholar]
- SMITH ZM, DELGUTTE B, OXENHAM AJ. Chimaeric sounds reveal dichotomies in auditory perception. Nature. 2002;416:87–90. doi: 10.1038/416087a. [DOI] [PMC free article] [PubMed] [Google Scholar]
- SRINIVASAN AG, LANDSBERGER DM, SHANNON RV. Current focusing sharpens local peaks of excitation in cochlear implant stimulation. Hearing Research. 2010;270:89–100. doi: 10.1016/j.heares.2010.09.004. [DOI] [PMC free article] [PubMed] [Google Scholar]
- STICKNEY GS, LOIZOU PC, MISHRA LN, ASSMANN PF, SHANNON RV, OPIE JM. Effects of electrode design and configuration on channel interactions. Hearing Research. 2006;211:33–45. doi: 10.1016/j.heares.2005.08.008. [DOI] [PubMed] [Google Scholar]
- TYKOCINSKI M, SAUNDERS E, COHEN LT, TREABA C, BRIGGS RJ, GIBSON P, CLARK GM, COWAN RS. The contour electrode array: safety study and initial patient trials of a new perimodiolar design. Otol Neurotol. 2001;22:33–41. doi: 10.1097/00129492-200101000-00007. [DOI] [PubMed] [Google Scholar]
- VAN DEN HONERT C, STYPULKOWSKI PH. Physiological properties of the electrically stimulated auditory nerve. II. Single fiber recordings. Hear Res. 1984;14:225–43. doi: 10.1016/0378-5955(84)90052-2. [DOI] [PubMed] [Google Scholar]
- VAN WIERINGEN A, CARLYON RP, LANEAU J, WOUTERS J. Effects of waveform shape on human sensitivity to electrical stimulation of the inner ear. Hear Res. 2005;200:73–86. doi: 10.1016/j.heares.2004.08.006. [DOI] [PubMed] [Google Scholar]
- VANPOUCKE F, ZAROWSKI A, CASSELMAN J, FRIJNS J, PEETERS S. The facial nerve canal: an important cochlear conduction path revealed by Clarion electrical field imaging. Otol Neurotol. 2004a;25:282–9. doi: 10.1097/00129492-200405000-00014. [DOI] [PubMed] [Google Scholar]
- VANPOUCKE FJ, ZAROWSKI AJ, PEETERS SA. Identification of the impedance model of an implanted cochlear prosthesis from intracochlear potential measurements. IEEE Trans Biomed Eng. 2004b;51:2174–83. doi: 10.1109/TBME.2004.836518. [DOI] [PubMed] [Google Scholar]
- WILSON BS, FINLEY CC, LAWSON DT, WOLFORD RD, EDDINGTON DK, RABINOWITZ WM. Better speech recognition with cochlear implants. Nature. 1991;352:236–8. doi: 10.1038/352236a0. [DOI] [PubMed] [Google Scholar]
- WILSON BS, LAWSON DT, MULLER JM, TYLER RS, KIEFER J. Cochlear implants: Some likely next steps. Annu Rev Biomed Eng. 2003;5:207–249. doi: 10.1146/annurev.bioeng.5.040202.121645. [DOI] [PubMed] [Google Scholar]
- XU Y, COLLINS LM. Predicting dynamic range and intensity discrimination for electrical pulse-train stimuli using a stochastic auditory nerve model: the effects of stimulus noise. IEEE Trans Biomed Eng. 2005;52:1040–9. doi: 10.1109/TBME.2005.846718. [DOI] [PubMed] [Google Scholar]
- ZENG FG. Trends in cochlear implants. Trends Amplif. 2004;8:1–34. doi: 10.1177/108471380400800102. [DOI] [PMC free article] [PubMed] [Google Scholar]
- ZENG FG, GALVIN JJ, 3RD, ZHANG C. Encoding loudness by electric stimulation of the auditory nerve. Neuroreport. 1998;9:1845–8. doi: 10.1097/00001756-199806010-00033. [DOI] [PubMed] [Google Scholar]
- ZENG FG, REBSCHER S, HARRISON W, SUN X, FENG HH. Cochlear Implants: System Design, Integration and Evaluation. IEEE Reviews in Biomedical Engineering. 2008;1:115–142. doi: 10.1109/RBME.2008.2008250. [DOI] [PMC free article] [PubMed] [Google Scholar]
- ZENG FG, SHANNON RV. Loudness-coding mechanisms inferred from electric stimulation of the human auditory system. Science. 1994;264:564–6. doi: 10.1126/science.8160013. [DOI] [PubMed] [Google Scholar]


