

Abstract
The Na,K-ATPase belongs to the P-type ATPase family of primary active cation pumps. Metal fluorides like magnesium-, beryllium-, and aluminum fluoride act as phosphate analogues and inhibit P-type ATPases by interacting with the phosphorylation site, stabilizing conformations that are analogous to specific phosphoenzyme intermediates. Cardiotonic steroids like ouabain used in the treatment of congestive heart failure and arrhythmias specifically inhibit the Na,K-ATPase, and the detailed structure of the highly conserved binding site has recently been described by the crystal structure of the shark Na,K-ATPase in a state analogous to E2·2K+·Pi with ouabain bound with apparently low affinity (1). In the present work inhibition, and subsequent reactivation by high Na+, after treatment of shark Na,K-ATPase with various metal fluorides are characterized. Half-maximal inhibition of Na,K-ATPase activity by metal fluorides is in the micromolar range. The binding of cardiotonic steroids to the metal fluoride-stabilized enzyme forms was investigated using the fluorescent ouabain derivative 9-anthroyl ouabain and compared with binding to phosphorylated enzyme. The fastest binding was to the Be-fluoride stabilized enzyme suggesting a preformed ouabain binding cavity, in accord with results for Ca-ATPase where Be-fluoride stabilizes the E2-P ground state with an open luminal ion access pathway, which in Na,K-ATPase could be a passage for ouabain. The Be-fluoride stabilized enzyme conformation closely resembles the E2-P ground state according to proteinase K cleavage. Ouabain, but not its aglycone ouabagenin, prevented reactivation of this metal fluoride form by high Na+ demonstrating the pivotal role of the sugar moiety in closing the extracellular cation pathway.
Keywords: ATPases; Na,K-ATPase; Protein Conformation; Protein Metal Ion Interaction; Protein Phosphorylation; Na,K-ATPase; Na,K-ATPase Phosphoenzyme; Cardiotonic Steroids; Metal Fluorides; Ouabain
Introduction
The Na,K-ATPase is indispensable in maintaining cellular homeostasis in animals. This integral membrane protein is an ion pump fueled by ATP and responsible for maintaining electrochemical gradients for Na+ and K+ across animal cell membranes, which is essential for many physiological processes like secondary active co- and counter-transport, volume regulation, and forms the basis for generating the resting membrane potential.
In sarco(endo)plasmic Ca2+-ATPase from skeletal muscle (SERCA1a),2 another representative member of P-type ATPases, metal fluorides are potent inhibitors of ATPase activity, binding to the enzyme phosphorylation site (D351) as analogues of phosphate (2–5).
In Ca-ATPase various structural analogues of enzyme phosphoforms (EP) have been stabilized and structurally characterized using fluoride analogues of phosphate. Thus, complexes of magnesium, aluminum, and beryllium with fluoride (MgFx, AlFx, and BeFx) stabilize analogues of the E2·P product state (E2·MgF42−), the E2∼P transition state (E2·AlF4−), and the E2-P ground state (E2·BeF3−), respectively (reviewed in Ref. 6). Inclusion of ADP together with AlFx stabilizes an E1∼P·ADP form (7, 8). In Na,K-ATPase similar effects of various fluoride analogues are found (9, 10), but are less well characterized. Recently, Na,K-ATPase from pig kidney and shark rectal glands with 2 K+-ions, or Rb+-ions, in the cation binding site, and MgF42− in the phosphorylation site has been crystallized (11, 12), which is presumed to represent the E2·2K+·Pi state.
Cardiotonic steroids (CTSs) like ouabain are specific inhibitors of the Na,K-ATPase (13). This is the basis for the therapeutic action of CTSs like digoxin and digitoxin in treatment of congestive heart failure and arrhythmia (14). Inhibition of myocardial Na,K-ATPase leads to elevated intracellular Na+-concentration, which suppresses NCX, the 3Na+-Ca2+ exchanger, thus increasing intracellular Ca2+ and producing an increase in the contractility of the heart and cardiac output (the inotropic effect). Ouabain binds to the extracellular side of the Na,K-ATPase and mainly to a phosphorylated intermediate (15); however, it is still not known to which intermediate ouabain principally binds during enzyme turnover. The ouabain binding site was recently determined for the shark enzyme in an apparent low affinity E2·2K+·Pi form (1). A low-resolution (∼5 Å) crystal structure of kidney Na,K-ATPase in the E2P state indicates that ouabain is bound in a similar position, but likely with high affinity (16).
In the present study interactions of various metal fluorides (MeF), acting as phosphate analogues, with shark Na,K-ATPase are investigated and the binding of ouabain and its aglycone ouabagenin to various fluoride analogues of EP-intermediates of Na,K-ATPase is characterized to elucidate structural constraints for binding of CTS to various EP phosphoforms, especially regarding the importance of the sugar moiety of CTS.
EXPERIMENTAL PROCEDURES
Materials
The cardiotonic steroids ouabain and ouabagenin (OG), MgCl2, BeSO4, AlCl3, and NaF were from Sigma. 9-Anthroyl ouabain (AO) was from Invitrogen (Carlsbad, CA).
Preparation of Shark Na,K-ATPase
Crude membrane fractions (microsomes) from the rectal gland of the shark Squalus acanthias were prepared by homogenization followed by washing and isolation by centrifugation in 30 mm histidine, 1 mm EDTA, 0.25 m sucrose, pH 6.8.
The purified microsomes were activated by a mild DOC treatment (∼0.15% DOC) to extract extrinsic proteins and to open sealed vesicles. After washing and resuspension the purified membrane preparation was obtained by differential centrifugation essential as previously described (17). The preparation was suspended in histidine/EDTA buffer with 25% glycerol and kept at −20 °C. The preparation had a specific hydrolytic activity of ∼30 units/mg at 37 °C and contained the α1-, β1-subunits together with the FXYD10 regulatory subunit (18). Protein concentrations, ranging from 3–5 mg/ml, were determined using Peterson's modification (19) of the Lowry method (20), using bovine serum albumin as a standard.
Na,K-ATPase Activity
The specific enzyme activity was measured using either the Fiske and SubbaRow method (21) with Amidol as the reducing agent, or the more sensitive method of Baginsky et al. (22). The activity was measured at 23 °C in a test medium containing 130 mm NaCl, 20 mm KCl, 4 mm MgCl2, 3 mm Tris-ATP, and 0.33 mg/ml bovine serum albumin. Histidine or imidazole (30 mm) was used as buffer, depending on pH.
Inhibition of Na,K-ATPase by Fluorides and Cardiotonic Steroids
The inhibition of Na,K-ATPase activity by MgFx by equilibrium binding was characterized by mixing 5 mm MgCl2 and increasing concentrations of NaF (1–100 mm) in imidazole 30 mm pH 6.5, 7.5, or 8.5 followed by addition of Na,K-ATPase and preincubation for 10 min. at 23 °C. The inhibition by BeFx and AlFx was performed by mixing 5 mm NaF and increasing concentrations of BeSO4 or AlCl3 (1–200 μm) followed by preincubation with the enzyme, as described above. The reaction with AlFx·ADP was produced by including 1 mm ADP in the AlFx reaction media. Following preincubation, the Na,K- ATPase activity at 23 °C was determined at optimal turnover conditions, i.e. in 130 mm Na+, 20 mm K+, 4 mm Mg2+, 3 mm ATP, and 30 mm imidazole (pH 7.5).
The time course of inhibition at various concentrations of fluorides was determined by varying the time of preincubation with fluorides (15–180 s) as described above, followed by addition of the enzyme activity test medium. After 1 min, the reaction was stopped by 50% TCA and liberated Pi was determined.
The rate of inhibition induced by binding of CTS to non-phosphorylated or MgPi-phosphorylated Na,K-ATPase was determined by preincubation of enzyme in 30 mm imidazole (pH 7.5) with either 5 mm Mg2+, or 5 mm Mg2+ + 1 mm Pi with 1 μm ouabain, ouabagenin, or anthroyl ouabain for varying time periods followed by measurement of hydrolytic activity.
Reactivation of Na,K-ATPase after Fluoride Treatment
The enzyme was first reacted with metal fluoride complexes by incubating in 5 mm NaF (or KF), 30 mm imidazole pH 7.5 and either 5 mm MgCl2, 5 μm BeSO4, 200 μm AlCl3, or 200 μm AlCl3 plus 1 mm ADP for 10 min. at 23 °C to obtain maximum inhibition. Then 150 mm NaCl was added to the enzyme and the hydrolytic activity measured at different time intervals (0–60 min). The reactivation of metal fluoride-treated enzyme reacted with ouabain or ouabagenin was tested by including the CTS in the metal fluoride reaction medium for 50 min after the initial 10 min preincubation with metal fluoride followed by addition of 150 mm NaCl and measurement of hydrolytic activity.
Fluorescence Measurements
Fluorescence associated with 9-anthroyl ouabain (AO) binding to the Na,K-ATPase was measured using a Spex Fluorolog-3 spectrofluorometer (Horiba Jobin Yvon). Excitation wavelength was set at 370 nm using a band-pass of 5 nm, and the emission wavelength was 480 nm with band-pass 10 nm. The sample was placed in a thermostated cuvette (20 °C) with magnetic stirring and contained 30 mm Tris-buffer pH 7.0, 4 mm MgCl2, and 1 μm anthroyl ouabain. Before fluorescence measurements the enzyme was incubated with 4 mm MgCl2, 4 mm Pi to produce the E2P-state, or with different metal fluorides as indicated above to produce the enzyme complexes E·MgFx, E·BeFx, E·AlFx, and E·AlFx·ADP. Enzyme was incubated for 3 min at 20 °C followed by incubation on ice for 1 h before measurements. To measure AO fluorescence ∼60 μg of the incubated enzyme was added to the cuvette in a final volume of 2 ml with 1 μm AO. Baseline fluorescence was measured with enzyme preincubated with 1 mm ouabain.
Proteinase K Cleavage of Fluoride-stabilized Na,K-ATPase
Controlled proteolysis of the shark rectal gland α-subunit was performed in a reaction mixture containing 100 μg of protein suspended in 25 mm histidine pH 7.0, and the following ligands to stabilize the enzyme in specific conformations: 4 mm NaF and 4 mm MgCl2 (E·MgFx), 4 mm NaF, and 50 μl BeSO4 (E·BeFx), 4 mm NaF, and 100 μm AlCl3 (E·AlFx), or 4 mm NaF and 100 μm AlCl3 plus 1 mm ADP (E·AlFx·ADP). The reaction was initiated by the addition of 2 μg of proteinase K for 40 min at 20 °C and terminated with SDS sample buffer containing 1% trichloroacetic acid to irreversibly inhibit the protease. 40 μg of protein was loaded onto 8% SDS-PAGE, and the gel was stained with Coomassie Blue. Identification of cleavage products was performed by Edman degradation analysis (Alphalyse, Odense, DK).
Statistics and Curve Fitting
Results are expressed as mean ± S.E. Inhibition by fluorides was evaluated by fitting to a sigmoid dose-response equation (Hill Equation 1) using the GraphPad program Prism 5,
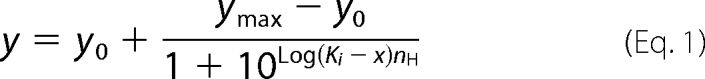 |
where y0 and ymax are baseline and maximum activity and x is the concentration of inhibitor. Ki is the inhibitor concentration that gives 50% inhibition and nH is the Hill coefficient. The time course of fluoride inhibition or AO fluorescence was fitted with one phase exponential Equation 2,
where kobs is the observed rate constant and y0 and y∞ are the initial and final values. The relative intensity of inhibition or fluorescence is then Equation 3.
 |
Comparison between best-fit values was performed using an F test and p < 0.05 was considered significant. Structural figures were prepared using PyMol.
RESULTS
Inhibition of Na,K-ATPase Activity by Metal Fluorides at Different pH Values
Inhibition of Na,K-ATPase activity by increasing concentration of NaF at a constant MgCl2 concentration of 5 mm is demonstrated in Fig. 1 at pH 6.5, 7.5, and 8.5. The data were fitted with a Hill equation and showed an increase in the NaF inhibitor constant (Ki) as the pH is increased. Thus Ki increased from 1.1 mm to 6.4 mm when pH increased from 6.5 to 8.5. The Hill coefficient (shared at the different pH values) was −2.2 and significantly different from −1. As the Hill coefficient is empirical and provides only lower limits on the binding stoichiometry, this is in accordance with 4 fluorine atoms present in the stable complex MgF42− in the recent crystal structure of shark Na,K-ATPase (12). There was no systematic variation in the Hill coefficient with pH indicating that the coordination number for fluoride did not change within this pH range, as indicated in other nucleotide-binding proteins (23).
FIGURE 1.

Inhibition of Na,K-ATPase activity at different pH values by NaF at a constant MgCl2 concentration of 5 mm. The curves are fits using the Hill equation with a shared Hill coefficient nH = - 2.21 ± 0.07 and inhibitor constants, Ki = 1.2 ± 0.1 mm (pH 6.5), 1.6 ± 0.1 mm (pH 7.5), and 6.3 ± 0.1 mm (pH 8.5).
Equilibrium binding of MgFx, BeFx, AlFx, and AlFx·ADP to Na,K-ATPase was evaluated by measuring the inhibition of specific ATPase activity after preincubation for 10 min at 23 °C in solutions containing 5 mm NaF and increasing concentrations of MgCl2, BeSO4, AlCl3, or AlCl3 + 1 mm ADP. Fig. 2 shows inhibition by MgCl2 (panel A), BeSO4 (panel B), AlCl3 (panel C), or AlCl3 + ADP (panel D), all at 5 mm NaF and pH 7.5. The data were fitted with a Hill equation and the inhibitor dissociation constant and Hill coefficient evaluated. The Hill coefficient was significantly different from −1 at all conditions indicating inhibition by binding of more than one metal ion in the phosphorylation domain. In the case of MgCl2 this is in accordance with the binding of two Mg2+ ions in the phosphorylation domain, one with MgF42− near D376 and one at the Mg2+ subsite near D717 in shark, Fig. 3 (12). From the present data it seems likely that also beryllium and aluminum will bind to the Mg2+ subsite in the absence of Mg2+. Beryllium and aluminum have not previously been identified in the P-domain (D703) of SERCA crystal structures (see Ref. 8), and identification by crystallography will probably be difficult due to lack of strong anomalous signals from these metals. The inhibitor constants measured at pH 6.5, 7.5, and 8.5 are given in Table 1. As indicated the inhibitor affinity increased with decreasing pH and the inhibitor affinity was highest for BeFx followed by AlFx, AlFx·ADP, and MgFx. This order did not change with pH. The inhibition by AlFx·ADP was much less pH-sensitive, as seen from Table 1. No systematic variation in the fitted Hill coefficients was present at the different pH values, and the Hill coefficient was therefore shared in the fitting procedure to data at the various pH values.
FIGURE 2.

Inhibition of Na,K-ATPase activity by various fluoride complexes at pH 7.5. The NaF concentration is 5 mm in all experiments. The data were fitted by a Hill equation shown as the solid curve. The Hill coefficients were significantly different from −1 in all cases. A, inhibition by MgFx. The fit parameters were: Ki = 133 ± 3 μm, nH = −1.63 ± 0.07. B, inhibition by BeFx. The inhibitor constant Ki = 2.42 ± 0.02 μm, nH = −1.44 ± 0.08. C, inhibition by AlFx. The inhibitor constant Ki = 10.9 ± 0.2 μm, nH = −3.2 ± 0.2. D, inhibition by AlFx in the presence of 1 mm ADP. The inhibitor constant Ki = 20.9 ± 0.3 μm, nH = −1.59 ± 0.07.
FIGURE 3.

Coordination of MgF42−, a Pi analog, and of a Mg2+ ion at the phosphorylation site in the crystal structure of Na,K-ATPase from shark rectal gland in a state representing E2·2K+·Pi. In this state the Pi analog MgF42− is coordinated by residues in the phosphorylation (P) domain, including the phosphorylated residue D376. A divalent metal ion, in this case Mg2+ is located between D376 and another critical residue D717. Orange dotted lines represent coordination of ligands, and green dotted lines show hydrogen bonds likely to be important in stabilizing coordinating residues. Small red spheres represent water molecule. Coordinates of the atomic model are derived from PDB entry 2ZXE.
TABLE 1.
Inhibitor constant (Ki/μm) for various metal fluorides at different pH values
|
Ki/μm |
nH (shared)a | |||
|---|---|---|---|---|
| pH 6.5 | pH 7.5 | pH 8.5 | ||
| MgCl2 | 39.7 ± 0.7 | 133 ± 3 | 708 ± 67 | −1.63 ± 0.07 |
| BeSO4 | 2.6 ± 0.2 | 2.5 ± 0.3 | 5.2 ± 0.2 | −1.41 ± 0.09 |
| AlCl3 | 8.5 ± 0.3 | 12.5 ± 0.2 | 26.4 ± 0.2 | −2.05 ± 0.15 |
| AlCl3·ADP | 39.5 ± 0.2 | 32.4 ± 0.3 | 42.6 ± 0.7 | −1.33 ± 0.11 |
a The value of the Hill coefficient in the fitting is shared between experiments performed at the three pH values. In all cases, the nH value was found to be significantly different from −1.0.
Time Course of Inhibition by Metal Fluoride Complexes
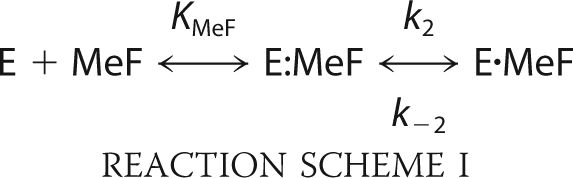
In Fig. 4A the time course of Na,K-ATPase inhibition induced by adding enzyme to a premix of 5 mm MgCl2 and increasing concentrations of NaF (1–100 mm) at pH 7.5 is illustrated. The data could be satisfactorily fitted with a mono-exponential relation with an observed rate constants, kobs. In Fig. 4B the kobs is plotted against the concentration of NaF. The relation is steeply sigmoid and the data are compatible with a Hill equation where the K0.5 is 42 mm when nH is set to 4, in accordance with 4 fluorine atoms in the metal fluoride complex, MgF42−, that binds to the phosphorylation site (12 c.f. Fig. 3). At pH 7.5 the observed rate constant at saturating NaF (75 mm) was 0.13 s−1 comparable to an apparent second order rate constant of kapp = 1.7 s−1 m−1. These rather small values indicated that a slow isomerization step follows the initial collision interaction between the Mg2+-bound Na,K-ATPase (denoted E for simplicity) and metal fluoride (MeF), shown in Reaction Scheme I,
 |
in which KMeF is the MeF dissociation constant. In Fig. 5 the observed rate constant, kobs, for inhibition of Na,K-ATPase activity by increasing concentrations of BeSO4, AlCl3, and AlCl3 + ADP (1 mm) all in the presence of 5 mm NaF are shown. The concentrations of BeSO4 and AlCl3 were converted to concentrations of the metal fluoride complexes BeF3− and AlF4− as estimated to comprise ∼70 and 60% of the total metal fluoride complexes in the presence of 5 mm fluoride (24). The relation between the rate of inhibition and concentration of MgCl2 in the presence of 5 mm NaF could not be measured accurately because of very low kobs of this reaction. As seen kobs was a hyperbolic function of the metal fluoride concentration in accordance with Reaction Scheme I, and not linear as expected for a one-step reaction. According to this reaction the following analytical expression, Equation 4, for the observed rate constant is given.
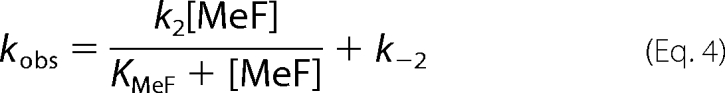 |
Using this equation to fit the data shown in Figs. 5A-C KMeF, k2, and k−2 were found. Thus k−2 is the intercept with the y axis, and kobs at saturating metal fluoride concentration equals k−2+k2. The dissociation constants for BeF3−, AlF4−, and AlF4−·ADP at pH 7.5 found from the fits were: 358 μm, 149 μm, and 218 μm, respectively. As indicated all values of KMeF were significantly larger than the half-saturation inhibitor constants (Ki) calculated from equilibrium measurements of metal fluoride inhibition of enzyme activity shown in Fig. 2. This is expected, since KMeF will be larger than Ki by a factor of (k2 + k−2)/k−2 as indicated by the reaction given in scheme I. Taking this into account the calculated K0.5 (Ki) values at pH 7.5 became 9 μm for BeF3−, 17 μm for AlF4−, and 26 μm in the case of AlF4−·ADP, in reasonable agreement with the measured Ki value given in Fig. 2 given the uncertainty in the estimation of k−2.
FIGURE 4.

Time course of NaF inhibition of Na,K-ATPase activity at increasing NaF-concentration and a constant MgCl2 concentration of 5 mm at pH 7.5. A, rate of inhibition at increasing NaF concentrations (1, 3, 10, 30, 50, 75, and 100 mm). The curves are one-phase exponential fits. B, observed rate constants, kobs as a function of the NaF concentration. The stippled curve shows the fitted Hill equation with a K0.5 values of 42 ± 4 mm and a Hill coefficient set to 4.0.
FIGURE 5.

Fluoride concentration dependence of kobs for inhibition of Na,K-ATPase activity by different fluoride complexes at pH 7.5. A, BeF3−; B, AlF4−; C, AlF4−·ADP. The curves show fit of the equation kobs = (k2[MeF])/(KMeF + [MeF])) + k−2 to the data. The fitted k2, k−2, and KMeF values for BeF3− (panel A) are: 0.32 ± 0.14 s−1, 0.009 ± 0.004 s−1, and 358 ± 65 μm; for AlF4− (panel B): 0.16 ± 0.05 s−1, 0.008 ± 0.002 s−1, and 149 ± 25 μm; and for AlF4−·ADP (panel C): 0.070 ± 0.004 s−1, 0.009 ± 0.002 s−1, and 218 ± 63 μm. From these values, the calculated inhibitor constant Ki = KMeF/(k2+k−2)/k−2 then becomes 9 ± 4 μm for BeF3−, 17 ± 5 μm for AlF4−, and 26 ± 7 μm for AlF4−·ADP.
Characterization of Metal Fluoride Stabilized EP Forms by Proteinase K Cleavage
To characterize the various fluoride-stabilized phosphoform analogues proteinase K (PK) cleavage was employed. The proteinase K cleavage pattern of SERCA1a has previously been characterized in details to probe the protein folding (25, 26). In Fig. 6A the PK cleavage patterns of enzyme stabilized by the various fluoride analogues of phosphate are shown and compared with the cleavage pattern of E2P produced by phosphorylation of the enzyme with MgPi. As seen the PK cleavage patterns for E·BeFx and E·MgPi (lanes 3 and 5) were very similar. In both cases a clear band with approximately molecular mass of 95 kDa was observed, which is missing or much weaker in all other conditions. This band is probably equivalent to the p95 band in SERCA obtained after PK cleavage in the absence of Ca2+ arising from cleavage at L119/K120 (25, 26). In shark Na,K-ATPase this cleavage site is equivalent to F161/K162 positioned at a similar short helix (M2′) in the connection between M2 and the A-domain (as in SERCA), and previously demonstrated to be a trypsin cleavage site exposed by ouabain binding (27). The cleavage pattern of E·MgFx and E·AlFx appeared similar, both lacking the 95 kDa band, although the α subunit seemed to be somewhat protected from PK cleavage by AlFx. In Fig. 6 (panels B and C) the time course of PK cleavage of BeFx- and AlFx-treated enzyme is shown. As seen AlFx protected completely the cleavage site producing the 95 kDa band. In the presence of ADP (panel A, lanes 6 and 7) the PK cleavage pattern of enzyme treated with AlFx or MgPi changed, the band migrating at ∼55 kDa was much more prominent than in all other cleavage patterns, whereas the 30 kDa band was weaker. The latter band probably arises from secondary cleavage of the 55 kDa band (see panels B and C) and Edman degradation analysis indicated an N-terminal sequence 376DKTG that could be recognized in the shark Na,K-ATPase sequence as corresponding to the phosphorylation site indicating cleavage at S375 just next to the aspartate D376, the residue phosphorylated. Thus, this fragment seems to be equivalent to the p30 fragment in the PK cleavage of SERCA, which has a cleavage site at S350 immediately before the phosphorylation site and results from secondary cleavage of a p54 fragment containing M3/M4 together with a large part of the cytoplasmic phosphorylation domain (25). In Fig. 7 the PK cleavage sites determined for the shark Na,K-ATPase and as identified in SERCA1a (25, 26) (translated to shark Na,K-ATPase numbering) are indicated in a schematic view (panel A) and in the ribbon model (panel B) of the shark Na,K-ATPase crystal structure (12). According to this, the 55 kDa peptide includes amino acids E278 to I749/V762, and the 30 kDa peptide comprises D376 to V603. Although the sequence around the phosphorylation site is conserved between SERCA and Na,K-ATPase the PK digestion pattern was different in the two enzymes, because in SERCA this cleavage site is protected completely in all of the phosphoforms (28–30). This could indicate that the cytoplasmic headpiece of the Na,K-ATPase is more loosely organized in the E2P conformation than in SERCA, in accordance with the Na,K-ATPase crystal structure (12) (in fact SERCA E2P has the most compactly organized headpiece of any intermediate).
FIGURE 6.

PK treatment of Na,K-ATPase phosphorylated by MgPi or by different metal fluorides. A, in lane 1 untreated enzyme is shown with positions of the α- and β-subunits (∼100 and 55 kDa) indicated. In lanes 2–7, 100 μg of protein was suspended in 25 mm histidine, pH 7.0 and treated with the following ligands to stabilize the enzyme in specific phosphoenzyme states: 4 mm NaF and 4 mm MgCl2 (E·MgFx, lane 2), 4 mm NaF and 50 μl of BeSO4 (E·BeFx, lane 3), 4 mm NaF, and 100 μm AlCl3 (E·AlFx, lane 4), 4 mm MgCl2, and 1 mm Pi (MgPi, lane 5). The right hand part of the gel show the effects of ADP: 4 mm NaF and 100 μm AlCl3 plus 1 mm ADP (E·AlFx·ADP, lane 6) and 4 mm MgCl2 and 1 mm Pi + 1 mm ADP (MgPi·ADP, lane 6). Bands that are sensitive to addition of ADP are indicated by stippled arrows. B, time course (0–40 min) of PK cleavage of BeFx-treated enzyme. C, time course (0–40 min) of PK cleavage of AlFx-treated enzyme. After termination of proteolysis 40 μg of protein was loaded onto 8% SDS-PAGE, and the gel was stained with Coomassie Blue. The molecular masses of most prominent bands are indicated by arrows. A representative of three independent experiments is shown.
FIGURE 7.

Localization of PK cleavage sites in shark Na,K-ATPase. A, sketch showing the localization of PK cleavage sites as determined in shark Na,K-ATPase (red) and from investigations using SERCA1a (25, 27). The numbers in parentheses refer to the SERCA sequence. According to the sketch the p95 peptide is the large fragment resulting from cleavage at K162, the p55 peptide runs from E278 to either I749 or V762 (both sites are cleaved in SERCA), and the p30 peptide results from cleavage of p55 at S375, just before the phosphorylation site (circled P), and at V603. Five of the cleavage sites, except the sites at V603, I749, and N838 (I611, V734, and D818 in SERCA), are conserved between SERCA and Na,K-ATPase. B, a ribbon model of the cytoplasmic part of the shark Na,K-ATPase (the stippled frame in panel A) with the cleavage sites indicated in stick presentation. N838 is the tryptic cleavage site giving rise to the C-terminal 19 kDa peptide. The N-, P-, and A-domains are indicated.
In the presence of MgPi, the 95 kDa band was absent after 40 min of digestion when ADP was present (Fig. 6, lane 7). Thus ADP seems to change the cleavage pattern from the typically E2P-like patterns observed with BeFx and MgPi (lanes 3 and 5) probably shifting the enzyme conformation toward an E1-like conformation. Accordingly, oligomycin, an inhibitor that stabilizes the E1P conformation (31), did not change the PK cleavage pattern of the AlFx·ADP-stabilized enzyme (not shown).
Interaction of Cardiotonic Steroids with Metal Fluoride Complexes of Na,K-ATPase
To investigate the rate of inhibition by CTS binding to ATPase stabilized by different metal fluorides, the fluorescence associated with the binding of 9-anthroyl ouabain (AO) to the different phosphoenzyme intermediates was measured at 23 °C. Binding of AO to the enzyme resembles that of ouabain regarding specificity and ligand requirements, but in addition binding results in a large fluorescence increase making it possible to monitor directly the interaction with the enzyme (32). In Fig. 8 the fluorescence responses following the addition of AO to enzyme in the presence of Mg2+ alone (E(+Mg2+)), or to phosphoenzyme formed by MgPi (E2P) were compared with those with different metal fluoride complexes of Na,K-ATPase. As indicated in Fig. 8A binding of AO to the E(+Mg2+) and E2P state proceeded with a similar rate constant of about 0.013 s−1 and caused a relative fluorescence increase (ΔF/F0) of 13.1% and 34.8%, respectively. As seen from Fig. 8B, which has the same ordinate scale as Fig. 8A, binding of AO to E·BeFx was faster with a rate constant of 0.033 s−1 and caused a much larger fluorescence increase (ΔF/F0 of 67.4%). The rate constant for AO binding to E·AlFx was 0.0017 s−1 and the ΔF/F0 = 1.5%. The fluorescence increase following binding of AO to E·MgFx or E·AlFx·ADP was too low to be detected at the AO concentration used and within the measured time interval of 600 s. The small very rapid fluorescence increase immediately after addition of enzyme is probably due to partitioning of AO into the lipid phase of the membranes (33). Comparison of fluorescence change with the inhibition of hydrolytic activity after preincubation of enzyme for variable time periods in the presence of cardiotonic steroids and either Mg2+ or MgPi confirmed the fluorescence results that cardiotonic steroids bind to free enzyme in the presence of Mg2+ with a rate similar to that to the phosphoenzyme, but with lower inhibitory potency or affinity (Fig. 9). As indicated the inhibitory effects of anthroyl ouabain closely resembled that of ouabain. Ouabagenin inhibition seemed to be somewhat faster, at least for binding to E2P, but with less inhibitory potency, in accord with previous findings (26).
FIGURE 8.

Fluorescence associated with anthroyl ouabain binding to different enzyme intermediates. The enzyme was stabilized in the indicated conformations by incubation for 3 min at 20 °C followed by 1 h on ice with the ligands as described under “Experimental Procedures.” The cuvette contained the same incubation media plus 1 μm AO and ∼60 μg enzyme was added. The curves show monoexponential fits to the data. A, fluorescence increase associated with AO binding to E(+Mg2+) and E2P. The observed rate constants were 13.2·10−3 ± 2·10−4 s−1, and 13.9 ·10−3 ± 4·10−5 s−1, respectively, and the relative fluorescence increase (ΔF/F0) 13.1% and 34.8%. B, AO binding to metal fluoride-stabilized enzyme. In the case of E·MgFx and E·AlFx·ADP, the fluorescence increase was too low to be detected. The observed rate constant for AO binding to E·AlFx was 1.7·10−3 ± 5·10−5 s−1 ((ΔF/F0 = 1.46%) and to E·BeFx 33.2·10−3 ± 8·10−5 s−1 ((ΔF/F0 = 67.4%). In the E·BeFx experiment 25 mm KCl (20 μl) was added at the indicated positions. As seen the addition of K+ (25 mm) did not cause AO dissociation within the measured time (the sudden drop in fluorescence is due to dilution). The scale of the y axis is identical in the two panels.
FIGURE 9.
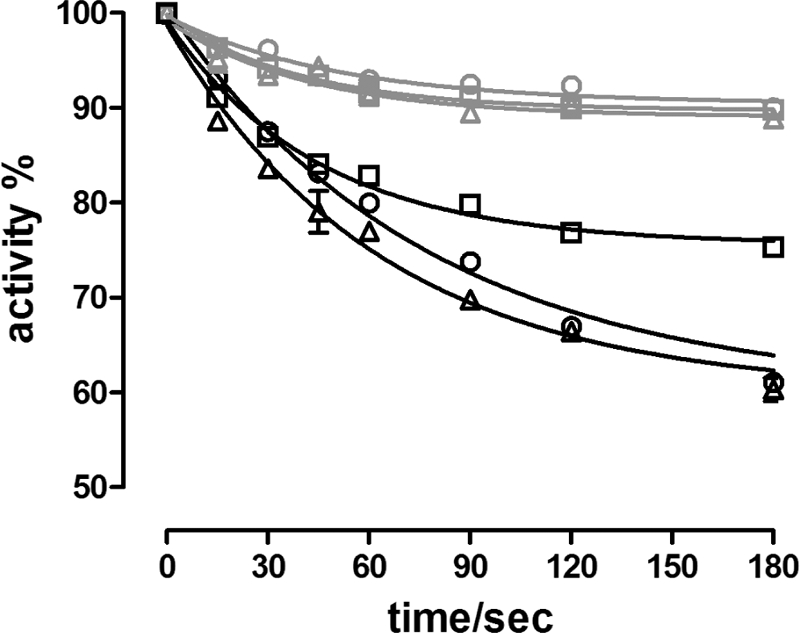
Effect of phosphorylation on the inhibition of Na,K-ATPase activity by cardiotonic steroids. Hydrolytic activity (20 °C) of enzyme following preincubation for various time periods with 1 μm ouabain (○), ouabagenin (□), or anthroyl ouabain (△) and either Mg2+ alone (5 mm), or Mg2+ (5 mm) plus Pi (1 mm). The data were fitted with a monoexponential function. The observed rate constants (kobs) and relative inhibition of the fits in the presence of only Mg2+ (gray curves) were: ouabain, 0.019 ± 0.004 s−1 and 8.5%; OG, 0.025 ± 0.005 and 10.3%; AO, 0.024 ± 0.006 s−1 and 11.0%. In the presence of both Mg2+ and Pi (black curves) the fitting parameters were: ouabain, 0.013 ± 0.001 s−1 and 40.0%; OG, 0.022 ± 0.003 s−1, and 24.4%; AO, 0.016 ± 0.002 s−1, and 40.0%.
Reactivation of Enzyme Activity after Inhibition with Metal Fluorides
Reactivation of Na,K-ATPase activity stabilized in the E·MgFx form by high Na+ concentrations has previously been demonstrated to be a very slow process with a rate constant of about 3·10−3 s−1 at 37 °C and 150 mm NaCl independent of ATP, Mg2+, and pH, but antagonized by K+ (10). In the present investigation reactivation of the enzyme stabilized by various metal fluorides was followed by addition of 150 mm NaCl at 23 °C and pH 7.5. As seen from Fig. 10A the reactivations followed single exponentials (black curves) with pseudo first order rate constants that varied between 1.4·10−3 and 28·10−3 s−1 depending on the metal fluoride (Table 2). Reactivation of the enzyme treated with BeFx was the fastest followed by AlFx- and AlFx·ADP-treated enzyme. Inhibition by MgFx was only very slowly relieved by Na+ reactivation. In all cases Na+ reactivation of the metal fluoride-treated enzyme activity was complete. Inclusion of Mg2+ (5 mm) during incubation with BeSO4 or AlCl3, as used for SERCA (4, 5, 36), decelerated reactivation of Na,K-ATPase by 150 mm Na+ by a factor of ∼20 (not shown), probably due to formation of enzyme with bound MgFx. If the enzyme was inhibited by the same metal fluorides, but with KF instead of NaF as the fluoride donor, the reactivations were much lower (gray curves), except for the BeFx-treated enzyme, indicating that when K+ is bound or occluded the release of the metal fluoride was impeded. This could indicate that in the presence of bound or occluded K+ the thermal fluctuations in the cytoplasmic and transmembrane domains are more restricted than when the cation binding sites are unoccupied. In Fig. 10B the activity for enzyme reacted with the various metal fluorides after reactivation for 60 min is shown as a function of the Na+ concentration. Reactivation of E·MgFx was clearly much less sensitive to Na+ than the other metal fluoride complexes, with K0.5 values of ∼89 mm. It was also clearly sigmoid with a nH ∼2. The very high Na+ affinity for reactivation of the E·AlFx·ADP form supports the hypothesis that the conformation is E1P-like.
FIGURE 10.

Time course of reactivation of fluoride-inhibited Na,K-ATPase. A, time course of reactivation of Na,K-ATPase at 23 °C pH 7.5 by incubation in 150 mm NaCl prior to measurement of hydrolytic activity. The enzyme was treated with 5 mm NaF (black curves), or KF (gray curves) and either 5 mm MgCl2 (○), 5 μm BeSO4 (□), 200 μm AlCl3 (♢), 200 μm AlCl3 plus 1 mm ADP (△). The curves are monoexponential fits to the data. The observed rate constants, kobs are given in Table 2. The black symbols are with 5 mm NaF, and the gray symbols are with 5 mm KF as the fluoride donor. B, activity after 60 min reactivation as a function of Na+ concentration in the reactivation medium. Enzyme was treated with metal fluorides as indicated in panel A. The curves are fits using a one site binding model (hyperbola), or a sigmoid dose-response model. The fitted K0.5 values are given in Table 2. C, reactivation of BeF-treated enzyme with bound ouabain (10 μm, black curves) or ouabagenin (100 μm, gray curves). The CTS were included for 50 min in the metal fluoride incubation media before reactivation by 150 mm NaCl and activity test. The kobs for the reactivation in the presence of OG is 0.67·10−3 ± 0.04·10−3 s−1.
TABLE 2.
Observed rate constant and apparent Na+ affinities for reactivation of enzyme after metal fluoride treatment in either NaF or KF
| NaF |
KF |
||
|---|---|---|---|
| kobs | K0.5 | kobs | |
| 10−3s−1 | mm | 10−3s−1 | |
| MgCl2 | 1.40 ± 0.03 | 89.0 ± 1.1a | 0.300 ± 0.005 |
| BeSO4 | 27.8 ± 3.1 | 8.1 ± 1.4 | 29.5 ± 1.3 |
| AlCl3 | 19.3 ± 1.0 | 7.0 ± 1.0 | 2.53 ± 0.08 |
| AlCl3·ADP | 14.8 ± 1.0 | 0.8 ± 0.4 | 0.40 ± 0.07 |
a The relation is clearly sigmoid with a Hill coefficient of 2.1 ± 0.1.
As seen from Fig. 8 the only metal fluoride analog of Na,K-ATPase phosphoenzyme that readily binds anthroyl ouabain was the BeFx-treated enzyme. To measure the effects of CTS binding to the E·BeFx form on Na+ reactivation, the enzyme was first incubated for 10 min with BeFx and then either 10 μm ouabain or 100 μm ouabain was included for a further 50 min. These concentrations are saturating for inhibition of the Na,K-ATPase activity but decreases to non-inhibiting concentrations after the 200 times dilution during reactivation and activity test (26). When the reactivation of BeFx-treated enzyme was investigated after inclusion of 10 μm ouabain in the fluoride incubation medium reactivation was very limited (Fig. 10C, black curve) indicating that ouabain-binding effectively blocked the access pathway for Na+ reactivation, in accordance with Na+ reactivation taking place from the extracellular side. In contrast the reactivation by Na+ was substantial, but slow, for the ouabagenin-bound form (Fig. 10C, gray curve), indicating that Na+ access to the (extracellular) binding sites was limited, but still possible after ouabagenin binding to the BeFx-treated enzyme. Thus, ouabain, but not ouabagenin, blocks the Na+-induced release of the metal fluoride from the phosphorylation site. This is in accordance with the AO fluorescence experiments shown in Fig. 8B, where access of K+ is blocked by AO binding to the E·BeFx conformation.
DISCUSSION
Fluoride complexes with magnesium, beryllium, and aluminum have been demonstrated to bind to P-type ATPases by acting as phosphate analogues at the phosphorylated aspartate (2–5). From the crystal structures of Ca-ATPase and Na,K- ATPase the bound metal fluoride complexes are demonstrated to be MgF42− (7, 11, 12), BeF3−, and AlF4− (34, 35). Biochemical and structural studies of interactions of metal fluorides with Ca-ATPase and Na,K-ATPase have demonstrated that they are useful tools in the study of the change in conformational states of these P-type ATPases that couples ATP hydrolysis to active cation transport. MgF42− bound at the catalytic site has a tetrahedral geometry and is equivalent to the non-covalently bound Pi, representing the product state of the E2·P hydrolysis. BeF3− also has a tetrahedral geometry, but is likely to form a covalent bond with a carboxyl oxygen of the Asp so that it mimics aspartylphosphate (i.e. E2-P ground state) (36). The bound AlF4− has a planar structure, where an oxygen from the hydrolytic water molecule and an Asp oxygen coordinate to the aluminum ion thus producing the trigonal bipyramidal structure like the penta-coordinated Pi in the E2∼P transition state. In SERCA1, if Ca2+ is present, AlF4− plus ADP stabilizes a transition state analog (i.e. E1∼P·ADP) (7, 8). This seems also to be the case with Na,K-ATPase, as indicated by the PK cleavage pattern of the AlFx·ADP-stabilized enzyme conformation (Fig. 6), which was clearly distinct from the Be-fluoride and MgPi stabilized E2-P ground states. Several other properties were also distinct for the E·AlFx·ADP form including the inhibition pattern, with a lower pH sensitivity (Table 1) and a high affinity reactivation by Na+ (Fig. 10B). As with SERCA, the E·BeFx state closely resembled the E2-P state. The PK cleavage pattern in Fig. 6A clearly showed this, as PK yielded a 95 kDa fragment in both E·BeFx and E2·MgPi (lanes 3 and 5), which was absent in E·AlFx (Fig. 6C).
As seen from Fig. 1 the inhibition by NaF at a constant MgCl2 concentration of 5 mm had an inhibitor constant, Ki that increased from 1.3 mm at pH 6.5 to 6.4 mm at pH 8.5 at 24 °C. The Hill coefficient (nH) was about −2.2, in accordance with the theoretical lower limit for the number of bound fluorines in the complex, MgF42−. In Fig. 2 the inhibition by MgCl2, BeSO4, AlCl3, and AlCl3+1 mm ADP at 5 mm NaF is shown at pH 7.5. Previously an inhibitor constant, Ki of 0.32 μm for AlCl3 at 0.3 mm NaF and 5.7 mm MgCl2 to pig kidney Na,K-ATPase at pH 6.8 at 37 °C has been measured (2), which is somewhat lower than the 12.5 μm found in the present investigation (Table 1) under different conditions and at 23 °C.
In Table 1 the inhibitor constants at varying pH are collected. In all cases the apparent affinity as deduced from these values was higher at low pH (compared with high pH) values. Similar effects of pH have previously been observed, and attributed to a stabilization of the E2 conformation at low pH (9). Also, a high pH shifts the E1P/E2P poise and stabilizes E1P (27, 37).
Also seen from Table 1 is that the Hill coefficient for inhibition was significantly larger than one for all metal fluoride complexes tested. Although nH is an empirical parameter in the fitting process it has a structural correlate, i.e. nH ≠ −1 indicates that more than one metal ion is bound in the Na,K- ATPase phosphorylation domain. For Mg2+ this suggests that two Mg2+ ions are found in the phosphorylation domain in the Na,K-ATPase crystal structure and responsible for inhibition, one with MgF42− and one at the Mg2+ sub-site in the P-domain (D717 in shark, Fig. 3) (12). For SERCA it is well documented that the metal ion site in the P-domain (D703) accommodates almost any divalent metal in E1P and E2P (38). Therefore Be2+ may be able to bind to the Mg2+ site in the P-domain of Na,K-ATPase. The Hill coefficient for AlCl3 was about 2 indicating binding of more than one Al3+ in the phosphorylation domain. In the E1∼AlF4−·ADP crystal structures of SERCA there is one AlF4− in the phosphorylation site and two additional Mg2+ ions, one binds to the P domain and the other to ADP. Thus in the absence of ADP it is likely that two Al3+ ions can bind. As the crystal structures of Na,K-ATPase and SERCA1 in the E2·MgF42− form show somewhat different positions for the A-domain, it is also possible that other metal ions can be accommodated in the phosphorylation site of Na,K-ATPase.
The rate of inhibition by the various metal fluorides could all be fitted with monoexponential time functions characterized by a single pseudo first-order rate constant (Fig. 4). The observed rate constants for inhibition by the different metal fluorides were hyperbolic functions of the metal fluoride concentrations indicating that the reaction of enzyme with MeF proceeds through formation of an intermediate E:MeF complex, which slowly transforms to the E·MeF form (see Reaction Scheme I). From the experiments the dissociation constants (KMeF) for BeF3−, AlF4−, and AlF4−·ADP at pH 7.5 were 358, 149, and 218 μm, respectively, corresponding to half-maximal saturation constants, K0.5, of 9, 17, and 26 μm, respectively.
Similar to phosphate and vanadate, metal fluorides have been demonstrated to promote binding of ouabain to Na,K-ATPase (6, 39), and this ouabain binding is antagonized by extracellular K+. The rate of inhibition and ease of binding of CTS to different metal fluoride complexes of Na,K-ATPase should reflect the structural compatibility for binding, i.e. the extent of structural rearrangements necessary for accommodating the binding of the CTS. The crystal structure of the E2·2K+·Pi intermediate with ouabain bound at low affinity that was recently characterized (1) strongly suggests that ouabain binding takes place through a structure equivalent to the luminal Ca2+ exit pathway observed in the crystal structure of the E2-P ground-state (E2·BeF3−) of Ca-ATPase (34, 35).
As seen in Fig. 8, the highest binding rate and fluorescence intensity of anthroyl ouabain occurred in the E·BeFx form, with an observed rate constant twice that of binding to dephosphenzyme and E2P, and 20-fold faster than to the E·AlFx intermediate. AO binding to enzyme intermediates stabilized by AlFx·ADP or MgFx was immeasurable suggesting a very low affinity of these complexes for CTS. K+ addition to the E·BeFx form after AO binding decreased the AO fluorescence only slowly within the recorded time period, suggesting that the K+-access pathway is blocked by the bound AO (Fig. 8B, upper trace). Comparison of the fluorescence responses with the rate of inhibition of catalytic activity under otherwise identical conditions (20 °C and 1 μm AO) showed very similar rates, and with very similar relative levels of inhibition and fluorescence increase (Fig. 9).
The binding of AO to the dephosphoenzyme in the presence of only Mg2+ was as fast as binding of AO to phosphorylated enzyme, but with a reduced level of fluorescence (Fig. 8A) and level of inhibition (Fig. 9). This is not a unique property of shark Na,K-ATPase because similar results were obtained using pig kidney enzyme (not shown). Similar AO binding to the dephospho-form of rabbit kidney Na,K-ATPase was observed by Fortes at 37 °C, although the binding was ∼10 times slower than that to phosphorylated enzyme (32, 33). In any case, it does not seem to be mandatory that the enzyme is phosphorylated to bind ouabain, in accord with the thermal fluctuation hypothesis mentioned below.
Structurally, CTS are composed of three major components: a 5-membered lactone ring, a steroid core, and a sugar moiety, which in the case of ouabain is rhamnose. Ouabagenin is identical to ouabain, but without an attached rhamnose. Traditionally, the slow binding of CTS to Na,K-ATPase has been explained by an induced fit, multi-step binding mechanism where the lactone ring binds first, the steroid core then opens a binding cavity, and the glycoside finally stabilizes the binding (40). It is indeed feasible that ouabain binds to Na,K-ATPase by an induced fit mechanism. However, it seems likely that the conformations induced by CTS binding are attainable even in its absence. Ouabain may simply stabilize one particular conformation, which may not be highly populated in the absence of ouabain. In the E2-P ground state, M1 and M2 are closer to M4 and there may already be a cavity/channel for releasing Na+. Then, ouabain may simply fit there, as in thapsigargin binding to SERCA. Thapsigargin binds to E2·BeF3− without affecting the cytoplasmic domains (36). This means that the transmembrane domain undergoes significant independent thermal fluctuations. Binding of CTS to the Na,K-ATPase was most pronounced (fast and with high fluorescence) with the E·BeFx form, which is compatible with the fact that BeF3− stabilizes the E2-P ground state in SERCA. In the crystal structure a luminal Ca2+ pathway is already formed (34, 35) and the structure equivalent in Na,K-ATPase could serve as an entrance pathway for ouabain (1).
The inhibition of Na,K-ATPase by metal fluoride complexes was reversible. Reactivation by high Na+ concentration was slow for MgFx complexes, as also previously shown with dog kidney Na,K-ATPase (10). The fastest reactivation, except for E·AlFx·ADP, at 150 mm NaCl, 23 °C and pH 7.5 was for the E·BeFx form, which had a kobs of 2.8·10−2 s−1, twenty times faster than reactivation of the E·MgFx form (Table 2). Reactivation of E·AlFx·ADP took place with much higher Na+ affinity than for the other EP analogues, indicating that this form is an E1∼P·ADP like conformation (Fig. 10B). The reactivation of metal fluoride treated enzyme by Na+ was strongly opposed by the presence of K+ during the metal fluoride incubation, except for BeFx-treated enzyme (Fig. 10A). Thus, in the E2·BeFx conformation Na+ and K+ seem to be exchangeable, in accord with an open extracellular cation pathway, whereas in the E2·AlFx·ADP and in the E2·MgFx conformation, K+ seems to be tightly bound preventing Na+ reactivation of the enzyme. As in SERCA the cation entrance pathway probably closes as a result of the structural rearrangements associated with the change in phosphate coordination in the phosphorylation site from the covalently bound tetrahedral E2-P ground state (E·BeFx analog), via the trigonal bipyramidal E2∼P transition state (E·AlFx analog), to the non-covalently bound E2·P product state (E·MgFx analog) (36). It also supports the notion that reactivation is taking place by Na+ binding to the K+ sites on E2P-like conformations, i.e. to the extracellular sites. Thus, the situation resembles SERCA, where Ca2+ reactivation takes place by low affinity binding of Ca2+ to the luminal transport sites (36).
Reactivation of BeFx-treated Na,K-ATPase with bound ouabain (Fig. 10C) shows that ouabain binding to E2·BeFx prevented reactivation by high concentration of Na+, demonstrating that ouabain binding blocks the extracellular pathway for cations, in accord with the lack of K+ effects on fluorescence after binding of anthroyl ouabain (Fig. 8B). In contrast, reactivation of the ouabagenin-bound enzyme was significant, although about 40 times slower than for the unbound form (Fig. 10C) indicating that the CTS sugar moiety is pivotal in closing the CTS binding cavity. Exactly identical results were found comparing reactivation after digoxin/digoxigenin and digitoxin/digitoxigenin demonstrating the general nature of these effects.3 Probably, the unbinding reaction of ouabagenin is fast enough to allow Na+ ions to bind each time ouabagenin comes off. The results are thus in agreement with the finding that the dissociation rate constants for the aglycones are much larger than for the glycosides (41). An even more specific role of the CTS sugar moiety was assigned recently by Katz et al. (42), who demonstrated that the sugar determines the isoform specificity. Thus residues similar in human α2 and α3 but different in α1 (Q126, E314, V888, and W894 in human α1, which are equivalent to A126, G314, V888, and W894 in shark; cf. Fig 11) are all located in the extracellular loops close to the CTS sugar moiety. Aglycones like ouabagenin show no isoform selectivity since the structural differences between the α isoforms are spatially confined to areas close to the sugar moiety.
FIGURE 11.

The Na,K-ATPase binding vestibule for ouabain according to the low affinity crystal structure E2·MgF42− with bound K+ ions. Ouabain is shown in red and in stick presentation. A, model viewed approximately parallel to the membrane plane. The arrow indicates the displacement of the M1-M2 helices that needs to taken place to induce the high affinity complex where E122 moves within hydrogen bond distance of the -OH group at C3* in the rhamnose and closes the binding cavity. B, same structure viewed approximately perpendicular to the membrane from the extracellular side. Charged residues at the level of the rhamnose are indicated, and distances from the sugar are indicated. Coordinates of the atomic model are derived from PDB entry 3A3Y.
All these findings are in keeping with the recent low-affinity ouabain-bound crystal structure of the Na,K-ATPase from the shark (1), which demonstrates that ouabain is wedged deeply into the transmembrane domain of Na,K-ATPase interacting mainly with the M1-M2 and M4-M6 helices (Fig. 11). The lactone ring is placed near the K+-binding sites and the sugar moiety is exposed to the solvent. The binding of ouabain causes rearrangements of the M1-M4 transmembrane helices to create a binding cavity much like the one observed in the crystal structure of SERCA1a in the E2-P ground state stabilized by BeF3− (34, 35). In the homology model of the high-affinity ouabain bound crystal structure based on this E2-P ground state (E2·BeF3−) of Ca-ATPase the rearrangements in the extracellular domain necessary to confer high affinity binding of ouabain are described (1). The M1-M2 helices have moved to form a complementary surface to ouabain and in doing so close the binding cavity (see Fig. 11). The Glu-122 side chain in the M1-M2 loop comes within hydrogen bond distance of the OH-group at C3* in rhamnose, which explains why the sugar moiety is important for high affinity binding. A similar closing of the binding cavity by thapsigargin is observed in SERCA (34) and in the recent high affinity ouabain-bound structure of Na,K-ATPase from pig kidney (16). The prevention of Na+ reactivation of BeFx-treated Na,K-ATPase by bound ouabain but not with ouabagenin emphasizes the pivotal role of the sugar moiety for stabilization of the high affinity binding of cardiotonic steroids, and suggests that after closing of the ouabain binding cavity Na+ access to the extracellular cation binding sites are limited.
Acknowledgments
We thank Anne Mette Bech Sørensen, Bianca Franchi, and Anne Lillevang for excellent technical assistance. We are grateful to D. B. McIntosh for help in improving the manuscript.
This work was supported by The Danish Medical Research Foundation and by an FI/Danish-Japanese cooperation program from The Danish Agency for Science Technology and Innovation (to F. C.) and by a Specially Promoted Project Grant from the Ministry of Education, Culture, Sports, Science and Technology of Japan and by a Strategic Japanese-Danish Cooperative Program Grant from Japan Science and Technology Agency (to C. T.).
F. Cornelius, manuscript in preparation.
- SERCA1a
- sarco(endo)plasmic Ca-ATPase 1a
- O
- ouabain
- AO
- 9-anthroyl ouabain
- OG
- ouabagenin
- MeF
- metal fluoride complex
- CTS
- cardiotonic steroid
- PK
- proteinase K
- EP
- phosphoenzyme.
REFERENCES
- 1. Ogawa H., Shinoda T., Cornelius F., Toyoshima C. (2009) Proc. Natl. Acad. Sci. U.S.A. 106, 13742–13747 [DOI] [PMC free article] [PubMed] [Google Scholar]
- 2. Missiaen L., Wuytack F., De Smedt H., Vrolix M., Casteels R. (1988) Biochem. J. 253, 827–833 [DOI] [PMC free article] [PubMed] [Google Scholar]
- 3. Murphy A. J., Coll R. J. (1992) J. Biol. Chem. 267, 16990–16994 [PubMed] [Google Scholar]
- 4. Murphy A. J., Coll R. J. (1993) J. Biol. Chem. 268, 23307–23310 [PubMed] [Google Scholar]
- 5. Troullier A., Giradet J. L., Dupont Y. (1992) J. Biol. Chem. 267, 22821–22829 [PubMed] [Google Scholar]
- 6. Toyoshima C. (2008) Arch. Biochim. Biophys. 476, 3–11 [DOI] [PubMed] [Google Scholar]
- 7. Toyoshima C., Nomura H., Tsuda T. (2004) Nature 432, 361–368 [DOI] [PubMed] [Google Scholar]
- 8. Sørensen T. L., Møller J. V., Nissen P. (2004) Science 304, 1672–1675 [DOI] [PubMed] [Google Scholar]
- 9. Robinson J. D., Davis R. L., Steinberg M. (1986) J. Bioenerg. Biomemb. 18, 521–531 [DOI] [PubMed] [Google Scholar]
- 10. Murphy A. J., Hoover J. C. (1992) J. Biol. Chem. 267, 16995–17000 [PubMed] [Google Scholar]
- 11. Morth J. P., Pedersen B. P., Toustrup-Jensen M. S., Sørensen T. L., Petersen J., Andersen J. P., Vilsen B., Nissen P. (2007) Nature 450, 1043–1049 [DOI] [PubMed] [Google Scholar]
- 12. Shinoda T., Ogawa H., Cornelius F., Toyoshima C. (2009) Nature 459, 446–450 [DOI] [PubMed] [Google Scholar]
- 13. Schatzmann H. J. (1953) Helv. Physiol. Pharmacol. Acta 11, 346–354 [PubMed] [Google Scholar]
- 14. Lingrel J. B. (2010) Annu. Rev. Physiol. 72, 395–412 [DOI] [PMC free article] [PubMed] [Google Scholar]
- 15. Yoda A., Yoda S. (1982) Mol. Pharmacol. 22, 700–705 [PubMed] [Google Scholar]
- 16. Yatime L., Laursen M., Morth J. P., Esmann M., Nissen P., Fedosova N. U. (2011) J. Struct. Biol. 174, 296–306 [DOI] [PubMed] [Google Scholar]
- 17. Skou J. C., Esmann M. (1988) Methods in Enzymology 156, 43–46 [DOI] [PubMed] [Google Scholar]
- 18. Mahmmoud Y. A., Vorum H., Cornelius F. (2000) J. Biol. Chem. 275, 35969–35977 [DOI] [PubMed] [Google Scholar]
- 19. Peterson G. L. (1983) Methods Enzymol. 91, 95–119 [DOI] [PubMed] [Google Scholar]
- 20. Lowry O. H., Rosebrough N. J., Farr A. L., Randall R. J. (1951) J. Biol. Chem. 193, 265–275 [PubMed] [Google Scholar]
- 21. Fiske C. H., SubbaRow Y. (1925) J. Biol. Chem. 66, 375–400 [Google Scholar]
- 22. Baginski E. S., Foa P. P., Zak B. (1967) Clin. Chim. Acta 14, 155–158 [Google Scholar]
- 23. Schlicting I., Reinstein J. (1999) Nature 6, 721–723 [DOI] [PubMed] [Google Scholar]
- 24. Goldstein G. (1964) Anal. Chem. 36, 243–244 [Google Scholar]
- 25. Juul B., Turc H., Durand M. L., de Gracia A., Denoroy L., Møller J. V., Champeil P., le Maire M. (1995) J. Biol. Chem. 270, 20123–20134 [DOI] [PubMed] [Google Scholar]
- 26. Lenoir G., Picard M., Gauron C., Montigny C., Le Maréchal P., Falson P., le Maire M., Møller J. V., Champeil P. (2004) J. Biol. Chem. 279, 9156–9166 [DOI] [PubMed] [Google Scholar]
- 27. Cornelius F., Mahmmoud Y. A. (2009) Biochemistry 48, 10056–10065 [DOI] [PubMed] [Google Scholar]
- 28. Danko S., Daiho T., Yamasaki K., Kamidochi M., Suzuki H., Toyoshima C. (2001) FEBS Lett. 489, 277–282 [DOI] [PubMed] [Google Scholar]
- 29. Danko S., Yamasaki K., Daiho T., Suzuki H., Toyoshima C. (2001) FEBS Lett. 505, 129–135 [DOI] [PubMed] [Google Scholar]
- 30. Montigny C., Picard M., Lenoir G., Gauron C., Toyoshima C., Champeil P. (2007) Biochemistry 46, 15162–15174 [DOI] [PubMed] [Google Scholar]
- 31. Robinson J. D. (1982) J. Bioenerg. Biomembr. 14, 319–333 [DOI] [PubMed] [Google Scholar]
- 32. Moczydlowski E. G., Fortes P. A. G. (1980) Biochemistry 19, 969–977 [DOI] [PubMed] [Google Scholar]
- 33. Fortes P. A. G. (1977) Biochemistry 16, 531–540 [DOI] [PubMed] [Google Scholar]
- 34. Toyoshima C., Norimatsu Y., Iwasawa S., Tsuda T., Ogawa H. (2007) Proc. Natl. Acad. Sci. U.S.A. 104, 19831–19836 [DOI] [PMC free article] [PubMed] [Google Scholar]
- 35. Olesen C., Picard M., Winther A. M., Gyrup C., Morth J. P., Oxvig C., Møller J. V., Nissen P. (2007) Nature 450, 1036–1042 [DOI] [PubMed] [Google Scholar]
- 36. Danko S., Yamasaki K., Daiho T., Suzuki H. (2004) J. Biol. Chem. 279, 14991–14998 [DOI] [PubMed] [Google Scholar]
- 37. Skou J. C. (1982) Biochim. Biophys. Acta 688, 369–380 [DOI] [PubMed] [Google Scholar]
- 38. Mintz E., Lacapère J. J., Guillain F. (1990) J. Biol. Chem. 265, 18762–18768 [PubMed] [Google Scholar]
- 39. Cantley L. C., Jr., Cantley L. G., Josephson L. (1978) J. Biol. Chem. 253, 7361–7368 [PubMed] [Google Scholar]
- 40. Yoda A. (1974) Ann. N.Y. Acad. Sci. 242, 598–616 [DOI] [PubMed] [Google Scholar]
- 41. Yoda A., Yoda S. (1977) Mol. Pharmacol. 13, 352–361 [PubMed] [Google Scholar]
- 42. Katz A., Lifshitz Y., Bab-Dinitz E., Kapri-Pardes E., Goldshleger R., Tal D. M., Karlish S. J. D. (2010) J. Biol. Chem. 285, 19582–19592 [DOI] [PMC free article] [PubMed] [Google Scholar]