

Abstract
Cytochrome P450SPα (CYP152B1) isolated from Sphingomonas paucimobilis is the first P450 to be classified as a H2O2-dependent P450. P450SPα hydroxylates fatty acids with high α-regioselectivity. Herein we report the crystal structure of P450SPα with palmitic acid as a substrate at a resolution of 1.65 Å. The structure revealed that the Cα of the bound palmitic acid in one of the alternative conformations is 4.5 Å from the heme iron. This conformation explains the highly selective α-hydroxylation of fatty acid observed in P450SPα. Mutations at the active site and the F–G loop of P450SPα did not impair its regioselectivity. The crystal structures of mutants (L78F and F288G) revealed that the location of the bound palmitic acid was essentially the same as that in the WT, although amino acids at the active site were replaced with the corresponding amino acids of cytochrome P450BSβ (CYP152A1), which shows β-regioselectivity. This implies that the high regioselectivity of P450SPα is caused by the orientation of the hydrophobic channel, which is more perpendicular to the heme plane than that of P450BSβ.
Keywords: Crystal Structure, Cytochrome P450, Enzyme Catalysis, Fatty Acid Oxidation, Heme, Hydrogen Peroxide, Monooxygenation, Peroxygenase
Introduction
Cytochrome P450s (P450s)3 are ubiquitous heme-containing monooxygenases that play crucial roles in the oxidative metabolism of many exogenous and endogenous compounds (1–4). X-ray crystal structure analysis is one of the most powerful methods for visualizing the structures of P450s and their interactions with substrates in the heme cavity at the atomic level. Since the first crystal structure of P450, P450cam (CYP101A1) was reported by Poulos et al. (5), the crystal structures of P450s from mammals (6–14), archaea (15–17), and bacteria (18–27) have been reported, and interactions between their substrates and amino acid residues at substrate recognition sites have been clarified. Most P450s accomplish monooxygenation by reductive activation of molecular oxygen using NADPH or NADH to produce compound I (oxoferryl porphyrin π cation radical). P450s also use H2O2 to generate compound I, but the efficiency of this reaction is poor compared with that of reductive activation of molecular oxygen. In 1994, Matsunaga et al. (28) isolated P450SPα (CYP152B1) from Sphingomonas paucimobilis and reported that it exclusively uses H2O2 as the oxidant and catalyzes α-selective (100%) hydroxylation of long alkyl chain fatty acids (29). Although P450SPα is the first P450 to be classified as a family of H2O2-dependent P450, its crystal structure has not been determined despite its potential as a biocatalyst. The first crystal structure of H2O2-dependent P450, P450BSβ (CYP152A1), which has 44% amino acid identity to P450SPα, was reported in 2003 by Lee et al. (30). The crystal structure of a substrate-bound form of P450BSβ (Protein Data Bank code 1IZO) revealed that P450BSβ lacks general acid-base residues around the distal side of the heme, although this arrangement is highly conserved among peroxidases and peroxygenases (31–35). Instead of the general acid-base residues, the terminal carboxylate group of the bound fatty acid interacts with the guanidinium group of Arg242 located near the heme group. The distance between an oxygen atom of the carboxylate group of palmitic acid and the heme iron is 5.3 Å, which is similar to that observed in chloroperoxidase (CPO) from Caldariomyces fumago; the distance between an oxygen atom of glutamic acid side chain and the heme iron is 5.1 Å (34, 35). The location of the carboxylate group of palmitic acid bound to P450BSβ suggests that the general acid-base function for the facile formation of compound I is accomplished by the carboxylate group of the substrate (Scheme 1). Recently, we have shown that P450BSβ is able to catalyze H2O2-dependent monooxygenation of foreign compounds such as styrene and ethylbenzene in the presence of a carboxylic acid with a short alkyl chain (C4–C10), a so-called “decoy molecule” (36). The crystal structure of a heptanoic acid (C7)-bound form of P450BSβ was analyzed, and an interaction between Arg242 and the carboxylate group of heptanoic acid was detected. We also resolved the crystal structure of the substrate-free form of P450BSβ and found that binding of fatty acid or substrate analogues did not induce any notable structural change, whereas the substrate-free form of P450BSβ never reacts with H2O2 (37). These observations further confirm that substrate binding initiates the formation of compound I via a salt bridge between Arg242 and the carboxylate group at the active site.
SCHEME 1.

A proposed catalytic reaction mechanism for hydroxylation of long alkyl chain fatty acid. For the generation of compound I (oxoferryl porphyrin π-cation radical), the carboxylate group of the fatty acid (blue) that serves as a general acid-base catalyst first accepts a proton from H2O2, producing the ferric hydroperoxy complex (Fe+3-OOH). Subsequently, a proton is donated to the distal oxygen atom of the ferric hydroperoxy complex followed by the O–O bond cleavage to produce compound I.
P450BSβ oxidizes the α- and β-positions of fatty acids in a 40:60 ratio, whereas P450SPα exclusively oxidizes the α position. To elucidate the cause of this selectivity, we need to study the crystal structures of both enzymes. Although the crystal structure of the substrate-bound form of P450BSβ is known, that of P450SPα has not been resolved. Therefore, we crystallized P450SPα and succeeded in preparing high quality crystals of P450SPα. Herein we describe the x-ray crystal structure of P450SPα containing a fatty acid at a resolution of 1.65 Å and examine enzymatic properties of its mutants to study its highly selective α-hydroxylation of fatty acids. We also compare the structure of P450SPα with that of P450BSβ in the context of similarities and differences among H2O2-dependent P450s.
EXPERIMENTAL PROCEDURES
Crystallization of P450SPα
P450SPα WT was concentrated to 13.4 mg/ml in 50 mm MES (pH 7.0) containing 20% (v/v) glycerol by centrifugation using Amicon Ultra filter units (Millipore, Co.). A 2-μl aliquot of the concentrated P450SPα solution was mixed with 2 μl of a reservoir solution composed of 0.1 m HEPES (pH 7.0) and 35% (v/v) MPD. Crystals of P450SPα were grown by a sitting-drop vapor diffusion method at 20 °C for 6 days. The P450SPα L78F and F288G mutants were crystallized under the same conditions used for the WT.
Data Collection, Phasing, and Refinement of P450SPα
Crystals were flash-cooled in liquid nitrogen. X-ray diffraction data sets were collected on a beam line BL41XU instrument equipped with an ADSC Quantum 315 CCD detector at the RIKEN SPring-8 (Hyogo, Japan) with a 1.0 Å wavelength at 100 K. The HKL2000 (38) program was used for integration of diffraction intensities and scaling. Initial phases were calculated and refined using the SHELXE program (39) and the hkl2map graphical interface (40). In the calculated electron density, the main chain was clearly traceable, and the initial polypeptide chain was built using ARP/wARP (41). Model building and refinement were performed using COOT (42), CNS (43), and REFMAC5 (44). TLS refinement (45) was performed in the final stages of the refinement, defining each chain in the asymmetric unit as a separate TLS group. The resulting model had a final Rfact of 15.1% and an Rfree of 17.3% (Table 1). The final model consisted of one polypeptide chain with residues 9–415 of P450SPα, one heme, one palmitic acid, one MPD, and 371 water molecules. Structure validation was performed using WHAT-IF (46) and PROCHECK (47). X-ray diffraction data sets of the L78F and F288G mutants were collected using a beam line BL26B1 instrument equipped with an ADSC Quantum 210 CCD detector at SPring-8. The structures of L78F and F288G were solved using a molecular replacement method using MOLREP (48), followed by refinement using COOT and REMAC5. The final refinement statistics are summarized in Table 1.
TABLE 1.
Data collection and refinement statistics
| WT | L78F | F288G | |
|---|---|---|---|
| Data collection | |||
| Wavelength (Å) | 1.000 | 1.000 | 1.000 |
| Space group | P3121 | P3121 | P3121 |
| Cell dimensions | |||
| a, b, c (Å) | 94.440, 94.440, 113.553 | 94.137, 94.137, 113.402 | 94.58, 94.58, 113.449 |
| α, β, γ (°) | 90.000, 90.000, 120.000 | 90.000, 90.000, 120.000 | 90.000, 90.000,120.000 |
| Resolution (Å) | 50.00-1.68 (1.68-1.65) | 20.0-1.90 (1.97-1.90) | 20.0-1.80 (1.86-1.80) |
| No. of total observed reflections | 1,516,965 | 493,946 | 582,013 |
| No. of unique reflections | 70,272 | 46,225 | 54,812 |
| Rmerge (%)a,b | 6.4 (48.9) | 7.5 (38.0) | 6.2 (34.9) |
| Completeness (%)a | 99.1 (82.8) | 100.0 (100.0) | 99.9 (100.0) |
| I/σ(I)a | 84.5 (6.2) | 31.8 (6.2) | 36.4 (6.1) |
| Redundancya | 21.6 (17.7) | 10.7 (11.0) | 10.6 (10.6) |
| Refinement statistics | |||
| Resolution range (Å) | 19.85–1.65 | 19.98–1.90 | 19.67–1.80 |
| No. of monomer/asymmetric unit | 1 | 1 | 1 |
| Rfact/Rfree (%)c,d | 15.1/17.3 | 15.9/18.8 | 16.0/19.0 |
| RMSD bond length (Å)e | 0.012 | 0.014 | 0.012 |
| RMSD bond angles (°)e | 1.279 | 1.295 | 1.199 |
| No. of atoms | 3749 | 3576 | 3697 |
| Average B-factor (Å2) | 16.8 | 16.6 | 20.1 |
a The values in parentheses are for the highest resolution shell.
b Rmerge = ΣΣ|I − <I>|/ΣI.
c Rfact = Σ||Fo| − k|Fc||/Σ|Fo|, where Fo and Fc are the observed and calculated structure factor amplitudes, respectively.
d Rfree was calculated as the Rfact for 5% of the reflections that were not included in the refinement.
e RMSD, root mean square deviation.
Structural Analysis of P450SPα and P450BSβ
Electrostatic potentials were calculated using GRASP2 (49). Probe-occupied voids were calculated using VOIDOO (50), and a probe of 1.1 Å and a grid mesh of 0.3 Å were used unless otherwise specified. The accessible channels were calculated using CAVER (51). All of the protein figures were depicted using PyMOL (52).
Hydroxylation of Myristic Acid
The standard reaction mixture contained 0.1 m potassium phosphate (pH 7.0), 0–120 μm myristic acid (C14) (0–60 μm for F288G and A172F/F288G), 50 nm P450SPα or P450BSβ, and 200 μm H2O2 in a total volume of 1 ml. The reaction mixture was incubated at 37 °C for 1 min, and then the reaction was quenched by adding 500 μl of dichloromethane followed by vigorous mixing. After the addition of 12-hydroxydodecanoic acid as an internal standard, the products were extracted with dichloromethane. For derivatization of the extract, 50 μl of N,O-bis(trimethylsilyl)trifluoroacetamide (BSTFA) containing 1% (v/v) trimethylchlorosilane (TMCS) was added, and the mixture was incubated in the dark at room temperature for 2 h. The derivatized products were analyzed using a Shimadzu GC-17A (Shimadzu Corp., Kyoto, Japan) equipped with a Shimadzu GC/MS-QP5000 and RxiTM-5ms capillary column (30 m × 0.25 mm; Restek Corp., Bellefonte, PA) to identify the products. The GC/MS analytical conditions were as follows: column temperature, 50 °C (1 min) to 40 °C/min (5 min) to 250 °C (8 min); injection temperature, 250 °C; interface temperature, 280 °C; carrier gas, helium; flow rate, 0.9 ml/min, mode, split mode; and split ratio, 1/50. To quantify the products, derivatization of the extract was performed by adding 9-anthryldiazomethane and incubating the solution in the dark at room temperature for 1 h. For quantification of the products, reverse phase HPLC analysis was performed using an Inertsil® ODS-3 column (4.6 mm × 250 mm; GL Sciences, Inc., Tokyo, Japan) installed on a Shimadzu SCL-10AVP system controller equipped with Shimadzu LC-10ADVP pump systems, a Shimadzu RF-10AXL fluorescence spectrometer, a Shimadzu CTO-10AVP column oven, and a Shimadzu DGU-12A degasser. The HPLC analytical conditions were as follows: flow rate, 1.0 ml/min; acetonitrile/water = 99/1; column temperature, 30 °C; excitation wavelength, 365 nm, emission wavelength, 412 nm; and retention times, 12-hydroxydodecanoic acid (6.41 min), β-OH C14 (10.7 min), α-OH C14 (11.9 min), and C14 (21.5 min). Chiral separation of the products was performed on a CHIRALPAK AD-RH column (Daicel Chemical Industries, Ltd., Osaka, Japan) installed on the same reverse phase HPLC system as in the case of the quantification. The absolute configuration was assigned by comparison of the product ratios in the hydroxylation of C14 by P450SPα WT (53) and P450BSβ WT (54). The HPLC conditions for the chiral separation were as follows: flow rate, 0.9 ml/min; linear gradient, MeOH/water = 85/15 (0–10 min) to 100/0 (100–120 min); column temperature, 40 °C; excitation, 365 nm; emission, 412 nm; retention times, (R)-α-OH C14 (34.2 min), (S)-α-OH C14 (37.6 min), (S)-β-OH C14 (49.8 min), and (R)-β-OH C1 (53.2 min).
UV-visible and EPR Measurements
UV-visible spectra were recorded using a Shimadzu UV-2400 PC spectrophotometer at room temperature. X-band EPR spectra were recorded using an E500 X-band CW-EPR instrument (Bruker, Ettlingen, Germany) at 10 K. A cryostat (ITC503; Oxford Instruments Co., Abingdon, UK) was used for measurements at low temperatures.
RESULTS AND DISCUSSION
Overall Structure and Substrate Binding
The structure of P450SPα was resolved at a resolution of 1.65 Å (Fig. 1). One molecule was observed in the asymmetric unit. The overall structure exhibited typical P450 folding with 17 α helices and three β sheets. It has a trigonal prism-shaped structure with the heme buried deep inside the protein. The I helix lays across the interior of the P450 molecule on the distal side of the heme group. Two channels connecting the active site cavity with the protein surface were identified (Fig. 1). Channel I is composed of hydrophobic residues (Ile73, Leu77, Leu78, Phe169, Ala172, Ala245, Phe287, Phe288, Pro289, Leu398, and Pro399) (Fig. 2A). Channel II includes hydrophilic residues (Gln84 and Asn238) as its constituent residues. A cluster of water molecules with a hydrogen-bonding network was observed in Channel II (Fig. 2D). We expect that Channel II would be used for the ingress of H2O2 and the egress of water during the reaction. Phe288 is located at the border of the two channels, but the two channels are not clearly separated because the entrances of the channels are wide (Figs. 1, B and C, and 3A).
FIGURE 1.

Overall structure of P450SPα with palmitic acid. The B′ helix and F helix-loop-G helix are colored in blue and green, respectively. Heme (red) and palmitic acid (yellow and cyan) are represented as stick models. The Channel I (magenta) and Channel II (orange) locations were calculated using CAVER (51). Water molecules in Channel II are represented as red spheres. A, the distal face of P450SPα. B, surface model of P450SPα. C, two channels of P450SPα. Arg241 (orange) and Phe288 (purple) are labeled.
FIGURE 2.

The heme cavity of P450SPα. The 2Fo − Fc electron density maps of heme, palmitic acid, and a water molecule coordinated to the iron are contoured at the 1 σ level (blue mesh). The hydrophobic amino acid residues, heme, and Cys361 are represented as stick models. A water molecule coordinated to the iron is represented by a red sphere. The distance between the iron and water is shown in red. A, two alternative conformations of palmitic acid shown as yellow and cyan stick models. B, palmitic acid with 0.7 occupancy (Conformation A). C, palmitic acid with 0.3 occupancy (Conformation B). The interaction of Arg241 with the oxygen atoms of the carboxylate group of palmitic acid are shown as black dashed lines. The distance of the Cα carbon and the oxygen atoms of palmitic acid from the iron and are shown as red dashed lines and blue dashed lines, respectively. D, hydrogen bond network in Channel II of P450SPα. Heme (pink), palmitic acid (yellow and cyan), and hydrophilic residues and Val292 (orange) are represented as stick models. Water molecules are represented as red spheres. Hydrogen bonds are shown as dashed lines.
FIGURE 3.

The substrate access channel of P450SPα. A, the substrate access channel (Channel I) of P450SPα. Heme, palmitic acid, Arg241, and Phe288 are represented as stick models. B, B-factor of P450SPα.
Although no substrates were added to the purified P450SPα, the initial 2Fo − Fc electron density map showed a long continuous electron density in Channel I (Fig. 2A). One of the ends of this electron density, located near Arg241 in the active site, has a Y-shape. Because the shape of this electron density is very similar to that of a long alkyl chain fatty acid observed in P450BM3 (21) and P450BSβ (30), we assumed that this electron density corresponds to a long alkyl chain fatty acid originating from Escherichia coli cells (55). Indeed, GC/MS analysis of the extract of the purified P450SPα with dichloromethane showed that palmitic acid and stearic acid were coexistent, even after purification (supplemental Fig. S1). It was difficult to deduce the length of the alkyl chain of the fatty acid based on the electron density of the substrate(s) because the electron density of the substrate was shorter than the alkyl chain of palmitic acid, possibly because of disordering. Therefore, we tentatively assigned this electron density to palmitic acid. In addition, because the Y-shaped electron density adjacent to the Arg241 was accompanied by an additional electron density, two alternative conformations with occupancies of 0.7 (Conformation A) and 0.3 (Conformation B) were placed and refined (Fig. 2, B and C). The terminal alkyl chain of palmitic acid in the final structure is highly disordered, indicating that the terminal alkyl chain is loosely fixed. It is noteworthy that the A′-helix, B′-helix, and F–G loop have relatively high B-factors (Fig. 3B) and that the entrance of Channel I is open wide (Fig. 3A), suggesting that this region is flexible even though the substrate was accommodated. The substrate access channel and B-factor of P450BSβ are shown in supplemental Fig. S2 for comparison.
The charge distribution on the surfaces of the proximal and distal sides of P450SPα is shown in Fig. 4. In contrast to the charge distribution typical of P450s such as P450BM3 (56, 57), negative surface charges were observed on the proximal side of P450SPα. A positive surface potential on the proximal side of regular P450 is important for the recognition of reductases in the electron transfer step of oxygen activation in the P450 catalytic cycle (58). The negative surface potential on the proximal side of P450SPα may preclude binding of a reductase. This unique charge potential distribution of P450SPα is an indication that P450SPα does not need binding of a reductase and prefers the H2O2 shunt pathway. P450BSβ also has no positively charged region on the surface of the proximal side. In addition, a long loop structure was observed on the proximal side (349QGGGDHYLGHRC361) (Fig. 5), whereas P450s that require electron transfer from reductases have short loop structures. P450cam, for example, has a short loop structure, 350FGHGSHLC357. P450BSβ (352QGGGHAEKGHRC363) (30) and allene oxide synthase (455WSNGPETETPTVGNKQC472) (59) also have long loop structures at the proximal side of the heme, implying that the long loop structure is a common feature among P450s that do not require electron transfer systems for the activation of molecular oxygen.
FIGURE 4.

Electrostatic potential surface of P450SPα. Electrostatic surfaces of P450SPα were calculated using GRASP2 (49). The negatively charged surface is represented in red, and the positively charged surface is represented in blue. Palmitic acid is shown as a yellow stick model.
FIGURE 5.

The proximal side of the heme of P450SPα. A, the main chain composed of the loop at the proximal side of the heme is represented as a green stick model. Heme is shown as a pink stick model. The water molecule on the heme is represented as a red sphere. The distances between the heme iron and nitrogen atoms of the main chain from the sulfur atom of Cys361 are shown in blue. B, comparison of the amino acid sequence of P450SPα with other P450s. Conserved amino acid residues are depicted in bold type.
Active Site Structure
At the active site, Arg241 is located above the heme, and its guanidinium group interacts with the carboxylate group of palmitic acid (Fig. 2A); the distances between two oxygen atoms of the carboxylate group and the guanidinium group of Arg241 (Nη2 and Nϵ) are 2.9 and 3.0 Å in Conformation A (Fig. 2B) and 3.3 and 3.2 Å in Conformation B (Fig. 2C), respectively. In contrast to other heme enzymes that utilize H2O2, P450SPα lacks general acid-base residues around the distal side of the heme. As an alternative, the terminal carboxylate group of palmitic acid is located above the heme. The distance between the oxygen atoms close to the heme iron is 5.2 Å for Conformation A and 5.5 Å for Conformation B, indicating that the location of the oxygen atom is similar to that of the glutamic acid moiety of CPO (34, 35) and that of the terminal carboxylate group of palmitic acid observed in P450BSβ. These observations indicate that participation of the terminal carboxylate group of the fatty acid in the generation of active species using H2O2 (Scheme 1) is common among H2O2-dependent P450s. The distal side of the heme is hydrophilic because of Gln84, Asp238, Arg241, and the carboxylate group of palmitic acid (Fig. 2D). The polar environment is expected to facilitate the heterolytic cleavage of the O–O bond of H2O2 to generate compound I, as is proposed for heme peroxidases such as cytochrome c peroxidase (31, 32), HRP (33), CPO (34, 35), and myoglobin mutants (60, 61). A water molecule is located 2.1 Å away from the heme iron and could function as a sixth ligand on the heme even though the palmitic acid occupies the distal side of the heme cavity (Fig. 2A). The UV-visible spectra of P450SPα in the absence and presence of 120 μm of myristic acid showed a Soret absorption peak at 417 nm, which is consistent with a typical six-coordinate low-spin ferric heme (Fig. 6). The EPR spectrum of the substrate-free form of P450SPα showed a ferric low spin state having g value 2.59 (gz), 2.25 (gy), and 1.85 (gx) (Fig. 7), suggesting that the electronic environment of the heme iron of P450SPα resembles that of CPO (2.61 (gz), 2.26 (gy), 1.83 (gx), pH 5.2) (62) rather than those of bacterial P450s such as P450cam (2.45 (gz), 2.26 (gy), 1.91 (gx)) (63) and P450BM3 (2.42 (gz), 2.26 (gy), 1.92 (gx)) (64). The EPR spectral change of P450SPα upon addition of myristic acid (120 μm) was very small, indicating that the low spin state is essentially retained irrespective of substrate binding. Minor signals at g = 2.67 in the substrate free-form and at g = 2.53 in the myristic acid-bound form might reflect P420 species of P450SPα (supplemental Fig. S5), whereas signals are different from that of P420 species of P450cam (2.46 (gz)) (64).
FIGURE 6.
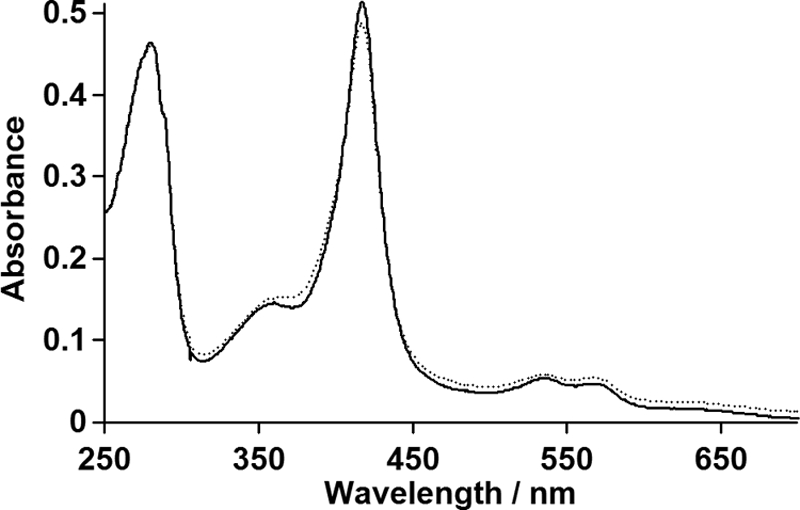
UV-visible absorption spectra of P450SPα. The spectra of P450SPα in 0.1 m potassium phosphate buffer (pH 7.0) containing 0.3 m KCl and 20% (v/v) glycerol in the absence (solid line) and presence of 120 μm of myristic acid (dotted line). The concentration of P450SPα was 3.1 μm.
FIGURE 7.

EPR spectra of P450SPα recorded at 10 K. The spectra of P450SPα in the absence (A) and presence of 120 μm of myristic acid (B) are shown. The concentrations of P450SPα were 44 and 24 μm for the substrate-free form and for the myristic acid-bound form, respectively.
Regioselectivity for Hydroxylation of Fatty Acid
P450SPα exclusively catalyzes the hydroxylation of fatty acid at the Cα position and produces the corresponding α-hydroxy fatty acid, whereas P450BSβ produces α and β hydroxy products in the ratio of 43:57. In the crystal structure of P450SPα, the distances of the Cα carbon and the Cβ carbon in Conformation B from the heme iron are 4.5 and 5.5 Å, respectively. Because the Cα carbon in Conformation B is clearly close to the iron atom, and the distance of 4.5 Å agrees well with the distance between the C5 position of d-camphor and the heme iron in P450cam (65), Conformation B is expected to produce the α-hydroxy fatty acid selectively. Because the Cα and Cβ carbons in Conformation A are both far away from the heme iron in respect of the hydroxylation reaction, we assume that Conformation A is a nonproductive conformation. In the crystal structure of P450BSβ, the Cα and Cβ carbons of palmitic acid are located at distances of 5.0 and 6.2 Å from the heme iron, respectively. The substrate observed in P450BSβ needs to be closer to the heme iron to be hydroxylated, as was observed for P450BM3 (66). The Cα and Cβ carbons of the possible productive conformation of palmitic acid in P450BSβ may be equally close to the heme iron.
Structural Comparison of P450SPα with P450BSβ
To gain further insight into H2O2-dependent P450s, the structure of P450SPα was compared with that of P450BSβ. The structure of P450SPα is superimposed on that of P450BSβ in Fig. 8. Except for the B′ helix and the F–G loop, the overall structures are well superposed with a root mean square deviation value of 1.4 Å. The locations of Channel I are notably different, resulting in different locations for the bound palmitic acid. The palmitic acid is more perpendicular to the heme plane in P450SPα than in P450BSβ. The active site cavity of P450SPα is smaller than that of P450BSβ (supplemental Fig. S3). The smaller active site cavity is mainly due to the presence of Phe288 in the heme cavity of P450SPα. The corresponding amino acid residue in P450BSβ is Gly290. The effect of Phe288 and the location of Channel I are discussed in the next section.
FIGURE 8.

Overall structure of P450SPα superposed on that of P450BSβ. A, the superposition of the structures. The structures of P450SPα and P450BSβ are represented in green and blue, respectively. Heme is depicted as a red stick model. Palmitic acids in P450SPα and P450BSβ are represented as a yellow and cyan stick models and a pink stick model, respectively. B and C, substrate access channel location of P450SPα (B) and P450BSβ (C) calculated using CAVER (51) are shown as a light blue surface for P450SPα and a cyan surface for P450BSβ.
Hydroxylation of Myristic Acid by Mutants
We carried out mutagenesis study to elucidate the structural requirement for the α-selective reaction of P450SPα. Based on the comparison between amino acid residues in the active sites of P450SPα and P450BSβ, two amino acid residues in the active site of P450SPα, Phe288 and Leu78, were mutated to the corresponding P450BSβ residues and vice versa. The active site cavity of P450SPα is smaller than that of P450BSβ, mainly because of the side chain of Phe288 (supplemental Fig. S3), which interacts directly with the fatty acid. Although Leu78 does not interact with the fatty acid, it is located at the border of the channels and may affect the catalytic reaction. Three mutants of P450SPα, L78F, F288G, and L78F/F288G, and three P450BSβ mutants, F79L, G290F, and F79L/G290F, were prepared and their catalytic activities, regioselectivities, and stereoselectivities were examined (Table 2). P450BSβ mutants F79L and G290F had 75 and 95% α selectivity, respectively, indicating that the regioselectivity of P450BSβ was greatly altered. The substitution of Gly290 with Phe must induce a conformational change in myristic acid, and the Cα carbon is expected to move closer than the Cβ carbon to the heme iron. In sharp contrast with the P450BSβ mutants, no clear differences in regioselectivity were observed for P450SPα mutants, whereas the amino acids at the active site were replaced with the corresponding amino acids of P450BSβ, which has β-regioselectivity. Three mutants of P450SPα showed >99% α selectivity. To further investigate the regioselectivity of P450SPα, two mutants of P450SPα, A172F and A172F/F288G, were prepared. Ala172 located in the F–G loop seems to be important for controlling fatty acid conformation. However, the regioselectivity was not affected by these mutagenesis experiments, indicating that the mutagenesis at the active site and at the F–G loop does not alter the position of bound palmitic acid. The x-ray crystal structures of the L78F and F288G mutants revealed that there is little difference in the location of the bound palmitic acid in Conformation B (the productive conformation) and the location of the hydrophilic channel (Fig. 9), whereas the position of the amino acids located near the active site, Met69, Pro70, and Pro289, are shifted (Fig. 10 and supplemental Fig. S4). The Cα positions of palmitic acid in both mutants are essentially the same as in the WT. Whereas the stereoselectivity of α hydroxylation of myristic acid was slightly reduced by mutagenesis (Table 2), the regioselectivity of P450SPα was not affected, suggesting that the small perturbation induced by the mutagenesis is insufficient to alter the high regioselectivity of P450SPα. We presume that the regioselectivity of P450SPα is highly controlled by its hydrophobic channel. The orientation of the channel (almost perpendicular to the heme plane) and the wide open entrance appear to be crucial for the high α-selectivity of hydroxylation. The hydrophobic channel may control the direction of the fatty acid access. Further mutagenesis studies, especially at the F and G helices and at the F–G loop region, are necessary for elucidating the mechanistic details of the highly selective α-hydroxylation of fatty acid catalyzed by P450SPα.
TABLE 2.
Hydroxylation of myristic acid by P450SPα and P450BSβ
| Enzyme | kcat | Km | Regioselectivity | Stereoselectivity |
|
|---|---|---|---|---|---|
| At α-position (R):(S) | At β-position (R):(S) | ||||
| nmol/min/nmol P450 | μm | α-OH % | |||
| P450SPαWT | 1300 ± 20 | 43 ± 2 | >99 | 3:97 | |
| P450SPαL78F | 5500 ± 930 | 300 ± 70 | >99 | 4:96 | |
| P450SPαF288G | 770 ± 70 | 100 ± 20 | >99 | 19:81 | |
| P450SPαL78F/F288G | 1300 ± 40 | 85 ± 16 | >99 | 21:79 | |
| P450SPαA172F | 1200 ± 20 | 68 ± 3 | >99 | 3:97 | |
| P450SPαA172F/F288G | 100 ± 2 | 23 ± 2 | >99 | 17:83 | |
| P450BSβWT | 1400 ± 180 | 66 ± 20 | 43 | 76:24 | 98:2 |
| P450BSβF79L | 1400 ± 30 | 54 ± 3 | 75 | 62:38 | 99:1 |
| P450BSβG290F | 1900 ± 210 | 190 ± 30 | 95 | 29:71 | 85:15 |
| P450BSβF79L/G290F | 890 ± 20 | 95 ± 3 | 77 | 28:72 | 86:14 |
FIGURE 9.

The active site structures of P450SPα L78F (A) and F288G (B). Palmitic acid, heme, Arg241, Phe78 or Leu78, Phe288 or Gly288, and MPD are represented as stick models. A water molecule coordinated to the iron is represented as a sphere. The 2Fo − Fc electron density maps of palmitic acid, Phe78 or Leu78, Phe288 or Gly288, and MPD are contoured at the 1 σ level (blue mesh). The position of Phe288 in the WT is occupied by MPD in F288G. In both structures, palmitic acid with 0.7 occupancy and 0.3 occupancy are colored yellow and cyan, respectively.
FIGURE 10.

Comparison of WT (green), L78F (cyan), and F288G (purple). Superimposition of two mutants and WT P450SPα. Side view from the opposite side of the propionate of the heme. Heme is represented as a line. MPD in F288G is represented as a blue stick model. Root mean square deviation values over 9–415 amino acid residues of Cα atoms are 0.225 for L78F and 0.197 for F288G, respectively.
Conclusion
We have determined the x-ray crystal structure of H2O2-dependent P450SPα as a palmitic acid-bound form at a resolution of 1.65 Å. The crystal structure revealed that the carboxylate group of the fatty acid interacts with Arg241, which is located above the heme. Previous studies on the reaction mechanism of P450BSβ suggested that the carboxylate group of the fatty acid serves as a general acid-base catalyst for the generation of compound I using H2O2. Our crystal structure study confirms that this substrate-assisted activation mechanism is also conserved in P450SPα, indicating that the substrate-assisted activation mechanism is common in the H2O2-dependent P450-catalyzed hydroxylation reaction with fatty acids. Notably, a water molecule was observed as the sixth ligand of the heme iron, even in the presence of palmitic acid. Consistent with the crystal structure, the ferric low spin state of P450SPα was retained irrespective of the substrate binding. These results also indicate that the shift in redox potential of the heme that is induced by substrate binding, which is generally indispensable for the reductive activation of molecular oxygen, is not essential for the H2O2-dependent P450s. Crystallographic studies on substrate binding revealed that the Cα carbon of the bound palmitic acid in Conformation B is situated close to the heme iron (4.5 Å). This conformation explains the highly selective α-hydroxylation of fatty acid. Surprisingly, mutations at the active site and at the F–G loop of P450SPα did not impair the high regioselectivity. The crystal structures of the L78F and F288G mutants revealed that the location of the bound palmitic acid was not affected by these mutations. These results imply that the orientation of the hydrophobic channel of P450SPα, which is more perpendicular to the heme plane than that of P450BSβ, is crucial for the highly selective α-hydroxylation. Although further mutagenesis studies are required to fully understand the high regioselectivity of P450SPα, the structural studies reported here contribute to a better understanding of the relationship between the structure and function of H2O2-dependent P450s at the atomic level.
Supplementary Material
Acknowledgments
We thank Dr. Go Ueno, Dr. Hironori Murakami, Dr. Masatomo Makino, and Dr. Nobuyuki Shimizu for assistance with the data collection at SPring-8. We thank Dr. Isamu Matsunaga for the kind gift of the expression system of P450SPα.
This work was supported by Grant-in-Aid for Scientific Research (S) 19105044 (to Y. W.), Grant-in-Aid for Scientific Research on Innovative Areas 22105012 (to Y. S.), and Grant-in-Aid for Young Scientists (A) 21685018 (to O. S.) from the Ministry of Education, Culture, Sports, Science, and Technology (Japan).

The on-line version of this article (available at http://www.jbc.org) contains supplemental text, references, and Figs. S1–S5.
The atomic coordinates and structure factors (codes 3AWM, 3AWQ, and 3AWP) have been deposited in the Protein Data Bank, Research Collaboratory for Structural Bioinformatics, Rutgers University, New Brunswick, NJ (http://www.rcsb.org/).
- P450
- cytochrome P450
- P450SPα
- cytochrome P450 isolated from S. paucimobilis (CYP152B1)
- P450BSβ
- cytochrome P450 isolated from Bacillus subtilis (CYP152A1)
- P450BM3
- cytochrome P450 isolated from Bacillus megaterium (CYP102A1)
- P450cam
- cytochrome P450 isolated from Pseudomonas putida (CYP101A1)
- MPD
- (±)-2-methyl-2,4-pentanediol
- MES
- 2-(N-morpholino)ethanesulfonic acid
- β-OH C14
- β-hydroxymyristic acid
- α-OH C14
- α-hydroxymyristic acid
- C14
- myristic acid
- CPO
- chloroperoxidase.
REFERENCES
- 1. Ortiz de Montellano P. R. (2005) Cytochrome P450: Structure, Mechanism, and Biochemistry, 3rd, ed., Plenum, New York [Google Scholar]
- 2. Guengerich F. P. (2008) Chem. Res. Toxicol. 21, 70–83 [DOI] [PubMed] [Google Scholar]
- 3. Denisov I. G., Makris T. M., Sligar S. G., Schlichting I. (2005) Chem. Rev. 105, 2253–2277 [DOI] [PubMed] [Google Scholar]
- 4. Sono M., Roach M. P., Coulter E. D., Dawson J. H. (1996) Chem. Rev. 96, 2841–2888 [DOI] [PubMed] [Google Scholar]
- 5. Poulos T. L., Finzel B. C., Gunsalus I. C., Wagner G. C., Kraut J. (1985) J. Biol. Chem. 260, 16122–16130 [PubMed] [Google Scholar]
- 6. Williams P. A., Cosme J., Sridhar V., Johnson E. F., McRee D. E. (2000) Mol. Cell 5, 121–131 [DOI] [PubMed] [Google Scholar]
- 7. Williams P. A., Cosme J., Ward A., Angove H. C., Matak Vinković D., Jhoti H. (2003) Nature 424, 464–468 [DOI] [PubMed] [Google Scholar]
- 8. Williams P. A., Cosme J., Vinkovic D. M., Ward A., Angove H. C., Day P. J., Vonrhein C., Tickle I. J., Jhoti H. (2004) Science 305, 683–686 [DOI] [PubMed] [Google Scholar]
- 9. Wester M. R., Yano J. K., Schoch G. A., Yang C., Griffin K. J., Stout C. D., Johnson E. F. (2004) J. Biol. Chem. 279, 35630–35637 [DOI] [PubMed] [Google Scholar]
- 10. Yano J. K., Hsu M. H., Griffin K. J., Stout C. D., Johnson E. F. (2005) Nat. Struct. Mol. Biol. 12, 822–823 [DOI] [PubMed] [Google Scholar]
- 11. Mast N., White M. A., Bjorkhem I., Johnson E. F., Stout C. D., Pikuleva I. A. (2008) Proc. Natl. Acad. Sci. U.S.A. 105, 9546–9551 [DOI] [PMC free article] [PubMed] [Google Scholar]
- 12. Scott E. E., He Y. A., Wester M. R., White M. A., Chin C. C., Halpert J. R., Johnson E. F., Stout C. D. (2003) Proc. Natl. Acad. Sci. U.S.A. 100, 13196–13201 [DOI] [PMC free article] [PubMed] [Google Scholar]
- 13. Scott E. E., White M. A., He Y. A., Johnson E. F., Stout C. D., Halpert J. R. (2004) J. Biol. Chem. 279, 27294–27301 [DOI] [PubMed] [Google Scholar]
- 14. Porubsky P. R., Meneely K. M., Scott E. E. (2008) J. Biol. Chem. 283, 33698–33707 [DOI] [PMC free article] [PubMed] [Google Scholar]
- 15. Yano J. K., Koo L. S., Schuller D. J., Li H., Ortiz de Montellano P. R., Poulos T. L. (2000) J. Biol. Chem. 275, 31086–31092 [DOI] [PubMed] [Google Scholar]
- 16. Park S. Y., Yamane K., Adachi S., Shiro Y., Weiss K. E., Maves S. A., Sligar S. G. (2002) J. Inorg. Biochem. 91, 491–501 [DOI] [PubMed] [Google Scholar]
- 17. Oku Y., Ohtaki A., Kamitori S., Nakamura N., Yohda M., Ohno H., Kawarabayasi Y. (2004) J. Inorg. Biochem. 98, 1194–1199 [DOI] [PubMed] [Google Scholar]
- 18. Poulos T. L., Finzel B. C., Howard A. J. (1987) J. Mol. Biol. 195, 687–700 [DOI] [PubMed] [Google Scholar]
- 19. Lee Y. T., Wilson R. F., Rupniewski I., Goodin D. B. (2010) Biochemistry 49, 3412–3419 [DOI] [PMC free article] [PubMed] [Google Scholar]
- 20. Ravichandran K. G., Boddupalli S. S., Hasermann C. A., Peterson J. A., Deisenhofer J. (1993) Science 261, 731–736 [DOI] [PubMed] [Google Scholar]
- 21. Li H., Poulos T. L. (1997) Nat. Struct. Biol. 4, 140–146 [DOI] [PubMed] [Google Scholar]
- 22. Hasemann C. A., Ravichandran K. G., Peterson J. A., Deisenhofer J. (1994) J. Mol. Biol. 236, 1169–1185 [DOI] [PubMed] [Google Scholar]
- 23. Cupp-Vickery J. R., Poulos T. L. (1995) Nat. Struct. Biol. 2, 144–153 [DOI] [PubMed] [Google Scholar]
- 24. Leys D., Mowat C. G., McLean K. J., Richmond A., Chapman S. K., Walkinshaw M. D., Munro A. W. (2003) J. Biol. Chem. 278, 5141–5147 [DOI] [PubMed] [Google Scholar]
- 25. McLean K. J., Lafite P., Levy C., Cheesman M. R., Mast N., Pikuleva I. A., Leys D., Munro A. W. (2009) J. Biol. Chem. 284, 35524–35533 [DOI] [PMC free article] [PubMed] [Google Scholar]
- 26. Podust L. M., Poulos T. L., Waterman M. R. (2001) Proc. Natl. Acad. Sci. U.S.A. 98, 3068–3073 [DOI] [PMC free article] [PubMed] [Google Scholar]
- 27. Makino M., Sugimoto H., Shiro Y., Asamizu S., Onaka H., Nagano S. (2007) Proc. Natl. Acad. Sci. U.S.A. 104, 11591–11596 [DOI] [PMC free article] [PubMed] [Google Scholar]
- 28. Matsunaga I., Kusunose E., Yano I., Ichihara K. (1994) Biochem. Biophys. Res. Commun. 201, 1554–1560 [DOI] [PubMed] [Google Scholar]
- 29. Matsunaga I., Yamada M., Kusunose E., Nishiuchi Y., Yano I., Ichihara K. (1996) FEBS Lett. 386, 252–254 [DOI] [PubMed] [Google Scholar]
- 30. Lee D. S., Yamada A., Sugimoto H., Matsunaga I., Ogura H., Ichihara K., Adachi S., Park S. Y., Shiro Y. (2003) J. Biol. Chem. 278, 9761–9767 [DOI] [PubMed] [Google Scholar]
- 31. Poulos T. L., Kraut J. (1980) J. Biol. Chem. 255, 8199–8205 [PubMed] [Google Scholar]
- 32. Wang J. M., Mauro M., Edwards S. L., Oatley S. J., Fishel L. A., Ashford V. A., Xuong N. H., Kraut J. (1990) Biochemistry 29, 7160–7173 [DOI] [PubMed] [Google Scholar]
- 33. Gajhede M., Schuller D. J., Henriksen A., Smith A. T., Poulos T. L. (1997) Nat. Struct. Biol. 4, 1032–1038 [DOI] [PubMed] [Google Scholar]
- 34. Sundaramoorthy M., Terner J., Poulos T. L. (1995) Structure 3, 1367–1377 [DOI] [PubMed] [Google Scholar]
- 35. Sundaramoorthy M., Terner J., Poulos T. L. (1998) Chem. Biol. 5, 461–473 [DOI] [PubMed] [Google Scholar]
- 36. Shoji O., Fujishiro T., Nakajima H., Kim M., Nagano S., Shiro Y., Watanabe Y. (2007) Angew. Chem. Int. Ed. Engl. 46, 3656–3659 [DOI] [PubMed] [Google Scholar]
- 37. Shoji O., Fujishiro T., Nagano S., Tanaka S., Hirose T., Shiro Y., Watanabe Y. (2010) J. Biol. Inorg. Chem. 15, 1331–1339 [DOI] [PubMed] [Google Scholar]
- 38. Otwinowski Z., Borek D., Majewski W., Minor W. (2003) Acta Crystallogr. A 59, 228–234 [DOI] [PubMed] [Google Scholar]
- 39. Sheldrick G. M. (2008) Acta Crystallogr. A 64, 112–122 [DOI] [PubMed] [Google Scholar]
- 40. Pape T., Schneider T. R. (2004) J. Appl. Crystallogr. 37, 843–844 [Google Scholar]
- 41. Morris R. J., Zwart P. H., Cohen S., Fernandez F. J., Kakaris M., Kirillova O., Vonrhein C., Perrakis A., Lamzin V. S. (2004) J. Synchrotron Radiat. 11, 56–59 [DOI] [PubMed] [Google Scholar]
- 42. Emsley P., Cowtan K. (2004) Acta Crystallogr. D Biol. Crystallogr. 60, 2126–2132 [DOI] [PubMed] [Google Scholar]
- 43. Brünger A. T., Adams P. D., Clore G. M., DeLano W. L., Gros P., Grosse-Kunstleve R. W., Jiang J. S., Kuszewski J., Nilges M., Pannu N. S., Read R. J., Rice L. M., Simonson T., Warren G. L. (1998) Acta Crystallogr. D Biol. Crystallogr. 54, 905–921 [DOI] [PubMed] [Google Scholar]
- 44. Winn M. D., Murshudov G. N., Papiz M. Z. (2003) Methods Enzymol. 374, 300–321 [DOI] [PubMed] [Google Scholar]
- 45. Winn M. D., Isupov M. N., Murshudov G. N. (2001) Acta Crystallogr. D Biol. Crystallogr. 57, 122–133 [DOI] [PubMed] [Google Scholar]
- 46. Vriend G. (1990) J. Mol. Graph. 8, 52–56 [DOI] [PubMed] [Google Scholar]
- 47. Lakowski R., A., MacArthur M. W., Moss D. S., Thornton J. M. (1993) J. Appl. Crystallogr. 26, 283–291 [Google Scholar]
- 48. Vagin A., Teplyakov A. (1997) J. Appl. Crystallogr. 30, 1022–1025 [Google Scholar]
- 49. Petrey D., Honig B. (2003) Methods Enzymol. 374, 492–509 [DOI] [PubMed] [Google Scholar]
- 50. Kleywegt G. J., Jones T. A. (1994) Acta Crystallogr. Sect. D 50, 178–185 [DOI] [PubMed] [Google Scholar]
- 51. Petrek M., Otyepka M., Banás P., Kosinová P., Koca J., Damborský J. (2006) BMC Bioinformatics 7, 316–325 [DOI] [PMC free article] [PubMed] [Google Scholar]
- 52. DeLano W. L. (2002) The PyMOL Moleular Graphics System on World Wide Web, DeLano Scientific, San Carlos, CA [Google Scholar]
- 53. Matsunaga I., Ueda A., Sumimoto T., Ichihara K., Ayata M., Ogura H. (2001) Arch. Biochem. Biophys. 394, 45–53 [DOI] [PubMed] [Google Scholar]
- 54. Matsunaga I., Sumimoto T., Ueda A., Kusunose E., Ichihara K. (2000) Lipids 35, 365–371 [DOI] [PubMed] [Google Scholar]
- 55. Allen E. E., Bartlett D. H. (2000) J. Bacteriol. 182, 1264–1271 [DOI] [PMC free article] [PubMed] [Google Scholar]
- 56. Sevrioukova I. F., Li H., Zhang H., Peterson J. A., Poulos T. L. (1999) Proc. Natl. Acad. Sci. U.S.A. 96, 1863–1868 [DOI] [PMC free article] [PubMed] [Google Scholar]
- 57. Yano J. K., Blasco F., Li H., Schmid R. D., Henne A., Poulos T. L. (2003) J. Biol. Chem. 278, 608–616 [DOI] [PubMed] [Google Scholar]
- 58. Nagano S., Tosha T., Ishimori K., Morishima I., Poulos T. L. (2004) J. Biol. Chem. 279, 42844–42849 [DOI] [PubMed] [Google Scholar]
- 59. Lee D. S., Nioche P., Hamberg M., Raman C. S. (2008) Nature 455, 363–368 [DOI] [PubMed] [Google Scholar]
- 60. Ozaki S., Matsui T., Watanabe Y. (1997) J. Am. Chem. Soc. 119, 6666–6667 [Google Scholar]
- 61. Matsui T., Ozaki S., Watanabe Y. (1999) J. Am. Chem. Soc. 121, 9952–9957 [Google Scholar]
- 62. Hollenberg P. F., Hager L. P., Blumberg W. E., Peisach J. (1980) J. Biol. Chem. 255, 4801–4807 [PubMed] [Google Scholar]
- 63. Lipscomb J. D. (1980) Biochemistry 19, 3590–3599 [DOI] [PubMed] [Google Scholar]
- 64. Miles J. S., Munro A. W., Rospendowski B. N., Smith W. E., McKnight J., Thomson A. J. (1992) Biochem. J. 288, 503–509 [DOI] [PMC free article] [PubMed] [Google Scholar]
- 65. Li H. Y., Narasimhulu S., Havran L. M., Winkler J. D., Poulos T. L. (1995) J. Am. Chem. Soc. 117, 6297–6299 [Google Scholar]
- 66. Modi S., Sutcliffe M. J., Primrose W. U., Lian L. Y., Roberts G. C. K. (1996) Nat. Struct. Biol. 3, 414–417 [DOI] [PubMed] [Google Scholar]
Associated Data
This section collects any data citations, data availability statements, or supplementary materials included in this article.