

Abstract
Objective
Adapting movements to a visual rotation involves the activation of right posterior parietal areas. Further performance improvement requires an increase of slow wave activity in subsequent sleep in the same areas. Here we ascertained whether a post-learning trace is present in wake EEG and whether such a trace is influenced by sleep slow waves.
Methods
In two separate sessions, we recorded high-density EEG in 17 healthy subjects before and after a visuomotor rotation task, which was performed both before and after sleep. High-density EEG was recorded also during sleep. One session aimed to suppressed sleep slow waves, while the other session served as a control.
Results
After learning, we found a trace in the eyes-open wake EEG as a local, parietal decrease in alpha power. After the control night, this trace returned to baseline levels, but it failed to do so after slow wave deprivation. The overnight change of the trace correlated with the dissipation of low frequency (< 8Hz) NREM sleep activity only in the control session.
Conclusions
Visuomotor learning leaves a trace in the wake EEG alpha power that appears to be renormalized by sleep slow waves.
Significance
These findings link visuomotor learning to regional changes in wake EEG and sleep homeostasis.
Keywords: sleep homeostasis, synaptic plasticity, slow wave deprivation, visual motor learning, alpha, slow wave
1. Introduction
A growing number of studies shows that learning leads to plastic changes in specific cortical areas that can be detected using electrophysiological, molecular, and imaging approaches (for reviews see Feldman, 2009; Pascual-Leone et al., 2005). For example, learning sequences of finger movements leads to an immediate increase in the cortical representation of the task, as measured by transcranial magnetic stimulation (TMS), and this increase parallels changes in performance (Pascual-Leone et al., 1995). Similarly, learning a visual texture discrimination task leads to a sustained increase in brain activity for up to 24 hours, as measured with fMRI in the corresponding area of visual cortex, a change that is also associated with improvement in performance (Schwartz et al., 2002; Pourtois et al., 2008).
In previous studies, we have found that when subjects learn to adapt their movements to a rotated display, circumscribed regions in the right parietal cortex are activated (Ghilardi et al., 2000) and, after learning, a local increase in non-rapid eye movement (NREM) sleep slow wave activity (SWA, EEG power density between 0.5 and 4.5 Hz) occurs in these same areas (Huber et al., 2004). We have also found that performance in this task is not enhanced by an equivalent period of wake (Huber et al., 2004); furthermore, it is prevented by the suppression of sleep slow waves (Landsness et al., 2009).
Altogether, these findings suggest that visuomotor learning occurring during wake leads to plastic changes that are reflected specifically in the local sleep EEG of the right parietal cortex, with important functional implications. But does the wake EEG in the right parietal cortex immediately after training reflect these plastic changes? If so, does this wake EEG trace remain stable or does it change over time? Also, given the sleep-dependent nature of the task, does sleep modify this trace?
To address these questions, we recorded eyes-open wake high-density EEG (hdEEG) before and after a visuomotor learning task (Huber et al., 2004), both prior to and following a night of sleep. We also used auditory tones to manipulate NREM slow waves, reasoning that because sleep slow waves are necessary for the post-sleep improvement in this task, they might also be required in order to obtain an overnight change in the wake EEG trace associated with learning. We hypothesized that 1) visuomotor learning, which leads to changes in the right parietal region, would leave a trace in the resting, eyes-open wake EEG in the same area, and 2) a night rich in slow waves, but not a night of slow wave deprivation (SWD) would renormalize that trace, thus bringing the EEG signal to baseline pre-learning values.
2. Methods
2.1. Design of the experiment
Seventeen healthy, medication free, right-handed subjects participated in this study (6 women, mean age ± SE: 24.3 ± 0.9 years). A polysomnography screening night ruled out any potential sleep disorders. A minimum sleep efficiency of 80% was required for continued participation in the study. All subjects were instructed to maintain a normal sleep schedule (11:00 pm to 7:00 am) for the week prior to the study and compliance was verified with actigraphy (Phillips-Respironics, Bend, OR) and sleep diaries. In addition, they were asked to limit the use of caffeinated or alcoholic beverages to no more than 1 drink per day and none after 2 pm.
The study consisted of two experimental conditions, which occurred in two separate sessions in randomized order at an interval of at least one week: control acoustic stimulation (CAS) and slow wave deprivation (SWD). In both sessions, subjects arrived in the laboratory between 7 PM and 8 PM, were outfitted with a hdEEG net (256 electrode nets, Electrical Geodesics, Eugene, OR), performed a motor task (see below) and then slept in the laboratory (lights out at 11:35PM ± 11 min, lights on at 6:53AM ± 11 min). The next morning, subjects were retested on the same task at least 30 min after waking up to avoid the potential confounds of sleep inertia. Prior to and immediately after performing the task, spontaneous, eyes-open EEG was collected.
The study was approved by the Institutional Review Board (IRB) of the participating institutions, and all subjects signed an IRB-approved informed consent form.
2.2. Waking EEG data
In each session, spontaneous waking EEG was collected (500 Hz sampling rate, vertex referenced) at three time points during the study: before and after the initial training and after a night of sleep before the retention test. During data collection, subjects were comfortably seated and instructed to relax with their eyes open and to fixate for 2 minutes on a target 2 meters away, in order to minimize eye blinks, eye movements and other movement artifacts. As described in a previous study (Hulse et al., 2011), spontaneous wake EEG data were processed offline in NetStation (Electrical Geodesics), and MATLAB (Mathworks, Natick, MA) including the MATLAB plugin EEGLAB (Delorme & Makeig, 2004). Data were filtered with a 0.6 Hz 1st order highpass filter, followed by a 59 Hz lowpass FIR Kaiser filter with stopband gain set to 0.1, passband gain to 99.9 and the rolloff set to 0.3 Hz. To detect bad channels, an automatic outlier detection tool, based on amplitude threshold criteria, was used followed by visual inspection of the data. Rejected channels were then interpolated via spherical splines. Independent Component Analysis (ICA), as implemented in EEGLAB (Delorme & Makeig, 2004), was used to remove ocular, muscle and EKG artifacts. Only ICA components with specific activity patterns and component maps characteristic of artifactual activity (Jung et al., 2000; Makeig et al., 1997) were removed. Any remaining artifacts were excluded by visual inspection. All artifact-free segments were average-referenced and power spectra were calculated for 4-sec epochs (Welch’s averaged modified periodgram with a Hamming window), resulting in a frequency resolution of 0.25 Hz. Similarly to previous studies (Tinguely et al., 2006), frequency bins below 0.75 Hz were excluded from data analysis because of their sensitivity to low-frequency artifacts. Spectral data were analyzed up to 30 Hz. To account for differences in broadband power across conditions in the wake EEG, the spectral data in each channel were normalized by its total cumulative power (area under the curve) up to 30 Hz. Local topographic changes in specific frequency bands between conditions were analyzed for each subject by dividing the EEG power values in each channel by the average power calculated across all channels in that specific frequency band.
Due to individual differences in the frequency bin associated with the maximum power within the alpha range, the individual alpha frequency (IAF) was identified in each subject following the guidelines described by Klimesch et al. (1996) using a bandwidth of +/− 1.5 Hz from the peak alpha frequency. Mean IAF peak was 10.35 ± 0.24 Hz.
2.3. Motor Task
This study employed a well-characterized reaching task (Ghilardi et al., 2000; Huber et al., 2004; Landsness et al., 2009; Moisello et al., 2009; Maatta et al., 2010) in which eight radially-arranged targets were displayed on a computer screen with a central starting point (distance: 4 cm) and the cursor position. Targets were highlighted with a constant time interval of 1 s. Subjects were asked to move as soon and as fast as possible with their right hand on a digitizing tablet to the highlighted target. Unbeknownst to them, the cursor movement on the screen was rotated relative to the hand position either clockwise (CW) or counterclockwise (CCW) by a total of 60° in four incremental steps of 15º. Each step consisted of 270 movements, with a one-minute break every 90 movements to prevent fatigue. The degree of adaptation achieved was assessed in a separate block (test block, 270 movements); retention was tested the following morning in the same way (re-test block). Since the learning of a CW rotation does not transfer to the CCW rotation learning (Krakauer et al., 2005), CW and CCW rotation were randomized across CAS and SWD conditions, thus allowing for intra-subject comparisons. As previously described, for each movement we computed several parameters, including the directional error at peak velocity, reaction time, movement time, peak velocity and peak acceleration (Ghilardi et al., 2000; Moisello et al., 2009). Adaptation in the training session and post-sleep improvement were computed using the directional error at the peak velocity in the test and re-test blocks and expressed as: 100 – [(60- mean directional error)/60]*100. Post-sleep improvement was computed as the difference between the test and re-test block.
2.4. Slow Wave Deprivation and Control Acoustic Stimulation
Sleep recordings were performed in both SWD and CAS conditions. SWD was designed to selectively suppress slow waves using acoustic tones without awakening the subjects (Ferrara et al., 2002). This method has been shown to selectively reduce SWA by 30–40% without affecting other polysomnographic variables, including total sleep time (Landsness et al., 2009; Landsness et al., 2011). In CAS, a similar number of tones was administered during NREM sleep, but only when the EEG did not show slow waves, to rule out any nonspecific effects of auditory stimulation during sleep. When CAS preceded SWD, approximately 450 tones were delivered during the entire night, a number based upon previous experience (Landsness et al., 2009). Overall, the number of tones played was 418 ± 44 in SWD and 429 ± 45 in CAS. As in previous reports (Huber et al., 2004, Landsness et al., 2009), we also assessed sleep parameters during a night of undisturbed sleep that served as baseline (SB) for comparison with SWD and CAS conditions.
2.5. Sleep scoring
All sleep was scored in 30-sec epochs by a sleep technologist blinded to the experimental condition, according to the American Academy of Sleep Medicine (AASM) guidelines (Iber et al., 2007). For scoring purposes mastoid referenced EEG from F1, F2, C3, C4, O1 and O2 were band-passed filtered between 0.6 and 35 Hz (two-way least-squares FIR). Submental electromyogram (EMG) recordings were band-passed filtered between 20 and 40 Hz, while electrooculogram (EOG) recordings were band-pass filtered between 0.5 and 40 Hz.
2.6. Sleep Analysis
The specifications for sampling and filtering the all-night hdEEG recordings, as well as for artifact rejection and spectral analysis, have been previously reported (Landsness et al., 2009). As previously described (Huber et al., 2004; Landsness et al., 2009), a region-of-interest (ROI) approach was used to identify within the right parietal region the channel showing the “peak” increase in SWA for the CAS condition relative to the SB condition. This channel was then used for all wake and correlational analyses. To calculate the homeostatic change in NREM sleep power across the night, the average power in the last 20% of artifact-free NREM sleep epochs was subtracted from the first 20% of artifact-free NREM sleep epochs for each individual subject. This change in NREM sleep power across the night was calculated for each frequency bin and then correlated to the overnight change in IAF power. Due to the multiple correlations performed across all frequency bands, a smoothing function that required 3 or more contiguous frequency bins to be significant was applied to prevent spurious correlations.
Due to technical problems, the sleep hdEEG data from one subject were lost. In addition, two subjects failed to follow instruction during the motor task. Therefore, here we report the results for 14 subjects.
2.7. Statistical Analyses
To assess changes in sleep parameters between CAS and SWD, repeated-measure analyses of variance (ANOVA) with post-hoc t-tests (Bonferroni corrected) were used. SWA for the peak channel over right parietal cortex in CAS and SWD was expressed as a percent of the SB condition when plotted versus behavioral measures. Behavioral measures in CAS and SWD, as well as changes in waking IAF power across sleep and learning, were compared using paired t-tests. To correct for multiple comparisons, statistical non- parametric mapping (SnPM) tests were used (Nichols and Holmes, 2002).
3. Results
3.1. Visuomotor learning increases right parietal sleep SWA, whereas SWD abolishes post-sleep performance improvements
Table 1 shows the characteristics of sleep in the SB, CAS and SWD conditions. It is apparent that SWD decreased SWA and time spent in N3, increased spindle power and time spent in N2, while not fragmenting sleep or affecting REM sleep duration. At the end of training on the visuomotor rotation task in the evening, the degree of adaptation achieved was similar in the CAS and SWD conditions (CAS: 85.8 ± 1.9%; SWD: 85.7 ± 1.3%, p>0.05). The following morning, subjects improved their performance on the rotation task in the CAS condition (+6.36 ± 0.90%), while such an improvement was not evident in the SWD condition (−2.24 ± 0.88%; p < .0001, Fig. 1A). Similarly to previous reports, in the CAS condition compared to SB, we found an all-night average 9.7 ± 4.4% increase (p=0.048) in SWA over the right parietal cortex electrode identified using a ROI approach (Huber et al., 2004; Landsness et al., 2009). In contrast, there was a 33.1 ± 6.6% decrease in the SWD condition during the entire night (p<0.001).
Table 1.
Impact of SWD on Sleep (n = 14)
| Variables | SB | SWD | CAS | Overall ANOVA | p Value for Comparison a | ||||
|---|---|---|---|---|---|---|---|---|---|
| M (± SEM) | M (± SEM) | M (± SEM) | df | F | p | SB vs. SWD | SWD vs. CAS | SB vs. CAS | |
| TST, min | 398.86 (6.92) | 389.39 (3.34) | 386.36 (7.74) | 2,26 | 1.13 | .338 | .854 | 1.000 | .483 |
| WASO, min | 25.07 (5.95) | 23.11 (3.00) | 20.25 (4.19) | 2,26 | 0.33 | .721 | 1.000 | 1.000 | 1.000 |
| AI | 12.30 (1.27) | 14.72 (1.63) | 10.69 (0.94) | 2,26 | 2.80 | .079 | .508 | .080 | 1.000 |
| N1, % | 8.20 (1.03) | 11.65 (1.21) | 8.02 (0.91) | 2,26 | 4.46 | .021 | .055 | .040 | 1.000 |
| N2, % | 52.87 (2.37) | 61.54 (1.66) | 52.71 (1.61) | 2,26 | 12.1 | <.001 | <.001 | <.001 | 1.000 |
| N3, % | 19.16 (1.98) | 6.68 (1.52) | 19.83 (1.61) | 2,26 | 39.4 | <.001 | <.001 | <.001 | 1.000 |
| REM, % | 19.75 (1.42) | 20.12 (1.29) | 19.44 (1.44) | 2,26 | 0.06 | .941 | 1.000 | 1.000 | 1.000 |
| REML, min | 127.96 (17.35) | 110.61 (14.12) | 117.14 (18.31) | 2,26 | 0.53 | .593 | .948 | 1.000 | 1.000 |
| SWA | 100 | 62.14 (4.88) | 101.08 (4.36) | 2,26 | 15.0 | <.001 | <.001 | <.001 | 1.000 |
| Spindle Power | 100 | 110.29 (3.36) | 99.09 (2.60) | 2,26 | 8.54 | .001 | .007 | .002 | 1.000 |
ANOVA, analysis of variance; SEM, standard error of the mean. SB, sleep baseline; SWD, slow wave deprivation; CAS, control acoustic stimulation; TST, total sleep time; WASO, wake (time) after sleep onset; AI, arousal index; N1/2/3, NREM stage 1/2/3 (% of TST); REM, stage REM (% of TST); REML, REM latency; SWA, slow wave activity ([μV2/0.25] in 1–4.5Hz range); Spindle Power ([μV2/0.25] in 12–15Hz range).
Post-hoc t-tests. p values are expressed with Bonferroni adjustment, where p < .05 is considered significant.
Figure 1.

A) Change in individual post-sleep visuomotor performance on the rotation adaptation task. Values represent percentage improvement in mean directional error upon retesting the next morning relative to testing the previous evening (n=15, paired t-test, p<0.0001). B) Dissipation of right parietal SWA expressed as a percentage of sleep baseline (SB). n=14, mean ± SEM.
To illustrate the impact of rotation learning on local SWA across the night compared to the SB, the average of all artifact-free NREM sleep epochs from the first three sleep cycles are displayed in Figure 1B. In agreement with previous findings, a 1 (condition) x 3 (cycle) repeated-measures ANOVA indicated a main effect for time (F 2,26 = 3.43, p = .047). Post-hoc tests demonstrated that right parietal SWA was higher in the first cycle (12.6 ± 5.8%) compared to the third cycle (2.2 ± 4.4%, p = 0.02).
As reported previously (Huber et al., 2004; Landsness et al., 2009), we found greater SWA was related to a higher degree of overnight improvement (r= 0.56, p = 0.002). Overall, these results confirm our previous findings that slow waves can be suppressed without fragmenting sleep, and that slow waves in the right parietal cortex are involved in the overnight improvement in performance observed after learning a visuomotor rotation task (Huber et al., 2004; Landsness et al., 2009)
3.2. Visuomotor rotation learning leaves a trace in the wake EEG
It was then hypothesized that the same plastic processes that lead to an increase in NREM SWA over a right parietal region would also produce a local trace during subsequent spontaneous eyes-open wake EEG. Therefore, we employed a region-of-interest (ROI) approach focused on the right parietal electrode that had shown the highest increase in sleep SWA in previous work (Huber et al., 2004; Maatta et el., 2010, Murphy et al., In Press), and measured changes in EEG power across all frequency ranges during wake before and immediately after training. Because no significant differences in wake IAF power in the evening were found between CAS and SWD sessions, data from the two training sessions were combined. The wake EEG power in the delta (1–4.5 Hz), theta (5–8 Hz), and beta (15–30 Hz) frequency ranges was similar before and after training (not shown). In contrast, the wake individual alpha power (IAF, see Methods) over the right parietal cortex decreased by an average of 20.6 ± 7.8% after training (p = 0.01; CAS and SWD, Fig 2A). Pre-training IAF power values in the right parietal region were negatively correlated with how well subjects learned the task in the evening (r = −0.71, p<0.05, Fig 2B). These results suggest that training in this type of visuomotor task leads to changes in the right parietal cortex that can be seen not only during sleep, as an increase in SWA during the initial portion of NREM sleep, but also during wake, as a decrease in alpha power after training.
Figure 2.

Wake EEG trace of learning. A) IAF power values Before Training and After Training for the Right Parietal region B) Correlation between amount of adaptation obtained during training and Pre-Training IAF power.
Taking advantage of the high spatial resolution that hdEEG affords, we then performed an exploratory analysis and asked whether other areas of the cortex may show similar changes in IAF power after visuomotor training. Figure 3 shows that in addition to the right parietal decrease, IAF power increased 13.8 ± 2.2% (p<0.001; CAS and SWD combined) and 18.4 ± 4.8% (p = 0.01; CAS and SWD combined) over right frontal and left parietal regions, respectively. However, when correcting for multiple comparisons using SnPM (Nichols and Holmes, 2002), all three areas highlighted by the overall exploratory analysis of wake power changes were no longer significant.
Figure 3.
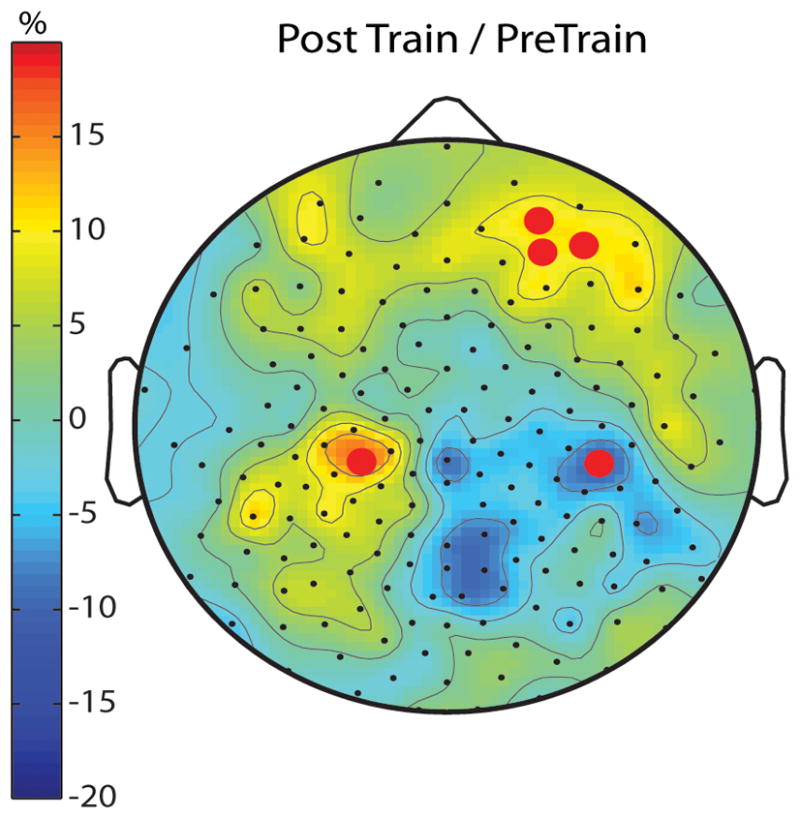
Waking EEG trace of learning. Topographic distribution of spontaneous, waking, eyes-open, IAF power after visuomotor rotation learning for the combined CAS and SWD expressed as percentage difference relative to before training. Red dots mark channels showing significant pre- to post-training differences (uncorrected for multiple comparisons, paired t-test N=15).
3.3. Sleep-dependent changes in the wake trace
Returning to the ROI-based approach over the right parietal area, we next investigated the overnight changes of the IAF power (Fig. 4A) and the effect of CAS and SWD. We found that after a night of CAS, IAF power values in the morning increased by 14.0 ± 5.4% compared to post-training in the evening, returning to pre-training baseline values. By contrast, after a night of SWD, the wake alpha power did not change (2.7± 3.9%). The overnight changes in the two conditions were significantly different (p = 0.03). Altogether, these results suggest that disrupting slow wave sleep may prevent the “renormalization”, i.e. the return of IAF power to pre-training levels.
Figure 4.

A) Overnight % change in Right parietal wake IAF power for CAS (black) and SWD (white) B) Overnight changes in Right Frontal and Left Parietal.
Given that the exploratory analysis showed post-training changes in the right frontal and left parietal regions, we asked if these regions differentially changed after a night of sleep. In the right frontal region (Fig. 4B), wake IAF power on average decreased slightly after CAS (−6.4 ± 5.5%) and slightly increased after SWD (3.6 ± 6.3%), without a significant difference in the overnight change between the two conditions (p = 0.1). The IAF power in left parietal areas (Fig. 4B) showed instead a decrease in both CAS (9.8 ± 4.5%) and SWD (13.2 ± 2.3%,) conditions, without a significant difference between the two (p = 0.52). In summary, significant overnight changes in the waking EEG IAF power in the CAS versus SWD conditions were restricted to right parietal electrodes. Because the right parietal cortex is also where a local increase in NREM SWA occurs after learning (Huber et al., 2004), the remainder of the results focuses on this region.
3.4. Changes in the wake EEG trace are correlated with sleep
The finding that the wake EEG trace over the right parietal region did not revert to pre-learning values after a night of SWD suggests that some aspect of slow wave sleep may be responsible for its renormalization. As expected, we did not find any correlation between overnight change in wake IAF power and total sleep time, time spent in any sleep stage, or arousal index. It has been previously shown that the dissipation of NREM sleep power from a period of high sleep pressure (beginning of a sleep episode) to period of low sleep pressure (end of a sleep episode), can take into account inter-subject variability while accurately predicting changes in cortical excitability (Vyazovskiy et al., 2008). Therefore, we correlated the overnight changes in NREM sleep power over the right parietal cortex with the overnight change in IAF power. We found that the overnight renormalization in IAF power and overnight changes in NREM sleep power over the right parietal cortex were correlated (p<0.05, uncorrected for multiple correlations). Specifically, as shown in Figure 5, the increase in wake IAF power after sleep in CAS was positively correlated with the decline across the night in NREM sleep power from 2.5 to 4.17 Hz and from 6.0 to 8.0 Hz, while it negatively correlated with higher frequencies (19.0–30.0 Hz). In contrast, no significant correlations were found for the SWD condition.
Figure 5.

Correlation between the decline in NREM sleep power across the night (First 20% - Last 20%) for individual frequency bins and the overnight change (PreTest - PostTrain) in IAF waking power for a single electrode over the right parietal cortex for CAS and SWD. Triangles indicate frequency bins for which sleep EEG power in CAS significantly (p<0.05) correlated (up = positive, down=negative) with IAF. There were no significant correlations for SWD.
4. Discussion
Previous work has shown that, during sleep following a visuomotor learning task, there is an increase in SWA over a right parietal area (Huber et al., 2004; Maatta et el., 2010, Murphy et al., In Press). Using a ROI-based approach focused on the same right parietal region, we found that learning the task is also associated with a local change in alpha power during wake. Moreover, changes in right parietal wake alpha power were linked to changes in post-learning sleep. These results are in agreement with a growing number of studies showing that experiences associated with learning promote local cortical plastic changes that can be detected with different approaches (Feldman, 2009; Pascual-Leone et al., 2005). Although an exploratory analysis performed over all EEG channels suggests that a trace of learning in the waking EEG may also be found in other cortical areas, these results should be interpreted cautiously as they did not survive a correction for multiple comparisons using SnPM.
4.1. Changes in EEG alpha power represent a wake trace of visuomotor learning
One of the findings of this study is that IAF power during resting eyes-open wake EEG over the right posterior parietal region before training predicted the degree of learning achieved at the end of the training session. This result is in line with studies showing that EEG alpha power before a task influences the outcome on perceptual tasks (Hanslmayr et al., 2007; Ergenoglu et al., 2004; Thut et al., 2006; van Dijk et al., 2008). We also found that after training, IAF power was decreased in the right parietal regions, while it was increased over the left parietal and right frontal areas. Several studies have shown that during a task, EEG alpha activity decreases over task-relevant areas, possibly reflecting an active engagement in the task (Klimesch et al., 2007, Perfetti et al., 2011). Increases in alpha activity have been found during tasks in “task-irrelevant” regions, possibly suggesting the occurrence of a cortical inhibitory activity aimed at blocking retrieval of interfering responses (Klimesch et al., 2007). Thus, it is possible that the right parietal cortex is specifically involved in the adaptation process. On the other hand, the involvement of the other two regions might reflect general attentional suppression mechanisms.
There is evidence that decreases in wake alpha power are indicative of increased neuronal activity, as shown by fMRI studies (Laufs et al., 2003), and increased cortical excitability, as demonstrated by TMS studies (De Gennaro et al., 2007, Romei et al., 2008; Sauseng et al., 2009; Ros et al., 2010). There is mounting evidence that alpha oscillations synchronize with gamma oscillations (30–100 Hz) (Palva and Palva, 2007) and that increased alpha-gamma phase synchrony is associated with improved behavioral performance (Hamidi et al., 2009). Unfortunately, we were unable to reliably examine wake frequencies above 30 Hz due to muscle artifacts in the EEG signal.
In summary, it is likely that the decrease in wake alpha power in right parietal cortex after learning reflects an increase in cortical excitability, presumably as a result of intense training.
4.2. Sleep’s role in renormalizing the wake trace
We found that sleep rich in slow waves appears to be necessary to bring IAF power back to baseline levels, since alpha power did not renormalize after SWD. The role of sleep in modulating neuronal activity in task-relevant areas is well documented by fMRI studies (Peigneux et al., 2006; Gais et al., 2007; Rauchs et al., 2007; Orban et al., 2007; Walker et al., 2005; Fischer et al., 2005; Sterpenich et al., 2009; Payne & Kensinger, 2010; Debas et al., 2010), although whether neuronal activity goes up or down after sleep depends on the nature of the task and on the specific brain area involved (Fischer et al., 2005; Walker et al., 2005; Gais et al., 2007; Debas et al., 2010). The results of total sleep deprivation on neuronal activity in task-relevant areas are more controversial, as some studies show no change at all and others demonstrate changes opposite to those seen after a period of sleep (Gais et al., 2007; Rauchs et al., 2008; Orban et al., 2006; Fischer et al., 2005; Walker et al., 2005; Maquet et al., 2003).
While there were no correlations between traditional sleep measures (such as time spent in specific sleep stages) and the overnight change in the wake EEG trace over right parietal cortex, the latter could be predicted by the dissipation of NREM sleep low-frequency activity (≤8Hz) during CAS. Furthermore, when SWA (< 4.5Hz) was decreased during SWD, the correlation between low-frequency activity and the change in alpha power was no longer present. While these correlation results were uncorrected for multiple comparisons they do suggest that low frequency NREM sleep activity may be involved in the renormalization of this wake EEG trace. No other studies have correlated changes in NREM sleep power spectra with changes in a wake EEG trace. However, a recent study found that after a problem solving insight task, the amount of early night slow wave sleep correlated with the overnight decrease in wake alpha and beta over occipital regions (Yordanova et al., 2010). In contrast with our results, Yordanova et al. also found that the longer was SWS, the greater was the decrease in wake alpha and beta power. However, these results may have been affected by circadian factors (Cajochen et al., 2002), as a condition of sleep rich in SWS early in the night was compared with a separate condition rich in REM sleep at the end of a night. For instance, Cajochen and colleagues (2002) showed that occipital-parietal alpha waking power is minimal early in the morning. Since a circadian modulation of alpha power would be expected to result in a decrease in alpha power, the increase observed in the present study is unlikely to be due to circadian factors, especially given that it was observed in a circumscribed cortical region. Nevertheless, an interaction between circadian factors and sleep-dependent changes in brain excitability needs to be further explored. It should also be mentioned that the present study examined how learning-dependent overnight changes in alpha activity were affected by sleep SWA. However, a control condition in which learning was minimized (as in Huber et al., 2004) was not examined, so it remains unknown to what extent the results reported here depend on the amount of learning.
4.3. Sleep lowers learning-induced changes in excitability
Assuming that a local decrease in wake alpha power may be indicative of increased cortical excitability, our findings suggest that sleep slow waves may be able to reduce it. This conclusion is in agreement with results of a series of animal studies. For instance, transcallosal stimulation in awake rats results in cortical evoked responses with steeper slopes after sustained wake than after sleep (Vyazovskiy et al., 2008), suggesting changes in both excitability and synaptic strength. Moreover, molecular markers of synaptic strength, such as the number of GluR1-containing glutamatergic AMPA receptors, increases with time spent awake and decreases with sleep (Vyazovskiy et al., 2008). Also, direct electrophysiological markers of pre- and post-synaptic strength, i.e. the frequency and amplitude of miniature excitatory synaptic currents, increase in rodent cortex with wake and decrease with sleep (Liu et al., 2010). Finally, in humans, cortical excitability as directly measured by TMS increases with the time spent awake and decreases with sleep (De Gennaro et al., 1997; Bellina et al., 2008). Overall, this evidence is consistent with the hypothesis that a fundamental function of sleep is to renormalize synaptic strength after the occurrence of widespread synaptic potentiation during wake due to learning (Tononi & Cirelli, 2006). In mammals, sleep slow waves may be one of the mechanisms responsible for these changes, most likely in association with changes in neuromodulators such as catecholamines, whose low levels in SWS would favor synaptic depression (Seol et al., 2007). These same mechanisms are likely to be responsible for the sleep/wake changes in cortical excitability as described in this study.
Highlights.
Learning a visuomotor task leads to topographically local changes in eyes open waking EEG alpha power.
Overnight changes in waking EEG alpha power are correlated with the dissipation of sleep slow wave activity.
Local cortical plastic changes associated with learning can be detected with both waking and sleep high-density EEG.
Acknowledgments
This research was funded by the National Institute of Mental Health (5T20MH077967 to GT and F30MH082601 to EL). We thank the staff of Wisconsin Sleep and research assistants Jenna Noe, Kate Sprecher, Rosa DeLucia, Brenna McCabe, Karen Paulsen for their role in data collection and scoring the sleep recordings, Jeff Guokas and Tim Wanger for help with data processing, and Dr. Vladislav V. Vyazovskiy for helpful comments and discussions. Dr. Tononi has consulted for Sanofi-Aventis and Takeda, and he is currently the David P. White Chair in Sleep Medicine at the University of Wisconsin – Madison, endowed by Phillips Respironics. Dr. Tononi has also received unrelated research support from Phillips Respironics. The other authors have indicated no financial conflicts of interest.
Footnotes
Publisher's Disclaimer: This is a PDF file of an unedited manuscript that has been accepted for publication. As a service to our customers we are providing this early version of the manuscript. The manuscript will undergo copyediting, typesetting, and review of the resulting proof before it is published in its final citable form. Please note that during the production process errors may be discovered which could affect the content, and all legal disclaimers that apply to the journal pertain.
References
- Bellina V, Huber R, Rosanova M, Mariotti M, Tononi G, Massimini M. Cortical excitability and sleep homeostasis in humans: a TMS/hd-EEG study. J Sleep Res. 2008;17:39. [Google Scholar]
- De Gennaro L, Marzano C, Veniero D, Moroni F, Fratello F, Curcio G, Ferrara M, Ferlazzo F, Novelli L, Concetta Pellicciari M, Bertini M, Rossini PM. Neurophysiological correlates of sleepiness: a combined TMS and EEG study. Neuroimage. 2007 Jul;36(4):1277–87. doi: 10.1016/j.neuroimage.2007.04.013. [DOI] [PubMed] [Google Scholar]
- Debas K, Carrier J, Orban P, Barakat M, Lungu O, Vandewalle G, et al. Brain plasticity related to the consolidation of motor sequence learning and motor adaptation. Proc Natl Acad Sci U S A. 2010 Oct;107(41):17839–44. doi: 10.1073/pnas.1013176107. [DOI] [PMC free article] [PubMed] [Google Scholar]
- Delorme A, Makeig S. EEGLAB: an open source toolbox for analysis of single-trial EEG dynamics including independent component analysis. J Neurosci Methods. 2004 Mar;134(1):9–21. doi: 10.1016/j.jneumeth.2003.10.009. [DOI] [PubMed] [Google Scholar]
- Ergenoglu T, Demiralp T, Bayraktaroglu Z, Ergen M, Beydagi H, Uresin Y. Alpha rhythm of the EEG modulates visual detection performance in humans. Brain Res Cogn Brain Res. 2004 Aug;20(3):376–83. doi: 10.1016/j.cogbrainres.2004.03.009. [DOI] [PubMed] [Google Scholar]
- Feldman D. Synaptic mechanisms for plasticity in neocortex. Annu Rev Neurosci. 2009;32:33–55. doi: 10.1146/annurev.neuro.051508.135516. [DOI] [PMC free article] [PubMed] [Google Scholar]
- Ferrara M, De Gennaro L, Curcio G, Cristiani R, Corvasce C, Bertini M. Regional differences of the human sleep electroencephalogram in response to selective slow-wave sleep deprivation. Cereb Cortex. 2002 Jul;12(7):737–48. doi: 10.1093/cercor/12.7.737. [DOI] [PubMed] [Google Scholar]
- Fischer S, Nitschke M, Melchert U, Erdmann C, Born J. Motor memory consolidation in sleep shapes more effective neuronal representations. J Neurosci. 2005 Dec;25(49):11248–55. doi: 10.1523/JNEUROSCI.1743-05.2005. [DOI] [PMC free article] [PubMed] [Google Scholar]
- Gais S, Albouy G, Boly M, Dang-Vu T, Darsaud A, Desseilles M, et al. Sleep transforms the cerebral trace of declarative memories. Proc Natl Acad Sci U S A. 2007 Nov;104(47):18778–83. doi: 10.1073/pnas.0705454104. [DOI] [PMC free article] [PubMed] [Google Scholar]
- Ghilardi M, Ghez C, Dhawan V, Moeller J, Mentis M, Nakamura T, et al. Patterns of regional brain activation associated with different forms of motor learning. Brain Res. 2000 Jul;871(1):127–45. doi: 10.1016/s0006-8993(00)02365-9. [DOI] [PubMed] [Google Scholar]
- Hamidi M, Slagter H, Tononi G, Postle B. Repetitive Transcranial Magnetic Stimulation Affects behavior by Biasing Endogenous Cortical Oscillations. Front Integr Neurosci. 2009;3:14. doi: 10.3389/neuro.07.014.2009. [DOI] [PMC free article] [PubMed] [Google Scholar]
- Hanslmayr S, Aslan A, Staudigl T, Klimesch W, Herrmann C, Bäuml K. Prestimulus oscillations predict visual perception performance between and within subjects. Neuroimage. 2007 Oct;37(4):1465–73. doi: 10.1016/j.neuroimage.2007.07.011. [DOI] [PubMed] [Google Scholar]
- Huber R, Ghilardi M, Massimini M, Tononi G. Local sleep and learning. Nature. 2004 Jul;430(6995):78–81. doi: 10.1038/nature02663. [DOI] [PubMed] [Google Scholar]
- Hulse BK, Landsness EC, Sarasso S, Ferrarelli F, Guokas JJ, Wanger T, Tononi G. A postsleep decline in auditory evoked potential amplitude reflects sleep homeostasis. Clin Neurophysiol. 2011 Mar; doi: 10.1016/j.clinph.2011.01.041. [DOI] [PMC free article] [PubMed] [Google Scholar]
- Iber C, Ancoli-Israel S, Chessonn A, Quan S. The AASM Manual for the Scoring of Sleep and Associated Events: Rules, Terminology, and Technical Specifications. 1. Westchester, IL: American Academy of Sleep Medicine; 2007. [Google Scholar]
- Jung T, Makeig S, Humphries C, Lee T, McKeown M, Iragui V, et al. Removing electroencephalographic artifacts by blind source separation. Psychophysiology. 2000 Mar;37(2):163–78. [PubMed] [Google Scholar]
- Klimesch W, Doppelmayr M, Russegger H, Pachinger T. Theta band power in the human scalp EEG and the encoding of new information. Neuroreport. 1996 May;7(7):1235–40. doi: 10.1097/00001756-199605170-00002. [DOI] [PubMed] [Google Scholar]
- Klimesch W, Sauseng P, Hanslmayr S. EEG alpha oscillations: the inhibition-timing hypothesis. Brain Res Rev. 2007 Jan;53(1):63–88. doi: 10.1016/j.brainresrev.2006.06.003. [DOI] [PubMed] [Google Scholar]
- Krakauer J, Ghez C, Ghilardi M. Adaptation to visuomotor transformations: consolidation, interference, and forgetting. J Neurosci. 2005;25:473–478. doi: 10.1523/JNEUROSCI.4218-04.2005. [DOI] [PMC free article] [PubMed] [Google Scholar]
- Landsness EC, Goldstein MR, Peterson MJ, Tononi G, Benca RM. Antidepressant effects of selective slow wave sleep deprivation in major depression: A high-density EEG investigation. J Psychiatr Res. 2011 Mar; doi: 10.1016/j.jpsychires.2011.02.003. [DOI] [PMC free article] [PubMed] [Google Scholar]
- Landsness E, Crupi D, Hulse B, Peterson M, Huber R, Ansari H, et al. Sleep-dependent improvement in visuomotor learning: a causal role for slow waves. Sleep. 2009 Oct;32(10):1273–84. doi: 10.1093/sleep/32.10.1273. [DOI] [PMC free article] [PubMed] [Google Scholar]
- Laufs H, Kleinschmidt A, Beyerle A, Eger E, Salek-Haddadi A, Preibisch C, et al. EEG-correlated fMRI of human alpha activity. Neuroimage. 2003 Aug;19(4):1463–76. doi: 10.1016/s1053-8119(03)00286-6. [DOI] [PubMed] [Google Scholar]
- Liu ZW, Faraguna U, Cirelli C, Tononi G, Gao XB. Direct evidence for wake-related increases and sleep-related decreases in synaptic strength in rodent cortex. J Neurosci. 2010 Jun;30(25):8671–5. doi: 10.1523/JNEUROSCI.1409-10.2010. [DOI] [PMC free article] [PubMed] [Google Scholar]
- Määttä S, Landsness E, Sarasso S, Ferrarelli F, Ferreri F, Ghilardi MF, et al. The effects of morning training on night sleep: a behavioral and EEG study. Brain Res Bull. 2010 Apr;82(1–2):118–23. doi: 10.1016/j.brainresbull.2010.01.006. [DOI] [PMC free article] [PubMed] [Google Scholar]
- Makeig S, Jung T, Bell A, Ghahremani D, Sejnowski T. Blind separation of auditory event-related brain responses into independent components. Proc Natl Acad Sci U S A. 1997 Sep;94(20):10979–84. doi: 10.1073/pnas.94.20.10979. [DOI] [PMC free article] [PubMed] [Google Scholar]
- Maquet P, Schwartz S, Passingham R, Frith C. Sleep-related consolidation of a visuomotor skill: brain mechanisms as assessed by functional magnetic resonance imaging. J Neurosci. 2003 Feb;23(4):1432–40. doi: 10.1523/JNEUROSCI.23-04-01432.2003. [DOI] [PMC free article] [PubMed] [Google Scholar]
- Moisello C, Crupi D, Tunik E, Quartarone A, Bove M, Tononi G, et al. The serial reaction time task revisited: a study on motor sequence learning with an arm-reaching task. Exp Brain Res. 2009 Mar;194(1):143–55. doi: 10.1007/s00221-008-1681-5. [DOI] [PMC free article] [PubMed] [Google Scholar]
- Murphy M, Huber R, Esser S, Riedner BA, Massimini M, Ferrarelli F, Ghilardi MF, Tononi G. The Cortical Topography of Local Sleep. Current Top Med Chem. doi: 10.2174/156802611797470303. In Press. [DOI] [PMC free article] [PubMed] [Google Scholar]
- Nichols TE, Holmes AP. Nonparametric permutation tests for functional neuroimaging: a primer with examples. Hum Brain Map. 2002 Jan;15(1):1–25. doi: 10.1002/hbm.1058. [DOI] [PMC free article] [PubMed] [Google Scholar]
- Orban P, Rauchs G, Balteau E, Degueldre C, Luxen A, Maquet P, et al. Sleep after spatial learning promotes covert reorganization of brain activity. Proc Natl Acad Sci U S A. 2006 May;103(18):7124–9. doi: 10.1073/pnas.0510198103. [DOI] [PMC free article] [PubMed] [Google Scholar]
- Palva S, Palva J. New vistas for alpha-frequency band oscillations. Trends Neurosci. 2007 Apr;30(4):150–8. doi: 10.1016/j.tins.2007.02.001. [DOI] [PubMed] [Google Scholar]
- Pascual-Leone A, Amedi A, Fregni F, Merabet L. The plastic human brain cortex. Annu Rev Neurosci. 2005;28:377–401. doi: 10.1146/annurev.neuro.27.070203.144216. [DOI] [PubMed] [Google Scholar]
- Pascual-Leone A, Nguyet D, Cohen L, Brasil-Neto J, Cammarota A, Hallett M. Modulation of muscle responses evoked by transcranial magnetic stimulation during the acquisition of new fine motor skills. J Neurophysiol. 1995 Sep;74(3):1037–45. doi: 10.1152/jn.1995.74.3.1037. [DOI] [PubMed] [Google Scholar]
- Payne J, Kensinger E. Sleep Leads to Changes in the Emotional Memory Trace: Evidence from fMRI. J Cogn Neurosci. 2010 Jun; doi: 10.1162/jocn.2010.21526. [DOI] [PubMed] [Google Scholar]
- Peigneux P, Orban P, Balteau E, Degueldre C, Luxen A, Laureys S, et al. Offline persistence of memory-related cerebral activity during active wakefulness. PLoS Biol. 2006 Apr;4(4):e100. doi: 10.1371/journal.pbio.0040100. [DOI] [PMC free article] [PubMed] [Google Scholar]
- Perfetti B, Moisello C, Landsness E, Kvint S, Pruski A, Onofrj M, et al. The temporal evolution of oscillatory activity predicts performance in a choice-reaction time reaching task. J Neurophysiol. 2011 Jan;105(1):18–27. doi: 10.1152/jn.00778.2010. [DOI] [PMC free article] [PubMed] [Google Scholar]
- Pourtois G, Rauss K, Vuilleumier P, Schwartz S. Effects of perceptual learning on primary visual cortex activity in humans. Vision Res. 2008 Jan;48(1):55–62. doi: 10.1016/j.visres.2007.10.027. [DOI] [PubMed] [Google Scholar]
- Rauchs G, Orban P, Schmidt C, Albouy G, Balteau E, Degueldre C, et al. Sleep modulates the neural substrates of both spatial and contextual memory consolidation. PLoS One. 2008;3(8):e2949. doi: 10.1371/journal.pone.0002949. [DOI] [PMC free article] [PubMed] [Google Scholar]
- Romei V, Rihs T, Brodbeck V, Thut G. Resting electroencephalogram alpha-power over posterior sites indexes baseline visual cortex excitability. Neuroreport. 2008 Jan;19(2):203–8. doi: 10.1097/WNR.0b013e3282f454c4. [DOI] [PubMed] [Google Scholar]
- Ros T, Munneke M, Ruge D, Gruzelier J, Rothwell J. Endogenous control of waking brain rhythms induces neuroplasticity in humans. Eur J Neurosci. 2010 Feb;31(4):770–8. doi: 10.1111/j.1460-9568.2010.07100.x. [DOI] [PubMed] [Google Scholar]
- Sauseng P, Klimesch W, Gerloff C, Hummel F. Spontaneous locally restricted EEG alpha activity determines cortical excitability in the motor cortex. Neuropsychologia. 2009 Jan;47(1):284–8. doi: 10.1016/j.neuropsychologia.2008.07.021. [DOI] [PubMed] [Google Scholar]
- Schwartz S, Maquet P, Frith C. Neural correlates of perceptual learning: a functional MRI study of visual texture discrimination. Proc Natl Acad Sci U S A. 2002 Dec;99(26):17137–42. doi: 10.1073/pnas.242414599. [DOI] [PMC free article] [PubMed] [Google Scholar]
- Seol GH, Ziburkus J, Huang S, Song L, Kim IT, Takamiya K, et al. Neuromodulators control the polarity of spike-timing-dependent synaptic plasticity. Neuron. 2007 Sep;55(6):919–29. doi: 10.1016/j.neuron.2007.08.013. [DOI] [PMC free article] [PubMed] [Google Scholar]
- Sterpenich V, Albouy G, Darsaud A, Schmidt C, Vandewalle G, Dang Vu T, et al. Sleep promotes the neural reorganization of remote emotional memory. J Neurosci. 2009 Apr;29(16):5143–52. doi: 10.1523/JNEUROSCI.0561-09.2009. [DOI] [PMC free article] [PubMed] [Google Scholar]
- Thut G, Nietzel A, Brandt S, Pascual-Leone A. Alpha-band electroencephalographic activity over occipital cortex indexes visuospatial attention bias and predicts visual target detection. J Neurosci. 2006 Sep;26(37):9494–502. doi: 10.1523/JNEUROSCI.0875-06.2006. [DOI] [PMC free article] [PubMed] [Google Scholar]
- Tinguely G, Finelli L, Landolt H, Borbély A, Achermann P. Functional EEG topography in sleep and waking: state-dependent and state-independent features. Neuroimage. 2006 Aug;32(1):283–92. doi: 10.1016/j.neuroimage.2006.03.017. [DOI] [PubMed] [Google Scholar]
- Tononi G, Cirelli C. Sleep function and synaptic homeostasis. Sleep Med Rev. 2006 Feb;10(1):49–62. doi: 10.1016/j.smrv.2005.05.002. [DOI] [PubMed] [Google Scholar]
- van Dijk H, Schoffelen J, Oostenveld R, Jensen O. Prestimulus oscillatory activity in the alpha band predicts visual discrimination ability. J Neurosci. 2008 Feb;28(8):1816–23. doi: 10.1523/JNEUROSCI.1853-07.2008. [DOI] [PMC free article] [PubMed] [Google Scholar]
- Vyazovskiy VV, Cirelli C, Pfister-Genskow M, Faraguna U, Tononi G. Molecular and electrophysiological evidence for net synaptic potentiation in wake and depression in sleep. Nat Neurosci. 2008 Feb;11(2):200–8. doi: 10.1038/nn2035. [DOI] [PubMed] [Google Scholar]
- Walker M, Stickgold R, Jolesz F, Yoo S. The functional anatomy of sleep-dependent visual skill learning. Cereb Cortex. 2005 Nov;15(11):1666–75. doi: 10.1093/cercor/bhi043. [DOI] [PubMed] [Google Scholar]
- Yordanova J, Kolev V, Wagner U, Verleger R. Differential associations of early- and late-night sleep with functional brain states promoting insight to abstract task regularity. PLoS One. 2010;5(2):e9442. doi: 10.1371/journal.pone.0009442. [DOI] [PMC free article] [PubMed] [Google Scholar]