Abstract
The primary role of a red blood cell (RBC) is delivering oxygen throughout our body. Abnormalities of this basic function lead to anemia and are caused by numerous diseases such as malaria and sickle cell anemia. As prompt and inexpensive tests for blood screening are in demand, we have developed a faster and reliable way to measure morphological parameters associated with the structure of red blood cells and the size distribution of the cells in a whole blood smear. Modeling the RBC shape under Born approximation, we are able to determine parameters of clinical relevance, such as the diameter, thickness and dimple size. From a measured quantitative phase image of a blood smear, we can determine the average and standard deviation of the red blood cell volume simultaneously, i.e., without analyzing each cell individually. This approach may open the door for a new generation of label-free, high-throughput blood testing.
OCIS codes: (180.3170) Interference microscopy, (070.7345) Wave propagation, (100.2960) Image analysis, (170.1470) Blood or tissue constituent monitoring, (120.5820) Scattering Measurements
1. Introduction
Blood is a life-sustaining fluid which circulates through the heart and blood vessels [1]. It carries oxygen and nutrients to the tissues and waste products to the lungs, livers and kidneys, where they are removed from the body. The human red blood cell (RBC) membrane, a fluid lipid bilayer tethered to an elastic 2D spectrin network, provides the control of the cell’s morphology, which has been shown to correlate with its mechanical properties [2–4]. These properties, in turn, influence the ability of RBCs to squeeze through microvasculature and transport oxygen in circulation. In particular, RBC morphology can be used by clinicians as a marker for various blood disorders. Because current automatic analyzers such as flow cytometers and impedance counters do not provide morphological information at the single cell level, human blood smear analysis has remained the standard diagnostic tool in pathology. The contrast of these transparent cells is typically enhanced by stains (e.g., Giemsa stain) [5]. Recently, quantitative phase imaging (QPI) has shown potential for extracting morphological information of individual RBCs without exogenous contrast [6–8]. Thus, QPI can provide volume and Hb concentration from imaging a blood smear, and performing individual cell analysis over a sufficiently large population [9,10]. On the other hand, Fourier transform light scattering (FTLS) [11–13] utilizes QPI data to calculate the scattering properties of cells and tissues with high sensitivity. Measuring the angular scattering from an entire blood smear is complementary to QPI, because it informs about morphology in an ensemble-averaged sense. In other words, while QPI provides spatial resolution but no angular (spatial frequency) information, FTLS provides angular resolution, by averaging out the spatial information. Clearly, for population-average measurements, such as in blood smears, FTLS has significant advantages. However, in order to use scattering data and extract the average cell information, e.g., the mean cell volume (MCV), one must solve the scattering inverse problem by applying an appropriate scattering model. Due to the specific discoid shape of RBCs, modeling their light scattering properties has been limited to numerical calculations based on methods such as finite-difference time domain [14].
Here, we show that a model based on the first Born approximation allows us to fit FTLS data and extract quantitative morphological parameters over 1000 cells simultaneously. In Section 2, we provide a new, direct derivation of the result that establishes the scattered field as the Fourier transform of the RBC scattering potential. Because of the homogeneous content of RBCs (hemoglobin solution), we show that the scattering potential associated with the discoid shape can be well approximated by simple geometrical bodies, for which the calculations can be readily performed. Section 3 presents the validation of this model with data from single cells. In Section 4 we demonstrate the capability of our analysis for an ensemble of cells, including blood smears, and Section 5 summarizes and discusses the results.
2. RBCs under the (first order) Born approximation
Light scattering methods have been proven effective in extracting morphological information from unstained cells and tissues [15,16]. However, measuring angular scattering from single cells is challenging due to the low scattering cross sections involved (see, e.g., Chapter 5 in [17]) and due to practical difficulties in measuring multiple angles from a small, hard-to-manipulate, and dynamic object. To overcome this challenge, we recently developed Fourier transform light scattering (FTLS) [13,18]. The main idea in FTLS is to perform the scattering measurement at the image plane, rather than in the far zone. Of course, this approach requires that both the amplitude and the phase of the field are measured at the image plane, such that the scattered field may be obtained via a Fourier transform.
In order to describe the light scattering by RBCs, we consider the geometry in Fig. 1a , where a plane wave propagating along z is incident on the specimen. The plane wave has the form , with A the spectral amplitude and the wavenumber. The inhomogeneous Helmholtz equation describes the dependence of the scattering field U on spatial coordinate, r, and angular frequency, ω, namely,
Fig. 1.
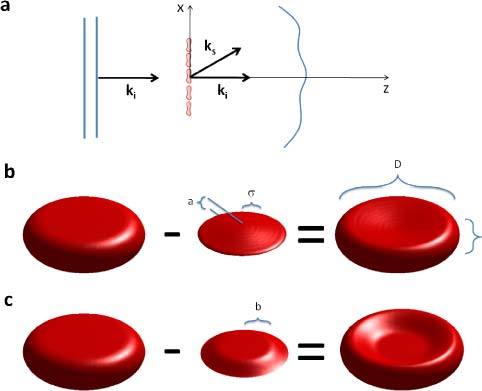
(a) Plane wave illumination of a blood smear; ki and ks are the incident and scattered wave vectors. (b) The discocyte modeled by subtracting two Gaussian surfaces from the top and bottom of a cylinder. c) A flat top Gaussian describes deflated cells as described in Section. 4.
| (1) |
where n is the refractive index, assumed to be independent of ω, and c the speed of light in vacuum. Equation (1) can be re-arranged to show the inhomogeneous part of the refracting index acting as a secondary source (see e.g., Chapter 13 in Ref. [19].),
| (2) |
where is the dielectric susceptibility associated with the specimen. Clearly, the right hand side of the equation represents a secondary source due to the field scattering from within the medium. Since both χ and U are spatially varying, solving Eq. (2) is challenging. A great simplification occurs if we can assume that the scattering field inside the cells suffers insignificant perturbation, i.e., it remains a plane wave. This is the essence of the (first order) Born approximation, for which Eq. (2) becomes
| (3) |
In order to solve this Helmholtz equation we calculate its Fourier transform with respect to r and use two basic properties of the Fourier transform, namely
| (4) |
In Eq. (4), ↔ indicates the Fourier transformation, is the Fourier transform of χ, k () is the conjugate variable to r, and . Thus, the scattered field in the wave vector representation is obtained at once,
| (5) |
Equation (5) establishes the well-known result that measuring the scattered field along the direction of the wave vector k provides information about the object’s frequency component . The scattering angle is contained in the modulus of this scattering wave vector (or momentum transfer, q), , as shown in Fig. 1a.
In QPI, the information about the RBC is integrated along the z-axis, which reduces the spatial dimensionality of the problem from 3 to 2. This is the case whenever the depth of field is larger than the thickness of the sample. Since RBCs are only 2-3 μm in thickness, this z-projection takes place even for relatively high numerical apertures (see, e.g., Ref. [10].). In order to incorporate this integration process in Eq. (5), we recall the central ordinate theorem, that is
| . | (6) |
Thus, Eq. (6) establishes that integrating (projecting) the 3D object structure over one axis, say z, gives access to a “slice”, i.e. the plane z = 0, of its 3D Fourier transform. This is a central result in computed tomography, which is known as the Fourier-slice theorem (see e.g. Chapter 3 in Ref. [20].). Note that the z-component of in Eq. (5) is , such that the projection along z requires . Therefore, Eq. (5) applied to 2D (thin) specimens, such as RBCs, becomes
| (7) |
We can finally Fourier transform Eq. (7) with respect to kz, such that we obtain the scattered field in terms of the transverse wavevector (kx, ky) and distance z
| (8) |
In Eq. (8), we ignored the backscattering term, of the form , with q2 = k02-kx2- ky2. Eq. (7) provides a direct relationship between the measured scattered field and the object structure, which is possible due to the weak scattering assumption. Note that because the RBC can be approximated as a homogeneous solution of hemoglobin, i.e., of constant refractive index, the spatial distribution of its dielectric susceptibility is only due to its 3D shape, S,
| (9a) |
| (9b) |
Therefore, under the Born approximation, the scattered field can be directly calculated by Fourier transforming the 3D shape of the cell.
The RBC is constructed in a discrete representation as a three-dimensional matrix. We model the RBC shape as a cylinder from which a Gaussian surface is subtracted both from the top and bottom, as illustrated in Fig. 1b. The width and height of the Gaussian function control the dimensions of the RBC “dimple”. Thus, the shape and size of the cell are controllable with specific parameters: diameter (D), thickness (h), the dimple depth (a), and dimple width (σ). To account for the occasional flatness of the dimple, which is associated with cells in hypertonic solutions, which can happen inherently due to solution evaporation, we also use a “flat top” Gaussian function, of diameter b, as illustrated in Fig. 1c.
3. Scattering from single RBCs
In order to establish the validity of our model, we fit the scattering data obtained by FTLS. RBCs from whole blood are smeared on a cover slide and imaged using diffraction phase microscopy [21–23] and the Fourier transform light scattering information is retrieved as described in [13]. The maximum scattering angle measured is 30°, which is limited by our objective. First, we measured single RBCs (see Fig. 2 ). Note that the quantitative phase images contain background noise that is not included in our calculation. In order to perform a closer comparison between our models either the noise had to be added to the calculation or subtracted from the data. Thus, in the first case, the simulated cell was placed on a background previously measured by DPM. In the second approach, we segmented the cell from the DPM image and zeroed-out the background. Figures 2a-c show the results of the first approach, while Figs. d-f show the second. Figure 2a illustrates the simulated cell sitting on a background that was numerically added from the actual data. In Fig. 2e, the measured cell sits on a background that was numerically zeroed-out. Figures 2c, f demonstrate that our model accurately describes the actual data.
Fig. 2.
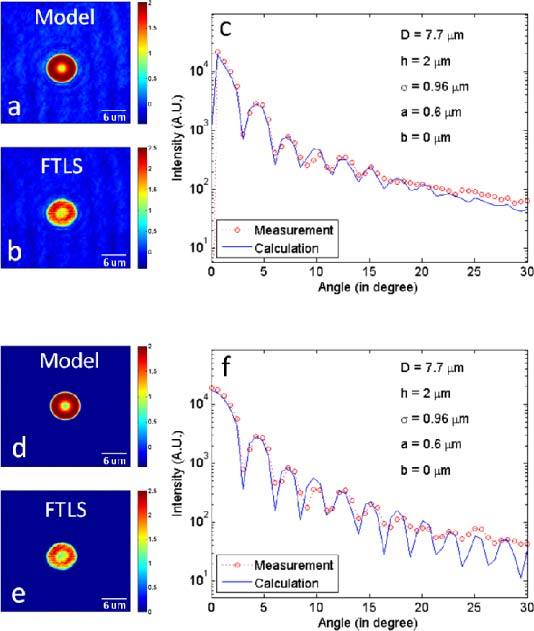
(a) Simulated quantitative phase image of an RBC model with the background added numerically. (b) Phase image obtained from the measurement. (c) Comparison between the angular scattering from the simulated phase image (a) and from the measured phase image (b). (d) Simulated phase image of an RBC model without introducing noise. (e) Quantitative phase image from the measurement, with the noise thresholded out. (f) Comparison between the angular scattering from (d) and (e).
It takes 0.63 seconds average with standard deviation 0.017 seconds to construct a model with a typical set of parameters, say, D = 7.7 μm, h = 2 μm, σ = 0.96 μm, a = 0.6 μm, with 16 pixels/µm resolution. In order to smooth down the edges of the cell shape, we perform a box filter over 5 pixels, which takes 31.45 seconds ± 0.05 seconds. It takes additional 6.87 ± 0.11 seconds to complete the computation. It was done on a machine whose specifications were 1.73 GHz Intel dual-core processor, 32-bit operating system, and 2 GB of physical RAM. We found that the diameter, D, and the dimple width, σ, affect the scattering curve most significantly (see Fig. 3 ). Specifically, as the diameter increases, the angular scattering is more concentrated along the direction of propagation. As the dimple size, σ, decreases, the local maxima and minima in the scattering curve shift position modulation seems to increase and the scattering peaks broaden. To find out how changing the fitting parameters affect the angular scattering characteristics, we vary one parameter at a time to isolate its effects. Following this, a least squared fitting algorithm is applied, yielding the set of parameters that give the minimal error.
Fig. 3.
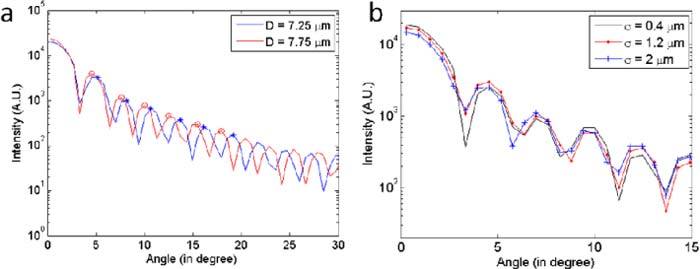
(a) As the diameter increases, the peaks are compressing toward lower angle. The tips of some peaks were marked for visual aid. (b) As σ changes, the width and shape of the peak lobes change. As σ increases, the local minima tends to increase, and the width of the peak lobe either increases or decreases depending on the position.
Figure 4 shows the fitting errors for the main parameters, D and σ. The best fit is obtained first by varying D and σ until the peaks are aligned and then by adjusting other parameters. Because of our method to construct RBC model and one-to-one correspondence of Fourier transformation, it gives us the unique fit, i.e. the unique set of parameters. The error function we use is the modulus of the difference between data and the fit, which then is divided by the data, to obtain the relative error. Figure 4 depicts the error function, based on the phase image shown in Fig. 2e.
Fig. 4.
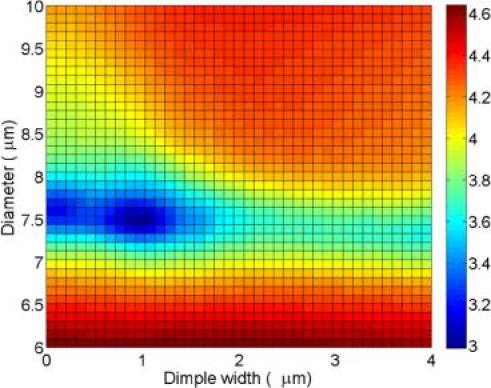
Least square error plot (log scale). The lowest point indicates the best fit. The color bar indicates the relative error value (a. u.).
4. Scattering from blood smears
Having established our method on single cells, we applied our procedures to find the average parameters from a blood smear containing hundreds of cells. An unstained blood smear was imaged by tiling 10x10 single images. This 144 megapixel image contains several hundred RBCs, as shown in Fig. 5a . In order to fit the FTLS data associated with the entire smear we assumed a Gaussian distribution in diameters, of standard deviation Dσ. Figure 5b demonstrates an excellent fit by our model and the best fitting parameters are indicated. The RBC diameter, D = 8.6 ± 0.7 μm are within the normal range. These results show that we can find the RBC size distribution without performing single cell analysis. We confirmed that the sensitivity of the angular scattering curve is high enough such that at least about 0.1 μm difference in diameter can be distinguished.
Fig. 5.
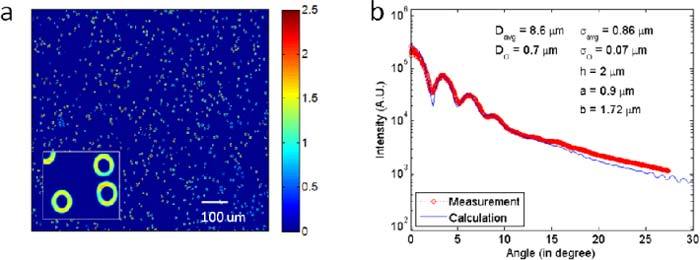
(a) Quantitative phase image of an RBC smear. (b) Comparison of the angular scattering from the simulation with that of the measurement.
The orientation of RBC’s does make a significant difference, i.e., an RBC on its side will have a completely different scattering pattern than one lying flat. Of course, our Bon-approximation model can account for this orientation change, the only difference would be in the way we write the scattering potential, χ(r). However, for blood smears, we found that with rare exceptions (~1 in 1,000) all cells are flat. Similarly, finding leukocytes in the same field of view is a rare event; for each white blood cell, a healthy patient has ~1,000 RBCs in circulation.
5. Summary and discussion
The currently available complete blood count (CBC) testing only provides volumetric information and hemoglobin concentration associated with a population of RBCs. We show that by combining FTLS and the Born approximation more comprehensive information such as diameter, thickness, and the depth and width of the dimple region may be obtained. The calculation time is on the order of a few seconds, which is a dramatic improvement over simulation techniques such as FDTD. We believe that this approach can potentially be used as a point of care technology, especially benefiting areas where expensive equipment and human expertise are not abundant.
Acknowledgments
This research was supported in part by the National Science Foundation (CBET 08-46660 CAREER, CBET-1040462 MRI) and National Cancer Institute (R21 CA147967-01). For more information, visit http://light.ece.uiuc.edu/.
References and links
- 1.K. Kaushansky and W. J. Williams, Williams Hematology (McGraw-Hill Medical, New York, 2011). [Google Scholar]
- 2.Popescu G., Ikeda T., Goda K., Best-Popescu C. A., Laposata M., Manley S., Dasari R. R., Badizadegan K., Feld M. S., “Optical measurement of cell membrane tension,” Phys. Rev. Lett. 97(21), 218101 (2006). 10.1103/PhysRevLett.97.218101 [DOI] [PubMed] [Google Scholar]
- 3.Park Y. K., Best C. A., Badizadegan K., Dasari R. R., Feld M. S., Kuriabova T., Henle M. L., Levine A. J., Popescu G., “Measurement of red blood cell mechanics during morphological changes,” Proc. Natl. Acad. Sci. U.S.A. 107(15), 6731–6736 (2010). 10.1073/pnas.0909533107 [DOI] [PMC free article] [PubMed] [Google Scholar]
- 4.Park Y. K., Diez-Silva M., Popescu G., Lykotrafitis G., Choi W., Feld M. S., Suresh S., “Refractive index maps and membrane dynamics of human red blood cells parasitized by Plasmodium falciparum,” Proc. Natl. Acad. Sci. U.S.A. 105(37), 13730–13735 (2008). 10.1073/pnas.0806100105 [DOI] [PMC free article] [PubMed] [Google Scholar]
- 5.B. J. Bain, A Beginner's Guide to Blood Cells (Blackwell Pub. Malden, Mass. 2004). [Google Scholar]
- 6.Mir M., Ding H., Wang Z., Reedy J., Tangella K., Popescu G., “Blood screening using diffraction phase cytometry,” J. Biomed. Opt. 15(2), 027016 (2010). 10.1117/1.3369965 [DOI] [PubMed] [Google Scholar]
- 7.Mir M., Wang Z., Tangella K., Popescu G., “Diffraction Phase Cytometry: blood on a CD-ROM,” Opt. Express 17(4), 2579–2585 (2009). 10.1364/OE.17.002579 [DOI] [PubMed] [Google Scholar]
- 8.Popescu G., Park Y., Choi W., Dasari R. R., Feld M. S., Badizadegan K., “Imaging red blood cell dynamics by quantitative phase microscopy,” Blood Cells Mol. Dis. 41(1), 10–16 (2008). 10.1016/j.bcmd.2008.01.010 [DOI] [PMC free article] [PubMed] [Google Scholar]
- 9.Park Y., Yamauchi T., Choi W., Dasari R., Feld M. S., “Spectroscopic phase microscopy for quantifying hemoglobin concentrations in intact red blood cells,” Opt. Lett. 34(23), 3668–3670 (2009). 10.1364/OL.34.003668 [DOI] [PMC free article] [PubMed] [Google Scholar]
- 10.Ding H. F., Popescu G., “Instantaneous spatial light interference microscopy,” Opt. Express 18(2), 1569–1575 (2010). 10.1364/OE.18.001569 [DOI] [PubMed] [Google Scholar]
- 11.Ding H., Wang Z., Liang X., Boppart S. A., Tangella K., Popescu G., “Measuring the scattering parameters of tissues from quantitative phase imaging of thin slices,” Opt. Lett. 36(12), 2281–2283 (2011). 10.1364/OL.36.002281 [DOI] [PubMed] [Google Scholar]
- 12.Wang Z., Ding H., Popescu G., “Scattering-phase theorem,” Opt. Lett. 36(7), 1215–1217 (2011). 10.1364/OL.36.001215 [DOI] [PubMed] [Google Scholar]
- 13.Ding H. F., Wang Z., Nguyen F., Boppart S. A., Popescu G., “Fourier transform light scattering of inhomogeneous and dynamic structures,” Phys. Rev. Lett. 101(23), 238102 (2008). 10.1103/PhysRevLett.101.238102 [DOI] [PMC free article] [PubMed] [Google Scholar]
- 14.Karlsson A., He J. P., Swartling J., Andersson-Engels S., “Numerical simulations of light scattering by red blood cells,” IEEE Trans. Biomed. Eng. 52(1), 13–18 (2005). 10.1109/TBME.2004.839634 [DOI] [PubMed] [Google Scholar]
- 15.A. Wax and V. Backman, eds., Biomedical Applications of Light Scattering (McGraw-Hill, New York, 2010). [Google Scholar]
- 16.V. V. Tuchin and Society of Photo-optical Instrumentation Engineers, Tissue Optics: Light Scattering Methods and Instruments for Medical Diagnosis (SPIE/International Society for Optical Engineering, Bellingham, 2007). [Google Scholar]
- 17.G. Popescu, ed., Nanobiophotonics (McGraw-Hill, New York, 2010). [Google Scholar]
- 18.Ding H., Millet L. J., Gillette M. U., Popescu G., “Actin-driven cell dynamics probed by Fourier transform light scattering,” Biomed. Opt. Express 1(1), 260–267 (2010). 10.1364/BOE.1.000260 [DOI] [PMC free article] [PubMed] [Google Scholar]
- 19.M. Born and E. Wolf, Principles of Optics: Electromagnetic Theory of Propagation, Interference and Diffraction of Light (Cambridge University Press, Cambridge, 1999). [Google Scholar]
- 20.A. C. Kak and M. Slaney, Principles of Computerized Tomographic Imaging (Society for Industrial and Applied Mathematics, Philadelphia, 2001). [Google Scholar]
- 21.Popescu G., Ikeda T., Dasari R. R., Feld M. S., “Diffraction phase microscopy for quantifying cell structure and dynamics,” Opt. Lett. 31(6), 775–777 (2006). 10.1364/OL.31.000775 [DOI] [PubMed] [Google Scholar]
- 22.Park Y., Best-Popescu C. A., Dasari R. R., Popescu G., “Light scattering of human red blood cells during metabolic remodeling of the membrane,” J. Biomed. Opt. 16(1), 011013 (2011). 10.1117/1.3524509 [DOI] [PMC free article] [PubMed] [Google Scholar]
- 23.Park Y., Diez-Silva M., Fu D., Popescu G., Choi W., Barman I., Suresh S., Feld M. S., “Static and dynamic light scattering of healthy and malaria-parasite invaded red blood cells,” J. Biomed. Opt. 15(2), 020506 (2010). 10.1117/1.3369966 [DOI] [PMC free article] [PubMed] [Google Scholar]


