

Abstract
Background
As a result of the advances in skin imaging technology and the development of suitable image processing techniques, during the last decade, there has been a significant increase of interest in the computer-aided diagnosis of skin cancer. Automated border detection is one of the most important steps in this procedure as the accuracy of the subsequent steps crucially depends on the accuracy of this step.
Methods
In this article, we present an unsupervised approach to border detection in dermoscopy skin lesion images based on a modified version of the JSEG algorithm.
Results
The method is tested on a set of 100 dermoscopy images. The border detection error is quantified by a metric that uses manually determined borders from a dermatologist as the ground truth. The results are compared with three other automated methods and manually determined borders by a second dermatologist.
Conclusion
The results demonstrate that the presented method achieves both fast and accurate border detection in dermoscopy images.
Keywords: computer-aided diagnosis, skin cancer, dermoscopy, border detection
Malignant melanoma has consistently been one of the most rapidly increasing cancers of all, with an estimated incidence of 59,580 and an estimated total of 7770 deaths in the United States in 2005 (1). Early diagnosis is particularly important as melanoma can be cured with a simple excision if detected early.
This study uses contact dermoscopy images. Contact dermoscopy is a non-invasive imaging technique using a glass plate and alcohol, gel or oil immersion, which renders the skin translucent, thus allowing a better visualization of the surface and subsurface structures. A systematic review covering Medline entries from 1983 to 1997 revealed that dermoscopy had 10–27% higher sensitivity (2). In a more recent meta-analysis (3), dermoscopy experts achieved a 49% increase in diagnostic accuracy when compared with clinical assessment, with results confirmed by other studies (4). However, it has been demonstrated that dermoscopy may actually lower the diagnostic accuracy in the hands of inexperienced dermatologists (5). Therefore, due to the lack of reproducibility and subjectivity of human interpretation, the development of computerized techniques is of utmost importance (6).
The first step in the computerized analysis of skin lesion images is the detection of the lesion borders. The importance of the border detection for the analysis is twofold. First, the border structure provides important information for accurate diagnosis. Many clinical features such as asymmetry, border irregularity, and abrupt border cutoff are calculated from the border. Second, the extraction of other important clinical features such as atypical pigment networks, globules, and blue-white areas critically depends on the accuracy of the border detection.
Automated border detection in dermoscopy images is a challenging task due to several reasons: (a) low contrast between the lesion and the surrounding skin, (b) irregular and fuzzy lesion borders, (c) artifacts such as skin texture, air bubbles, and hairs, and (d) variegated coloring inside the lesion.
Several methods have been developed for border detection in skin lesion images, with many previous efforts dealing with clinical images (7). Here, we review the border detection methods applied to dermoscopy images. Gao et al. (8) have proposed a method based on a stabilized inverse diffusion equation, a form of non-linear diffusion. Schmid (7) proposed a technique based on color clustering. First, a 2D histogram is calculated from the first two principal components of the CIE L*u*v* color space. Then, the histogram is smoothed and initial cluster centers are determined from the peaks using a perceptron classifier. Finally, the lesion image is segmented using a modified version of the fuzzy c-means clustering algorithm. Donadey et al. (9) presented a supervised method based on intensity radial profiles calculated from the I (intensity) component of the HSI space. Haeghen et al. (10) proposed a very simple supervised method that exploits the CIE L*a*b* color space. In this method, the background skin color is determined from a rough outer border drawn by the user. This initial border is then shrunk as long as the local color is similar to the background skin color.
In this paper, we present an unsupervised approach to border detection in dermoscopy images based on a modified version of the JSEG algorithm (11). We adapted the JSEG algorithm to this problem due to its flexibility and good performance in a variety of domains such as natural scenery (11), colonoscopy images (12), tongue images (13), etc.
Materials and Methods
Overview of the JSEG algorithm
In this subsection, we briefly introduce the JSEG algorithm. The basic idea of the algorithm is to separate the segmentation process into two independent phases: color quantization and spatial segmentation. In the first phase, colors in the image are quantized to several representative classes that can be used to differentiate regions in the image. Each pixel's color is then replaced with its class label, thus forming a class map of the image. The class map can be viewed as a special kind of texture composition. The value of each point in the class map is the image pixel position (x, y). In the following, a criterion for good segmentation using these spatial data points is proposed.
Let Z be the set of all N data points in the class map. Let z = (x,y), z ε Z,and m be the mean,
| (1) |
Suppose Z is classified into C classes, Zi, i = 1,…, C. Let mi be the mean of the Ni data points of class Zi,
| (2) |
Let Si be the within-class scatter for class Zi,
| (3) |
and ST be the total scatter of all N points,
| (4) |
Define SW as the sum of within-class scatter for all C classes,
| (5) |
The total scatter ST can be defined as the sum of the within-class scatter SW and between-class scatter SB:
| (6) |
Define
| (7) |
The motivation for the definition of J criterion comes from the Fisher's multiclass linear discriminant analysis (14). The J value provides an important measure: the ratio of interclass to intraclass variability. For the case of an image that consists of several homogeneous regions, the color classes are more separated from each other and the value of J is large. Applying the criterion to local windows in the class-map results in the J images, in which high and low values correspond to possible region boundaries and region centers, respectively.
In the second phase, a multi-scale region-growing method is used to segment the image based on the J images. This often results in oversegmentation. These initial regions are merged based on their color similarity in the CIE L*u*v* color space to give the final segmentation result.
Preprocessing
In this subsection, we describe the preprocessing steps that facilitate the border detection procedure namely, image smoothing, color quantization, and approximate border localization.
Image smoothing
Dermoscopy images often contain extraneous artifacts such as skin texture, air bubbles, and hairs around the lesion. These artifacts might reduce the accuracy of the border detection and increase the computational time. In order to mitigate the effects of these artifacts on the border detection, the images should be preprocessed with a smoothing filter.
In the original JSEG algorithm, a non-linear, edge-preserving filter called the peer group filter (15) is used to smooth the images before segmentation. This filter replaces each pixel with the weighted average of its peer group members, which are classified based on color similarity of the neighboring pixels in the CIE L*u*v* color space. However, due to its edge-preserving nature, this filter also preserves the above-mentioned artifacts. In order to overcome this drawback, we use a color median filter (16) with an 11 × 11 kernel to smooth the images before border detection.
Color quantization
Typical 24-bit color images have thousands of colors, which are difficult to handle directly. For this reason, color quantization is commonly used as a preprocessing step for color image segmentation (17). In the original JSEG algorithm, a modified version of the generalized Lloyd algorithm (GLA) (15) is used for color quantization. The purpose is to extract a few representative colors that can be used to differentiate neighboring regions in an image. As a result of the quantization, the number of colors in a typical natural scene image is reduced to 10–20.
As a result of experiments, we determined that the modified GLA quantization reduces the number of colors in dermoscopy images to four on the average. However, such a coarse quantization is not appropriate for our purposes. The algorithm often assigns the same colors to regions from the inner lesion border and the surrounding skin (see Fig. 1), which results in these regions being merged at the segmentation stage. Therefore, in order to avoid including background skin regions in the lesion area, the quantization should be finer. Empirically, we determined that quantization to 20 colors is adequate for accurate border detection.
Fig. 1.

Melanoma (a) original image (62,201 colors), (b) GLA quantization result (five colors).
A second problem with the modified GLA quantization is its high computational demand. For our image set, the time spent on quantization is on the average 20% of the total time. Therefore, we decided to use a faster quantization algorithm, which is known as the variance-based quantization algorithm (18). This algorithm has been compared with other popular quantization algorithms such as median cut, local k means, octree, Kohonen SOM, pairwise clustering, etc. and was found to be both fast and effective (18, 19, 20).
Approximate lesion localization
Although dermoscopy images can be quite large, the actual lesion often occupies a relatively small area. For this reason, if we can determine the approximate location of the lesion, the border detection algorithm can focus on this region rather than the whole image. This has two potential benefits: (i) an increase in border detection accuracy as the procedure is not distracted by non-lesion regions such as the lentigines and (ii) a reduction in computational time.
In order to determine the approximate location of the lesion, we first convert the 24-bit RGB color image into an 8-bit luminance image. We then convert the luminance image into a binary image using the Otsu thresholding method (21). After thresholding, we apply an iterative connected component labeling algorithm to identify the regions in the binary image. We retain the largest region as the lesion and calculate its bounding box. For some images, the largest region in the binary image is slightly smaller than the actual lesion because the noisy pixels around the border are classified as background by the thresholding algorithm. Also, dermatologists tend to expand borders until the background skin color is reached, whereas the automated methods tend to find borders at significant color changes. Therefore, we expand the bounding box incrementally (maximum 50 pixels in each direction) as long as it does not go beyond the image frame.
Segmentation and postprocessing
After the color quantization, each pixel's color is replaced with its class label (i.e. the color assigned by the quantization algorithm), thus forming a class map of the image. The J value calculated over a local area of the class map is a good indicator of whether that area is in the region interiors or near region boundaries. We can now construct an image whose pixel values correspond to these J values calculated over small windows. For convenience, we refer to these images as J images and the corresponding values as local J values.
A multi-scale region-growing method is used to segment the image based on the J images. The algorithm starts at a coarse initial scale. It then repeats the same process on the newly segmented regions at the next finer scale. Region growing consists of determining the seed points (minima of the J images) and growing from those seed locations. This often results in oversegmentation. These initial regions are merged based on their color similarity in the CIE L*u*v* color space to give the final segmentation result. The advantage of the CIE L*u*v* space over the RGB space is that the former is approximately perceptually uniform, that is, the measured and perceived color similarities are proportional, while the latter does not have this property (22).
The size of the local window determines the size of image regions that can be detected. Table 1 gives the window sizes used at different scales. As images often contain objects of various sizes, multiple scales may be needed for segmentation. The algorithm determines the initial scale based on the image size and reduces the scale to refine the segmentation results. Figure 2 shows a dermoscopy image segmented at various scales. It can be seen that at scales 3 and 4, some lesion regions are not detected and some parts of the lesion are included in the same segments with the background skin regions. At scales 1 and 2, all of the regions are detected. Note that all of these results require postprocessing in order to find the lesion border.
TABLE 1.
Window size at different scales
| Scale | Window size | Minimum seed size (pixels) |
|---|---|---|
| 1 | 9 × 9 | 32 |
| 2 | 17 × 17 | 128 |
| 3 | 33 × 33 | 512 |
| 4 | 65 × 65 | 2048 |
Fig. 2.

Lentigo segmented at scales (a) 4, (b) 3, (c) 2, and (d) 1.
Table 2 gives the initial (max_scale) and final scales (min_scale) that are used to segment an image of size n pixels. In our image set, the images have a minimum size of 768 × 512 pixels. The algorithm starts at an initial scale of 4 and stops the iteration after final scale 3. However, as Fig. 2 demonstrates, at scale 3 the algorithm misses some of the small regions that are part of the lesion. As a result of experiments, we determined that segmentation at scales 1 and 2 gives similar results. However, segmentation at scale 1 is computationally faster as the window size is smaller. Consequently, we use scale 1 for the spatial segmentation phase.
TABLE 2.
Minimum/maximum scales for different image sizes
| n (pixels) | max_scale | min_scale | # scales |
|---|---|---|---|
| >512 × 512 | 4 | 3 | 2 |
| >256 × 256 | 3 | 2 | 2 |
| >128 × 128 | 2 | 2 | 1 |
| >64 × 64 | 1 | 1 | 1 |
The segmented image often contains regions that are part of the background skin. In order to eliminate these regions, we first need to determine the background skin color. Here, we follow the approach described in (23). We take four windows of size 10 × 10 pixels from the four corners of the image and calculate the mean L*, u*, v* of the pixels. We use this mean color as an estimate of the background skin color. Then, we eliminate regions whose mean color has a distance less than an empirical threshold of 17 to the background skin color. Finally, after eliminating the isolated regions and merging the remaining regions, we obtain the final border detection result. Figure 3 shows the image in Fig. 2d after postprocessing.
Fig. 3.
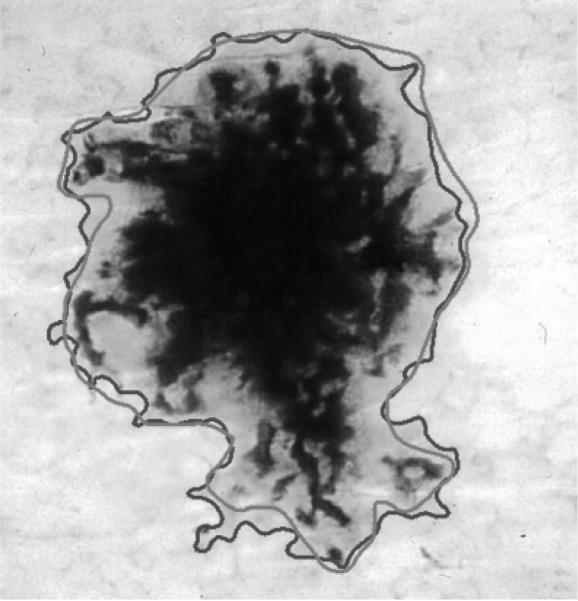
Final border detection result (error = 9.64%) (blue, Automaticborder; green, Manualborder).
Results and Discussion
The proposed method is tested on a set of 100 dermoscopy images (30 invasive malignant melanoma and 70 benign) obtained from the EDRA Interactive Atlas of Dermoscopy (24) and the dermatology practices of Dr Ashfaq Marghoob (New York, NY), Dr Harold Rabinovitz (Plantation, FL), and Dr Scott Menzies (Sydney, Australia). These are 24-bit color images in JPEG format with dimensions ranging from 768 × 512 to 2556 × 1693 pixels. The benign lesions included nevocellular nevi and benign dysplastic nevi.
Determining the ground truth
As a ground truth to compare the automatic borders against, manual borders are obtained by first selecting a number of points on the lesion border and then, connecting these points by a second-order B-spline and finally filling the resulting closed curve. Two sets of manual borders are obtained by dermatologists Dr William Stoecker and Dr Joseph Malters using this method.
Comparison with other automated methods
The proposed method is compared with three other automated techniques: one based on optimized histogram thresholding (25), the other based on gradient vector flow (GVF) snakes (26), and another one based on thresholding, followed by region growing (27, 28). In this subsection, for completeness, we briefly describe these methods.
In the first method, the lesion areas in each of the RGB planes are determined by optimized histogram thresholding and the union of these areas is taken as the preliminary segmentation result. This preliminary image is smoothed using an iterative median filter and then the holes and islands (isolated regions) are eliminated using mathematical morphology to obtain the final border detection result.
In the second method, GVF snakes with an automatic initialization scheme are used. In this method, the image is first preprocessed using Gaussian blurring with a 15 × 15 kernel applied to the luminance image. The resulting grayscale image is then thresholded using the Otsu method relaxed by 10 gray levels to initialize the snake relatively close to the actual lesion border. After the snake converges, this initial border is expanded by 9 pixels in the normal direction. This is done because the snake tends to find the sharpest pigment change and the dermatologists choose the outmost detectable pigment.
In the third method, `dermatologist-like tumor extraction algorithm' (DTEA), first, the blue plane of the lesion image is thresholded using the Otsu method. The regions in the resulting binary image are then identified using connected component labeling. After labeling, regions smaller than a threshold size are merged with the neighboring regions. The region that satisfies certain heuristic criteria (28) is taken as the initial lesion area. Finally, as the initial lesion area is smaller than the actual lesion area for most images, it is expanded by an iterative region-growing method to obtain the final border detection result.
Quantification of border detection error
Using the manually determined borders from one of the dermatologists (Dr Stoecker), the automatic borders obtained from the four automated methods (the proposed method, the optimized histogram thresholding method, the GVF snakes method, and the DTEA method) and the manual borders from the other dermatologist (Dr Malters) are compared using the grading system developed by Hance et al. (29). Here, the percentage border error is given by
| (8) |
where AutomaticBorder is the binary image obtained by filling the automatic detected border; ManualBorder is the binary image described in the first subsection; XOR is the exclusive-OR operation that gives the pixels for which the AutomaticBorder and ManualBorder disagree; and Area (ManualBorder) is the number of pixels in the ManualBorder.
Table 3 gives the mean, standard deviation, and median border error for the five approaches for the benign and melanoma groups in the image set. It can be seen that the mean error obtained by the manually determined borders from the second dermatologist is less than that obtained by the four automated methods. Among the automated methods, the DTEA method and the proposed method achieve the lowest mean errors (10.75% and 10.78%, respectively) for the benign group. On the other hand, for the melanoma group, the proposed method achieves the lowest mean error (14.91%), which is followed by the DTEA method (18.71%), while for the benign group, the lowest mean error obtained by the automated methods (10.75%) comes close to the error obtained by the second dermatologist (8.71%); the discrepancy between the automated methods and the second dermatologist is greater for the melanoma group: 14.91% vs. 8.13%. This is probably due to the presence of higher border irregularity and color variegation in the melanoma lesions.
TABLE 3.
Percentage border error statistics for each border detection method
| Benign group (70 images) |
Melanoma group (30 images) |
|||||
|---|---|---|---|---|---|---|
| Method | Mean | Standard deviation | Median | Mean | Standard deviation | Median |
| Second dermatologist | 8.71 | 3.78 | 7.80 | 8.13 | 3.99 | 6.77 |
| Histogram thresholding | 19.87 | 59.53 | 10.40 | 91.96 | 234.46 | 21.99 |
| GVF snakes | 13.77 | 5.61 | 12.32 | 19.76 | 8.60 | 18.37 |
| DTEA | 10.75 | 5.18 | 8.95 | 18.71 | 19.85 | 11.95 |
| Proposed method | 10.78 | 6.28 | 8.82 | 14.91 | 8.40 | 12.91 |
GVF, gradient vector flow; DTEA, dermatologist-like tumor extraction algorithm.
Examination of the standard deviation values in Table 3 reveals that the manually determined borders from the second dermatologist result in percentage border error values with a low standard deviation (3.78% and 3.99% for the benign and melanoma groups, respectively), indicating the consistency between the borders determined manually by the two dermatologists.
Among the automated methods, the histogram thresholding method is the least consistent for both benign (59.53% standard deviation) and melanoma groups (234.46% standard deviation). On the other hand, for the benign group the DTEA method is the most consistent (5.18% standard deviation), while for the melanoma group the proposed method is the most consistent (8.40% standard deviation).
Table 4 shows the number of images with percentage border error less than 10%, 20%, 30%, and 40% for the automated methods. It can be seen that, for the proposed method, 86 of the 100 images have <20% border error, 98 images have less than 30% border error, and all of the 100 images have <40% border error. The DTEA method performs similarly, with the exception that three images have more than 40% error. Therefore, it can be concluded that the proposed method performs the best among the automated methods, while the DTEA method follows it closely. On the other hand, the histogram thresholding method performs the worst among the automated methods.
TABLE 4.
Distribution of mean percentage border error for the automated methods over the whole image set (100 images)
| Mean percentage border error |
||||
|---|---|---|---|---|
| Method | ≤ 10 | ≤ 20 | ≤ 30 | ≤ 40 |
| Histogram thresholding | 38 | 71 | 87 | 93 |
| GVF snakes | 22 | 76 | 96 | 99 |
| DTEA | 54 | 85 | 97 | 97 |
| Proposed method | 50 | 86 | 98 | 100 |
GVF, gradient vector flow; DTEA, dermatologist-like tumor extraction algorithm.
Conclusion
In this paper, we presented an unsupervised approach to border detection in dermoscopy images based on a modified version of the JSEG algorithm. The proposed approach comprised of three main phases: preprocessing, segmentation, and postprocessing. The method was tested on a set of 100 dermoscopy images (30 melanoma and 70 benign). Manually determined borders from a dermatologist (Dr Stoecker) were used as the ground truth. The border detection error was quantified by a metric developed by Hance et al. (29) computed as the number of pixels for which the automatic and manual borders disagree divided by the number of pixels in the manual border. The results were compared with three other automated methods and manually determined borders from a second dermatologist (Dr Malters).
The method presented here is a candidate algorithm for the border detection module of an automated diagnosis system that is scheduled for clinical trials in the United States in 2007. The method performs at least as well as the other automated methods on a set of 100 images in the first iteration. A classifier can be used to obtain a second iteration, yielding even better accuracy.
The proposed method has several limitations. First, for some images the bounding box determined by the approximate lesion localization method does not completely contain the lesion. In such cases, only part of the border that is contained in the bounding box can be detected. We are currently working on an improved method to determine the bounding box, which may help in improving the border detection results. A second problem is that the proposed method may not perform well on images with significant amount of hair. In such cases, parts of the detected border may follow the hair directions. For such images, a preprocessor that eliminates hairs such as the DullRazor (30) might be helpful. Finally, the use of borders determined by a single dermatologist likely introduces error. The choice of which dermatologist's borders to use as gold standard becomes arbitrary. Joel et al. (31) have emphasized that dermatologist-determined borders are not precise, with inter-dermatologist borders and even borders determined by the same dermatologist at different times showing significant disagreement, so that a probabilistic model of the border is preferred to an absolute gold-standard model.
Acknowledgments
The first two authors were supported by grants from NSF (#0216500-EIA), Texas Workforce Commission (#3204600182), and James A. Schlipmann Melanoma Cancer Foundation. The third and sixth authors were supported by a NIH-SBIR grant 1R43 CA-101639-01. The fourth and fifth authors were supported by grant-in-aid for young scientists from Japan Society for the Promotion of Science (B-17790788). The assistance of Joseph M. Malters, M.D., in obtaining the manual borders is gratefully acknowledged.
References
- 1.Jemal A, Murray T, Ward E, et al. Cancer statistics 2005. CA: Cancer J Clinicians. 2005;55:10–30. doi: 10.3322/canjclin.55.1.10. [DOI] [PubMed] [Google Scholar]
- 2.Mayer J. Systematic review of the diagnostic accuracy of dermoscopy in detecting malignant melanoma. Med J Aust. 1997;167:206–210. doi: 10.5694/j.1326-5377.1997.tb138847.x. [DOI] [PubMed] [Google Scholar]
- 3.Kittler H, Pehamberger K, Wolff K, Binder M. Diagnostic accuracy of dermoscopy. Lancet Oncol. 2002;3:159–165. doi: 10.1016/s1470-2045(02)00679-4. [DOI] [PubMed] [Google Scholar]
- 4.Stolz W, Braun-Falco O, Bilek P, Landthaler M, Burgdorf WHC, Cognetta AB. Color atlas of dermatoscopy. 2nd edn. Blackwell Wissenschafts-Verlag; Berlin, Germany: 2002. [Google Scholar]
- 5.Binder M, Schwarz M, Winkler A, Steiner A, Kaider A, Wolff K, Pehamberger H. Epiluminescence microscopy. A useful tool for the diagnosis of pigmented skin lesions for formally trained dermatologists. Arch Dermatol. 1995;131:286–291. doi: 10.1001/archderm.131.3.286. [DOI] [PubMed] [Google Scholar]
- 6.Fleming MG, Steger C, Zhang J, Gao J, Cognetta AB, Pollak I, Dyer CR. Techniques for a structural analysis of dermatoscopic imagery. Computerized Med Imaging Graphics. 1998;22:375–389. doi: 10.1016/s0895-6111(98)00048-2. [DOI] [PubMed] [Google Scholar]
- 7.Schmid P. Segmentation of digitized dermatoscopic images by two-dimensional color clustering. IEEE Trans Med Imaging. 1999;18:164–171. doi: 10.1109/42.759124. [DOI] [PubMed] [Google Scholar]
- 8.Gao J, Zhang J, Fleming MG, Pollak I, Cognetta AB. Segmentation of dermatoscopic images by stabilized inverse diffusion equations. Proc Int Conf Image Process. 1998;3:823–827. [Google Scholar]
- 9.Donadey T, Serruys C, Giron A, Aitken G, Vignali J-P, Triller R, Fertil B. Boundary detection of black skin tumors using an adaptive radial-based approach. SPIE Med Imaging. 2000;3379:810–816. [Google Scholar]
- 10.Haeghen YV, Naeyaert JM, Lemahieu I. Development of a dermatological workstation: preliminary results on lesion segmentation in CIE LAB color Space. Proceedings of the First International Conference on Color in Graphics and Image Processing.2000. [Google Scholar]
- 11.Deng Y, Manjunath BS. Unsupervised segmentation of color-texture regions in images and video. IEEE Trans Pattern Analysis Machine Intelligence. 2001;23:800–810. [Google Scholar]
- 12.Cao Y, Li D, Tavanapong W, Wong J, Oh J, Groen PC. Parsing and browsing tools for colonoscopy videos. Proceedings of the 12th Annual ACM International Conference on Multimedia.2004. pp. 844–851. [Google Scholar]
- 13.Wang Y, Zhou Y, Yang J, Wang Y. JSEG based color separation of tongue image in traditional Chinese medicine. Proc 9th Iberoamerican Congress Pattern Recognition.2004. pp. 503–508. [Google Scholar]
- 14.Duda RO, Hart PE, Stork DG. Pattern classification. Wiley Interscience; Wiley, NY: 2000. [Google Scholar]
- 15.Deng Y, Kenney C, Moore MS, Manjunath BS. Peer group filtering and perceptual color image quantization. Proc IEEE Int Symp Circuits Systems. 1999;4:21–24. [Google Scholar]
- 16.Umbaugh SE. Computer imaging: digital image analysis and processing. CRC Press; Boca Raton, FL: 2005. [Google Scholar]
- 17.Celenk M. A color clustering technique for image segmentation. Computer Vis Graphics Image Process. 1990;52:145–170. [Google Scholar]
- 18.Wan SJ, Prusinkewicz P, Wong SKM. Variance-based color image quantization for frame buffer display. Color Res Appl. 1990;15:52–58. [Google Scholar]
- 19.Velho L, Gomes J, Sobreiro MVR. Color image quantization by pairwise clustering. Proc 10th Brazilian Symp Computer Graphics Image Process. 1997;1:203–210. [Google Scholar]
- 20.Verevka O, Buchanan JW. Local k-means algorithm for color image quantization. Proc Graphics Interface Conf. 1995;1:128–135. [Google Scholar]
- 21.Sankur B, Sezgin M. A survey over image thresholding techniques and quantitative performance evaluation. J Electr Imaging. 2004;13:146–165. [Google Scholar]
- 22.Wyszecki G, Stiles WS. Color science: concepts and methods, quantitative data and formulae. John Wiley & Sons Inc.; Wiley, NY: 2000. [Google Scholar]
- 23.Xu L, Jackowski M, Goshtasby A, Roseman D, Bines S, Yu C, Dhawan A, Huntley A. Segmentation of skin cancer images. Image Vis Computing. 1999;17:65–74. [Google Scholar]
- 24.Argenziano G, Soyer HP, De Giorgi V, et al. Dermoscopy: a tutorial. EDRA Medical Publishing & New Media; Milan, Italy: 2002. [Google Scholar]
- 25.Pagadala P. MS Thesis. Department of Electrical and Computer Engineering, University of Missouri-Rolla; 1998. Tumor border detection in epiluminescence microscopy images. [Google Scholar]
- 26.Erkol B, Moss RH, Stanley RJ, Stoecker WV, Hvatum E. Automatic lesion boundary detection in dermoscopy images using gradient vector flow snakes. Skin Res Technol. 2005;11:17–26. doi: 10.1111/j.1600-0846.2005.00092.x. [DOI] [PMC free article] [PubMed] [Google Scholar]
- 27.Iyatomi H, Oka H, Tanaka M, Hagiwara M, Ogawa K. Practical web-based screening system for early stage of malignant melanoma. Proc Third Int Conf Info (INFO2004) 2004:628–631. [Google Scholar]
- 28.Iyatomi H, Oka H, Saito M, et al. Quantitative assessment of tumor extraction from dermoscopy images and evaluation of computer-based extraction methods for automatic melanoma diagnostic system. Melanoma Res. 2006;16:183–190. doi: 10.1097/01.cmr.0000215041.76553.58. [DOI] [PubMed] [Google Scholar]
- 29.Hance GA, Umbaugh SE, Moss RH, Stoecker WV. Unsupervised color image segmentation with application to skin tumor borders. IEEE Eng Med Biol. 1996;15:104–111. [Google Scholar]
- 30.Lee TK, Ng V, Gallagher R, Coldman A, McLean D. Dullrazor: a software approach to hair removal from images. Computers Biol Med. 1997;27:533–543. doi: 10.1016/s0010-4825(97)00020-6. [DOI] [PubMed] [Google Scholar]
- 31.Joel G, Schmid-Saugeon P, Guggisberg D, et al. Validation of segmentation techniques for digital dermoscopy. Skin Res Technol. 2002;8:240–249. doi: 10.1034/j.1600-0846.2002.00334.x. [DOI] [PubMed] [Google Scholar]