Abstract
Background
The impulse oscillometry is increasingly used for assessing the oscillatory mechanics of the respiratory system. The within-breath behaviour of the oscillatory mechanics in chronic obstructive pulmonary disease (COPD) is a well-known physiological feature. The purpose of this study was to develop a new approach for assessing this feature using impulse oscillometry.
Methods
The oscillatory mechanics were assessed by a commercially available impulse oscillometry device. The respiratory system resistance (Rrs) and reactance (Xrs) were measured during tidal breathing in patients with COPD (n=39) and healthy subjects (n=5). Selected data, the Rrs at 5 Hz (R5), Rrs at 20 Hz (R20), Xrs at 5 Hz (X5), and resonant frequency of Xrs (Fres) every 0.2 s, were extracted from the device. These data were divided into eight time fractions during the respiratory cycle to form averaged respiratory phases.
Results
The time courses of the R5 and X5 were notably dependent on the respiratory cycles in patients with COPD, while there was little such dependency in healthy subjects. Irrespective of respiratory phase, R5 and Fres increased, and X5 fell to a more negative level in patients with COPD in a severity-dependent fashion. The increase in the R5 and negative level in the X5 were more prominent in the middle of the expiratory phase. The severity dependence in the R20 was relatively small compared with that in the R5.
Conclusions
The results of this study suggest that impulse oscillometry can assess the within-breath behaviour of the oscillatory mechanics with high temporal resolution, which may be helpful for evaluating the severity of COPD. Further studies are needed to reveal which biomarkers obtained with this approach would be suitable for evaluating the airway obstruction.
Article summary
Article focus
To develop a new approach for assessing the within-breath behaviour of the oscillatory mechanics in patients with chronic obstructive pulmonary disease (COPD) using impulse oscillometry.
Key messages
Impulse oscillometry provides a means of evaluating within-breath behaviour of oscillatory mechanics at high temporal resolution. Since it is possible that the oscillatory flow resistance varies markedly within a breathing cycle in patients with COPD, differences between the inspiratory and expiratory phases must be taken into account.
Strengths and limitations of this study
The within-breath behaviour of the oscillatory mechanics can be assessed by a commercially available impulse oscillometry device.
Owing to the small number of subjects, the findings related to the pathophysiology of COPD were very limited.
Introduction
The forced oscillation technique (FOT) is a simple method for assessing the oscillatory flow resistance of the respiratory system, and has provided important findings in respiratory physiology.1–3 Currently, the FOT using impulses, impulse oscillometry (IO), is increasingly used in clinical research. IO enables one to measure the respiratory system impedance (Zrs), which consists of the real part as resistance (Rrs) and the imaginary part as reactance (Xrs) over a wide range of the oscillatory frequency.4 A number of studies have demonstrated that the IO is able to identify airway obstruction.5 However, whether it could be expected to play an important role to screen, diagnose, staging, and control obstructive diseases such as chronic obstructive pulmonary disease (COPD) and bronchial asthma is controversial and currently under discussion.
In patients with obstructive diseases, the oscillatory flow resistance of the respiratory system tends to be increased with the degree of the airway obstruction, resulting in an increase in Rrs and negative values in Xrs.6 In patients with COPD, owing to the airway narrowing during tidal expiration,7 the oscillatory properties are also characterised by significantly different Rrs and Xrs in the inspiratory and expiratory phases.8 Rrs is higher, and Xrs is more negative during expiration than inspiration in most patients with COPD. Recently, Paredi et al reported that inspiratory–expiratory Xrs analysis (5 Hz) using IO differentiated patients with bronchial asthma from those with COPD.9 Other studies also have focused on the different oscillatory properties between the respiratory phases of patients with COPD and those with bronchial asthma.10 11
The temporal resolution of IO is determined mainly by the duration of the oscillatory pressure and flow in signal processing, which is closely related to the interval of the impulse occurrence or minimal oscillatory frequency in the evaluation. In a commercially available IO (Master Screen-IOS; CareFusion, Germany), the interval of the impulse occurrence is 0.2 s, which enables evaluation of the within-breath behaviour of the oscillatory mechanics with high temporal resolution. Since the oscillatory mechanics have different physiological features between the inspiratory and expiratory phases, especially in patients with obstructive diseases, such an approach may provide a new insight into the underlying pathophysiology of obstructive diseases.
In the present study, we report a new approach using IO for assessing the within-breath behaviour of the oscillatory mechanics during tidal breathing. Based on our methods that were originally developed using raw Rrs and Xrs data retrieved from a commercially available IO device, eight moments during the respiratory cycle were produced and studied to elucidate the within-breath behaviour. Using this approach, we studied the relationship between the within-breath behaviour and the COPD severity. This approach may reveal technical advances in IO and establish an approach for evaluating the physiological features in respiration in patients with COPD.
Methods
Subjects
Thirty-nine patients with COPD were recruited at Tohoku University Hospital. They were diagnosed by an author (KH or OH) as having COPD based on the global initiative for COPD guidelines.12 Based on the guidelines, the COPD severity was estimated and classified into four groups. All patients were ex-smokers and under medical management at Tohoku University Hospital and had been clinically stable for at least 1 month. Five healthy never-smokers were also recruited. The present study was approved by the Tohoku University Medical Ethics Committee, and informed consent was obtained prior to inclusion in this study.
IO measurement and analysis
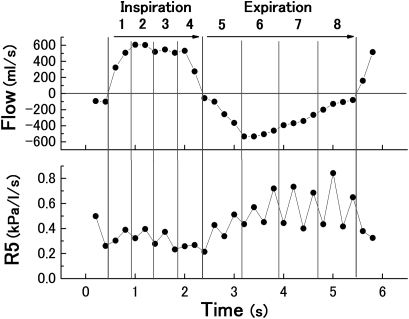
The oscillatory mechanics were assessed using a commercially available IO device (Master Screen-IOS; CareFusion, Germany). Continuous impulses (pyramidal-form pulses, 5 pulses/s), which contained sinusoidal waves of a broad-frequency spectrum, were applied as the forced oscillation. The impulse pressure was produced with alternate changes in two directions (positive and negative). The respiratory system impedance (Zrs), ratio of the mouth pressure to airflow according to the impulses, the Rrs, its real component, and the Xrs, its imaginary component, were automatically calculated using the attached software including fast Fourier transform analysis (LAB manager, CareFusion; version 4.65). The R5 (Rrs at 5 Hz), R20 (Rrs at 20 Hz), X5 (Xrs at 5 Hz) and Fres (resonant frequency of Xrs) were provided as real-time data. The comma-separated value data files showing the serial values of each component by every 0.2 s were extracted after the measurements. After the comma-separated value data files were opened on our personal computers, every impulse data point was labelled as inspiratory or expiratory phase based on the spontaneous airflow direction. Quartile time fractions numbered 1–4 were set and added to the label as respiratory phase 1 to 4 and phase 5 to 8, respectively (figure 1).
Figure 1.
Traces drawn based on digital data obtained every 0.2 s from the impulse oscillometry measurement. The respiratory cycle was separated into inspiration and expiration according to spontaneous airflow data (upper panel), and quartile time fractions 1 to 4 and 5 to 8 were labelled. The lower panel is an example of impulse oscillometry data assigned to eight fractions of Rrs at 5 Hz (R5).
Protocols and statistics
The IO measurement was performed in the sitting position. The subjects were advised to breathe quietly from a mouth piece while wearing a nose-clip during the measurements. The cheeks of the subjects were supported by the investigator's hands. After the stable spontaneous volume and airflow of the subjects were monitored and confirmed, those were recorded for approximately 40 s. Following the IO measurement, spirometry was performed using a rolling seal-type apparatus (CHESTAC-7800; CHEST, Tokyo, Japan). To avoid any effect of forced expiratory manoeuvres on the airway, spirometry was never performed prior to the FOT measurement. Predictive values of vital capacity, forced vital capacity and forced expiratory volume in 1 s (FEV1) were calculated using the equations reported by the Japanese Respiratory Society.13
The results are presented as mean or mean±SD. For comparison of the anthropometric and spirometric parameters, the Kruskal–Wallis test was used. For comparison of the time courses of the IO parameters among eight fractions, the Friedman test and two-way repeated measure of analysis of variance (ANOVA) were used. To study the relationships between IO and spirometric parameters, Pearson correlation coefficients were calculated. These analyses were performed using statistical software (SPSS V.11.5.1 J). A p value of <0.05 was considered statistically significant.
Results
All the subjects underwent the IO measurements and spirometry. The characteristics of the anthropometric and spirometric parameters are shown in table 1. The differences in the anthropometric parameters were not significant. Statistical differences were observed in spirometric parameters among the five groups. Breathing patterns of the subjects during the measurement are shown in table 2.
Table 1.
Anthropometric and spirometric indices in healthy subjects and in patients with chronic obstructive pulmonary disease
| Healthy | Chronic obstructive pulmonary disease |
p Value | ||||
| Stage I | Stage II | Stage III | Stage IV | |||
| n | 5 | 4 | 11 | 13 | 11 | – |
| Male/female | 2/3 | 4/0 | 11/0 | 13/0 | 11/0 | – |
| Age (years) | 68±12 | 67±16 | 71±8 | 72±7 | 68±11 | NS |
| Height (cm) | 158±9 | 165±4 | 161±7 | 164±6 | 163±8 | NS |
| Weight (kg) | 57±5 | 56±8 | 57±10 | 56±11 | 54±11 | NS |
| Vital capacity (l) | 3.2±1.3 | 4.1±1.0 | 3.4±0.3 | 2.9±0.7 | 2.6±0.7 | <0.05 |
| Percentage of vital capacity | 106±18 | 113±16 | 103±16 | 83±20 | 74±18 | <0.01 |
| FVC (l) | 3.2±1.2 | 4.2±0.9 | 3.2±0.4 | 2.8±0.7 | 2.2±0.6 | <0.01 |
| Percentage of FVC | 111±15 | 118±13 | 100±15 | 82±20 | 65±14 | <0.0001 |
| FEV1 (l) | 2.5±1.0 | 2.8±0.6 | 1.5±0.2 | 1.1±0.2 | 0.6±0.1 | <0.0001 |
| Percentage of FEV1 | 109±16 | 97±7 | 58±7 | 40±6 | 23±4 | <0.0001 |
| Percentage of G-FEV1 | 78±4 | 67±1 | 47±10 | 41±11 | 29±6 | <0.0001 |
Data are expressed as mean±SD. The Kruskal–Wallis test was used. Gaensler's FEV1% (G-FEV1%) was calculated by forced expiratory volume in 1 s (FEV1)/forced vital capacity (FVC)×100.
NS, no significant difference.
Table 2.
Breathing pattern of subjects during impulse oscillometry measurement
| Healthy | Chronic obstructive pulmonary disease |
||||
| Stage I | Stage II | Stage III | Stage IV | ||
| Number of breaths (/min) | 18.6±6.1 | 14.3±2.9 | 16.7±6.4 | 11.7±3.5 | 14.9±5.8 |
| Tidal volume (ml) | 630±410 | 557±227 | 944±333 | 792±309 | 841±383 |
| Inspiratory maximum flow (ml/s) | 580±335 | 425±155 | 886±274 | 635±160 | 800±267 |
| Expiratory maximum flow (ml/s) | 550±348 | 350±71 | 736±239 | 435±118 | 436±81 |
Data are expressed as mean±SD. ‘Inspiratory maximum flow’ and ‘Expiratory maximum flow’ denote the averaged peak value of inspiratory and expiratory flow, respectively, of each breathing cycle. All parameters were calculated by spontaneous flow or volume signals extracted from comma-separated value data during the measurements.
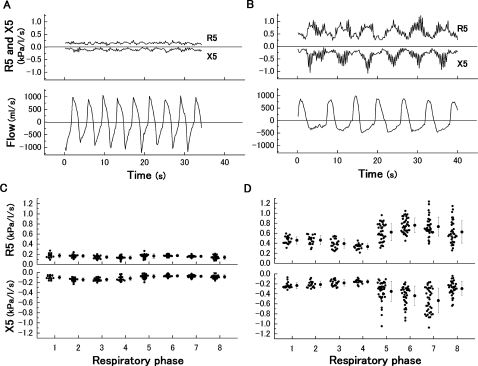
Figure 2A,B shows the typical time courses of the R5 and X5 with spontaneous airflow data in a healthy subject and a patient with severe COPD. In the patient with COPD, the periodical changes that seemed to be synchronised to the respiratory cycle were clearly observed. In contrast, these were relatively constant in the healthy subject. After dividing those raw data into eight fractions in the breath, the values among each fraction were averaged, showing the mean time course during the respiratory cycle (figure 2C,D). In the patient with COPD, both the R5 and X5 took a relatively steady course qualitatively during the inspiratory phase, whereas abrupt changes occurred during the expiratory phase. The range of SD in those parameters was extensive in the patient with COPD compared with the healthy subject. The mean values were defined as individual within-breath IO parameters.
Figure 2.
Typical time courses of R5 and X5 in (A) a healthy subject (male, 64 years, percentage forced expiratory volume in 1 s=102.9%) and (B) a patient with severe chronic obstructive pulmonary disease (male, 70 years, percentage forced expiratory volume in 1 s=22.7%) shown with spontaneous airflow. Averaged data among each fraction in the same case are shown in (C) (healthy) and (D) (chronic obstructive pulmonary disease). Data are expressed as raw data and mean±SD.
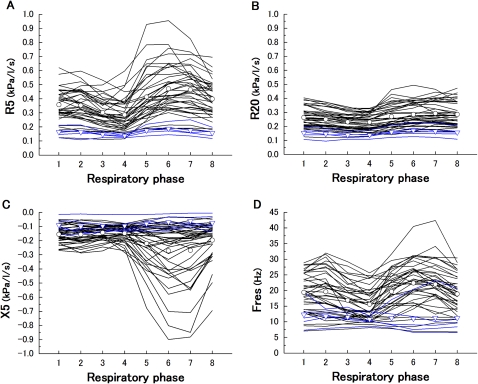
The within-breath IO selected parameters (R5, R20, X5 and Fres) in all subjects are shown in figure 3. From the results of the statistical analysis, these were significantly varied in eight respiratory phases except Fres in healthy subjects. In most of the patients with COPD, the R5 at respiratory phase 4 was lowest and at phase 6 or 7 was highest, whereas the R20 remained relatively constant. The X5 at respiratory phase 6 or 7 was more negative. The behaviour of Fres was similar to the R5. The variation of all the IO parameters in healthy subjects was significantly smaller than that in patients with COPD.
Figure 3.
Within-breath impulse oscillometry selected parameters, R5 (A), R20 (B), X5 (C) and Fres (D), versus respiratory phase in healthy subjects (blue line) and in patients with chronic obstructive pulmonary disease (COPD) (black line). The average values are also shown in healthy subjects (▿) and in patients with COPD (○). The Friedman test showed statistical significance (healthy R5, X5, p<0.01, R20, p=0.001, Fres, p=0.17; COPD R5, R20, X5, Fres, p<0.0001). These variation between healthy subjects and patients with COPD were also significantly difference (R5, p<0.0001, R20=0.001, X5, p<0.05, Fres, p<0.01).
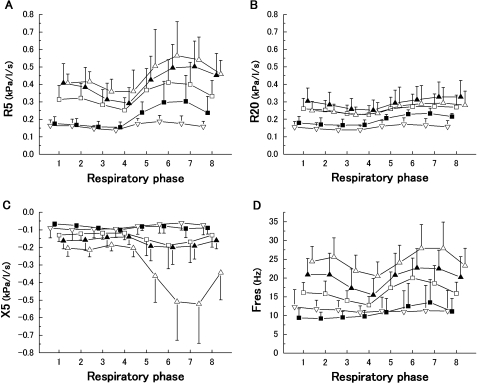
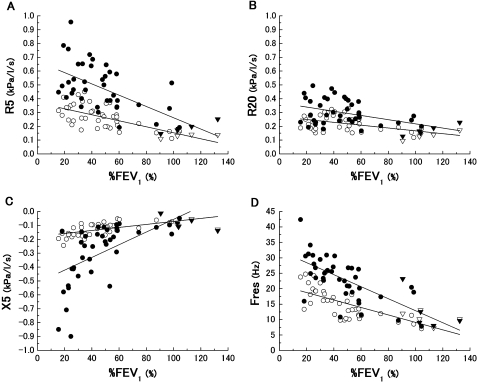
Figure 4 shows the effects of the severity of COPD on the within-breath IO parameters. The behaviours of these parameters showed significant differences among the five groups. Irrespective of the respiratory phase, the high values in the R5 and Fres, and negative values in the X5 were observed in the patients with severe COPD. In contrast to the R5, the severity dependence in the R20 was not clearly obtained. To evaluate the extent to which the IO parameters vary within the respiratory cycle, the nadir or peak parameters of the R5, R20, X5 and Fres during inspiratory and expiratory phases were plotted against the spirometric parameters in figure 5. All the parameters were significantly correlated with %FEV1. Although the extent of inspiratory nadir parameters was not prominent compared with the expiratory peak, they had significant slopes against %FEV1.
Figure 4.
Within-breath impulse oscillometry selected parameters, R5 (A), R20 (B), X5 (C) and Fres (D), versus respiratory phase according to chronic obstructive pulmonary disease severity (■, Stage I; □, Stage II; ▲, Stage III; ▵, Stage IV, respectively) and healthy subjects (▿). Data are expressed as mean±SD. Two-way ANOVA showed statistical significance among the five groups (R5, p<0.0001; R20, p<0.001; X5, p<0.0001; Fres, p<0.0001).
Figure 5.
Relationship of percentage forced expiratory volume in 1 s (%FEV1) against the inspiratory nadir values (▿, healthy; ○, chronic obstructive pulmonary disease) and expiratory peak values (▼, healthy; ●, chronic obstructive pulmonary disease) in R5 (A), R20 (B), X5 (C) and Fres (D) are shown. These impulse oscillometry parameters were significantly correlated with %FEV1 (R5 ▿○, r=−0.71; p<0.0001; ▼●, r=−0.65; p<0.0001; R20 ▿○, r=−0.50; p<0.001; ▼●, r=−0.47; p=0.001; X5 ▿○, r=0.65; p<0.0001; ▼●, r=0.64; p<0.0001; Fres ▿○, r=−0.72; p<0.0001; ▼●, r=−0.74; p<0.0001).
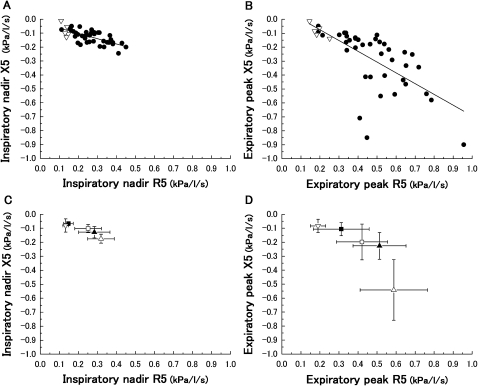
For coordinating the R5 and X5, which are same frequency components, the inspiratory nadir and expiratory peak parameters were plotted on a graph (figure 6). The absolute value of the Zrs at 5 Hz (Z5) is equivalent to the distance from the origin (R5=0 and X5=0). Figure 6A shows the relationships of the inspiratory nadir values in the R5 and X5. A significant correlation of parameters was obtained. The expiratory peak values also were correlated (figure 6B). The healthy subjects were located closer to the origin than the patients with COPD. Figure 6C,D shows the effect of the COPD severity on those figures. The mean point in each group lay in an increased distance from the origin in a COPD-severity-dependent fashion. These graphs also show the variety of the Z5 among individuals, in which the range of the SD values is extensive, especially in the expiratory phase.
Figure 6.
Relationships between during inspiratory nadir values of R5 and X5 (A) and expiratory peak values of R5 and X5 (B) (▿, healthy; ●, chronic obstructive pulmonary disease). Significant correlations were obtained ((A), r=−0.70; p<0.0001; (B), r=−0.67; p<0.0001). Both relationships are also shown according to chronic obstructive pulmonary disease severity (■, Stage I; □, Stage II; ▲, Stage III; ▵, Stage IV) and healthy subjects (▿). Data are expressed as mean±SD.
Discussion
In the present study, using IO, a new approach for assessing the within-breath behaviour of the oscillatory mechanics during tidal breathing was developed. The Rrs and Xrs data were divided into eight time fractions during the respiratory cycle to form averaged respiratory phases. Using this approach, the patients with COPD and the healthy subjects were studied. Irrespective of respiratory phase, the Rrs increased, and the Xrs fell to a more negative level in patients with COPD in a severity-dependent fashion. The increase in the Rrs and negative level in the Xrs were more prominent in the middle of the expiratory phase. These results demonstrate the potential of IO for assessing the within-breath behaviour of the oscillatory mechanics of COPD.
The within-breath behaviour of the oscillatory mechanics is a well-known feature in patients with COPD14–17 and has been previously assessed by the inspiratory–expiratory analysis using IO.9–11 18 Paredi et al reported that the R5 was higher, and the X5 was negative at expiration compared with inspiration in patients with COPD.9 Two other studies also demonstrated the same findings.10 11 Our results showed that the R5 was highest, and X5 was mostly negative at the middle expiratory phase within the eight respiratory phases in most patients with COPD. These results suggest that the oscillatory flow resistance must be different among the respiratory phases, which are not constant during inspiratory and expiratory phases. Given the continuous changes in the airway condition during tidal breathing, our approach seems to be useful for a more detailed analysis of the physiological features of airways compared with inspiratory–expiratory analysis. Grimby et al reported for the first time that the frequency dependency of Rrs was observed in most patients with COPD using sinusoidal oscillation.19 An uneven distribution of time constant in the COPD lung has been mainly attributed to this dependency.20 Our results showed that a more prominent frequency dependency of Rrs (the difference between R5 and R20) during the middle of expiration than during inspiration was observed. This within-breath behaviour is consistent with a previous report by Cauberghs and van de Woestijne using random noise oscillation.8 We found that these features of the severity of COPD can assessed using IO.
This is the first study to investigate the within-breath behaviour of oscillatory mechanics in detail using a commercially available IO device (Master Screen-IOS; CareFusion, Germany). Some of the previous reports using the IO device discussed the values of the parameters that are automatically calculated21 22 such that data for every 0.2 s appeared to be averaged in the inspiratory and expiratory phases. Those studies did not take advantage of the high temporal resolution of the IO device. Since the within-breath variation in the Rrs and Xrs is small in healthy subjects, it may not be a problem to use whole-breath data. Since it is possible that the Rrs and Xrs vary markedly within a breathing cycle in patients with COPD, the differentiation between inspiratory and expiratory phases must be taken into account. The current IO device should have the ability to evaluate within-breath behaviour of oscillatory mechanics in detail. The temporal resolution of the current IO device, 0.2 s, is closely related to the interval of the impulse occurrence or minimal oscillatory frequency in the evaluation (5 Hz). However, it is unknown whether this setting would be optimal for IO measurements. Further studies are needed to resolve this issue.
Di Mango et al studied the whole-breath Rrs and Xrs according to the stage of COPD.6 In their study, the Xrs reflected the advance of the disease in the late stage of COPD rather than in the early stage. They concluded that the initial phases of airway obstruction in COPD could be described mainly by Rrs, while Xrs seemed to be more useful in more advanced phases. In the present study, although the number of patients was small, these data showed that the magnitude of the within-breath variation of the IO parameters would tend to be increased in a COPD-severity-dependent fashion. Both the inspiratory nadir and expiratory peak values of the IO parameters were correlated with %FEV1. The within-breath variation of X5 seemed to be prominent in the late stage of COPD. The combination approach of whole-breath and within-breath analysis may provide markers of airway obstruction in patients with COPD.
The oscillatory properties by means of the FOT, the Rrs and Xrs, are generally interpreted as the resistive and reactive properties of the respiratory system respectively. In a simple model consisting of resistance, inertance and compliance, the Rrs reflects the resistance, and the Xrs reflects the others theoretically. Thus, the Rrs has no frequency dependency. However, most of patients with COPD indicate the frequency dependency of the Rrs,19 which suggests that such oscillatory properties should not be interpreted as the simple resistance–inertance–compliance model. If the Rrs has frequency dependency, the airway obstruction could influence not only the Rrs but also the Xrs. In such a case, the Rrs and the Xrs appear not to be an independent marker of airway obstruction. Currently, a large number of models for interpreting the properties of the Rrs and Xrs have been proposed and validated.23 Modelling approaches have been helpful in understanding the oscillatory mechanics. We evaluated a relationship between the behaviours of the R5 and X5. Although the R5 were increased, and the X5 were more negative in COPD severity-dependent fashion, the SD was extensive especially in patients with severe COPD. These results imply that some variations of oscillatory mechanics exist, even if airway obstruction is the same degree. The physiological factors could contribute to this oscillatory property.
One of the limitations of this study was the accuracy of measuring the Rrs and Xrs using the IO. The respiratory system can be affected by the forced oscillatory pressure applied to the subjects. Figure 2B in the present study apparently shows the zigzag behaviour of the R5 and X5 in a patient with COPD, especially during expiration. This result implies that the oscillatory properties are different during impulse pressure in opposite directions. Therefore, the impulse pressure can yield different results from single sinusoidal oscillatory mechanics, implying that the IO is not necessarily optimal forcing pressure. This problem may be another aspect of the oscillatory mechanics that should be elucidated. Previous papers studied the clinical usefulness of the machine,5 24 in which a high degree of reliability of the IO parameters was confirmed. It is believed that the machine is a very reliable and useful diagnostic tool, especially in obstructive respiratory diseases. Another limitation of this study was the small number of subjects. The findings concerning the pathophysiology of COPD were very limited in this study. A larger number of subjects will be necessary for precise evaluation of the pathophysilogical features of COPD. Further studies are needed to reveal which biomarkers obtained with our approach would be suitable for evaluating the airway obstruction. The different male/female ratio between healthy subjects and patients with COPD was also a limitation.
In conclusion, a new approach for assessing the within-breath behaviour of the oscillatory mechanics during tidal breathing was developed. The within-breath variation of the oscillatory mechanics was prominent in a COPD severity-dependent fashion. This is considered to be able to reflect the well-known physiological features such as the dynamic airway narrowing in patients with COPD. Further studies are needed to validate the clinical utility of this approach for the diagnosis, evaluation of airway obstruction, bronchodilator response and natural history of COPD.
Supplementary Material
Acknowledgments
We would like to express our gratitude to S Freeman and B Bell for proofreading.
Footnotes
To cite: Ohishi J, Kurosawa H, Ogawa H, et al. Application of impulse oscillometry for within-breath analysis in patients with chronic obstructive pulmonary disease: pilot study. BMJ Open 2011;2:e000184. doi:10.1136/bmjopen-2011-000184
Funding: Grant-in-Aid for Japanese Society for the Promotion of Science Fellows.
Competing interests: None.
Patient consent: Obtained.
Ethics approval: Ethics approval was provided by Tohoku University Medical Ethics Committee.
Contributors: JO and HK performed the measurement and analysis in this study. HK and HO recruited the patients for this study. TI and WH contributed to the interpretation of data. MK conceived of the study and participated in its design. All authors have read the original manuscript and approved the revised manuscript.
Provenance and peer review: Not commissioned; externally peer reviewed.
Data sharing statement: Deidentified data will be available to readers upon request.
References
- 1.Beydon N, Davis SD, Lombardi E, et al. An official American Thoracic Society/ European Respiratory Society statement: pulmonary function testing in preschool children. Am J Respir Crit Care Med 2007;175:1304–45 [DOI] [PubMed] [Google Scholar]
- 2.Oostveen E, MacLeod D, Lorino H, et al. The forced oscillation technique in clinical practice: methodology, recommendations and future developments. Eur Respir J 2003;22:1026–41 [DOI] [PubMed] [Google Scholar]
- 3.LaPrad AS, Lutchen KR. Respiratory impedance measurements for assessment of lung mechanics: focus on asthma. Respir Physiol Neurobiol 2008;163:64–73 [DOI] [PMC free article] [PubMed] [Google Scholar]
- 4.MacLeod D, Birch M. Respiratory input impedance measurement: forced oscillation methods. Med Biol Eng Comput 2001;39:505–16 [DOI] [PubMed] [Google Scholar]
- 5.Goldman MD. Clinical application of forced oscillation. Pulm Pharmacol Ther 2001;14:341–50 [DOI] [PubMed] [Google Scholar]
- 6.Di Mango AM, Lopes AJ, Jansen JM, et al. Changes in respiratory mechanics with increasing degrees of airway obstruction in COPD: detection by forced oscillation technique. Respir Med 2006;100:399–410 [DOI] [PubMed] [Google Scholar]
- 7.Kurosawa H, Kohzuki M. Images in clinical medicine: Dynamic airway narrowing. N Engl J Med 2004;350:1036. [DOI] [PubMed] [Google Scholar]
- 8.Cauberghs M, van de Woestijne KP. Changes of respiratory input impedance during breathing in humans. J Appl Physiol 1992;73:2355–62 [DOI] [PubMed] [Google Scholar]
- 9.Paredi P, Goldman M, Alamen A, et al. Comparison of inspiratory and expiratory resistance and reactance in patients with asthma and chronic obstructive pulmonary disease. Thorax 2010;65:263–7 [DOI] [PubMed] [Google Scholar]
- 10.Kubota M, Shirai G, Nakamori T, et al. Low frequency oscillometry parameters in COPD patients are less variable during inspiration than during expiration. Respir Physiol Neurobiol 2009;166:73–9 [DOI] [PubMed] [Google Scholar]
- 11.Kanda S, Fujimoto K, Komatsu Y, et al. Evaluation of respiratory impedance in asthma and COPD by an impulse oscillation system. Intern Med 2010;49:23–30 [DOI] [PubMed] [Google Scholar]
- 12.Rabe KF, Hurd S, Anzueto A, et al. Global strategy for the diagnosis, management, and prevention of chronic obstructive pulmonary disease: GOLD executive summary. Am J Respir Crit Care Med 2007;176:532–55 [DOI] [PubMed] [Google Scholar]
- 13.Japanese Respiratory Society Predicted values of spirometry and arterial blood gas analysis in Japanese. J Jpn Respir Soc 2001;39:1–17 [Google Scholar]
- 14.Mead J, Lindgren I, Gaensler EA. The mechanical properties of the lungs in emphysema. J Clin Invest 1955;34:1005–16 [DOI] [PMC free article] [PubMed] [Google Scholar]
- 15.Officer TM, Pellegrino R, Brusasco V, et al. Measurement of pulmonary resistance and dynamic compliance with airway obstruction. J Appl Physiol 1998;85:1982–8 [DOI] [PubMed] [Google Scholar]
- 16.Farre R, Peslin R, Rotger M, et al. Forced oscillation total respiratory resistance and spontaneous breathing lung resistance in COPD patients. Eur Respir J 1999;14:172–8 [DOI] [PubMed] [Google Scholar]
- 17.Dellaca RL, Santus P, Aliverti A, et al. Detection of expiratory flow limitation in COPD using the forced oscillation technique. Eur Respir J 2004;23:232–40 [DOI] [PubMed] [Google Scholar]
- 18.Goldman MD, Carter R, Klein R, et al. Within- and between-day variability of respiratory impedance using impulse oscillometry in adolescent asthmatics. Pediatr Pulmonol 2002;34:312–19 [DOI] [PubMed] [Google Scholar]
- 19.Grimby G, Takishima T, Graham W, et al. Frequency dependence of flow resistance in patients with obstructive lung disease. J Clin Invest 1968;47:1455–65 [DOI] [PMC free article] [PubMed] [Google Scholar]
- 20.Otis AB, McKerrow CB, Bartlett RA, et al. Mechanical factors in distribution of pulmonary ventilation. J Appl Physiol 1956;8:427–43 [DOI] [PubMed] [Google Scholar]
- 21.Borrill ZL, Houghton CM, Tal-Singer R, et al. The use of plethysmography and oscillometry to compare long-acting bronchodilators in patients with COPD. Br J Clin Pharmacol 2008;65:244–52 [DOI] [PMC free article] [PubMed] [Google Scholar]
- 22.Kolsum U, Borrill Z, Roy K, et al. Impulse oscillometry in COPD: Identification of measurements related to airway obstruction, airway conductance and lung volumes. Respir Med 2009;103:136–43 [DOI] [PubMed] [Google Scholar]
- 23.Diong B, Grainger J, Goldman M, et al. A comparison of linear respiratory system models based on parameter estimates from PRN forced oscillation data. Conf Proc IEEE Eng Med Biol Soc 2009;2009:2879–82 [DOI] [PubMed] [Google Scholar]
- 24.Shiota S, Katoh M, Fujii M, et al. Predictive equations and the reliability of the impulse oscillatory system in Japanese adult subjects. Respirology 2005;10:310–15 [DOI] [PubMed] [Google Scholar]
Associated Data
This section collects any data citations, data availability statements, or supplementary materials included in this article.


