Abstract
Many studies have shown that a change in stimulation frequency leads to altered contractility of the myocardium. However, it remains unclear what changes occur directly after a change in frequency and which ones are a result of the slow processes that lead to the altered homeostasis, which develops after a change in stimulation frequency. To distinguish the immediate from the slow responses, we assessed contractile function in two species that have distinctively different calcium (Ca2+)-handling properties using a recently developed, randomized pacing protocol. In isolated dog and rat right ventricular trabeculae, twitch contractions at five different cycle lengths within the physiologic range of each species were randomized around a steady-state frequency. We found, in both species, that the duration of the cycle length just prior to the analyzed twitch (primary) positively correlated with the increased force of the analyzed twitch. In sharp contrast, the cycle lengths, one and two more removed from the analyzed twitch (“secondary” and “tertiary”), displayed a negative correlation with force of the analyzed twitch. In additional experiments, assessment of intracellular Ca2+ transients in rabbit trabeculae revealed that diastolic Ca2+ levels were closely correlated to contractile function outcome. The relative contribution of the primary cycle length was different between dog (51%) and rat (71%), whereas in neither species was a significant effect on relaxation time observed. With the use of randomized cycle lengths, we have distinguished the intrinsic response from the signaling-mediated effects of frequency-dependent activation on myofilament properties and Ca2+ handling.
Keywords: myofilament properties, calcium handling, force-frequency, trabeculae, relaxation, species
many studies have shown that stimulation at different frequencies leads to altered contractility (4, 10, 19). Changes in the rate at which the heart contracts on a beat-to-beat basis are considered physiological, whereas decreases in this variability are often associated with pathophysiological conditions, such as respiratory failure and diabetes (20). Additionally, changes in contractility after a change in stimulation frequency are not instantaneous. It therefore remains unclear what changes occur directly after a change in frequency, as opposed to the changes that have occurred when a steady state is reached at a different frequency. It is of great value to understand frequency-dependent changes that occur in normal myocardium before we can deduce how these frequency-dependent changes are altered in heart failure, in which a blunted or negative steady-state, force-frequency relationship is indicative of cardiac dysfunction (16, 18). To distinguish the effects of prior contractions on a particular twitch from the response to signaling mechanisms, which can occur at steady state, we used a novel protocol recently described by our lab (24), which is based on a random pacing method and beat-to-beat analysis. This protocol allows us to investigate beat-to-beat changes, independent of the slow processes that occur after a change in frequency. Altering the frequency at which the myocardium is paced on a beat-to-beat basis allows us to determine these immediate effects and provides a more accurate understanding of the dynamic behavior of the contracting myocardium.
Frequency-dependent modulation of contractile strength in humans and large mammals is a noted physiological regulation mechanism. In healthy humans, the heart rate between rest and maximal exercise increases by 200%, from ∼60 beats/min at rest to ∼180 beats/min at maximal exercise. In smaller rodents, the change in heart rate is much less pronounced; in mice, the heart rate during exercise generally only increases by ∼10–30% (7), whereas in rats, it increases by ∼20–40%. Regulation of frequency-dependent contractility has mainly been attributed to alterations in the intracellular calcium ([Ca2+]i) transient (8). This Ca2+ transient is composed of two main components: a portion of Ca2+, in which each beat is cycled through the sarcoplasmic reticulum (SR), whereas the rest stems from the transmembrane Ca2+ flux that enters via the L-type Ca2+ channel and is extruded mainly via sodium-Ca2+ exchange. It is documented that small rodents have a much higher dependence on the SR component, where as much as 95–98% of Ca2+ cycled with each beat may be SR related, whereas in humans and larger mammals, this is significantly less—in the order of 70% (2).
In this study, we combine the recently developed, random-pacing protocol with the biological variability in Ca2+ handling by using a small rodent model (rat) and compare this with a large mammal (dog) to investigate the immediate beat-to-beat regulation of contraction. With the use of cycle lengths within each respective physiologic range for dog and rat, we can distinguish the intrinsic response from the signaling-mediated effects of frequency-dependent activation on myofilament properties and Ca2+ handling. The results show critical similarities but also indicate significant differences between species that help in understanding the regulation of frequency-dependent contractility. We further investigated the role of Ca2+ handling in the beat-to-beat response to random cycle-length change using bis-fura-2-loaded muscles. The Ca2+ transient data, obtained in rabbit preparations, show that both diastolic and systolic Ca2+ ion amplitude are partially related to force. However, compared with the large change in force, changes in the amplitude of the Ca2+ transient occurred to a much lesser extent.
MATERIALS AND METHODS
All protocols and experiments were in accordance with the guidelines of and approved by The Ohio State University's Animal Care and Use Committee (Columbus, OH) and comply with the laws of The United States of America.
In dogs (weighing 19.0 ± 0.4 kg; range 13.6–24.1 kg; 2–3 years old) an intravenous catheter was placed in the cephalic vein, and a surgical plane of anesthesia was induced by injection (over 1–2 min) of sodium pentobarbital (50 mg/kg; Nembutal, Abbott Laboratories, Abbott Park, IL). The dogs were then intubated, and respiration was maintained at 20 breaths/min (vol 300–400 ml) using a respirator (Harvard Instruments, Cambridge, MA). The heart was exposed via a left thoracotomy, and the heart was removed rapidly (<5 min from intubation to heart removal). Male LBN-F1 rats (175–225 g) were anesthetized using intraperitoneal injection of sodium pentobarbital (60 mg/kg). Male New Zealand white rabbits (2 kg; 2–3 mo old) were injected with 5,000 units/kg heparin and anesthetized intravenously with 50 mg/kg pentobarbital sodium. The chest was opened by bilateral thoracotomy, and for rats, 1,000 U heparin was injected into the heart at the apex. The heart was excised rapidly, and ultrathin trabeculae (average dimensions for dog: 362 ± 41 μm wide, 228 ± 28 μm thick, and 3.34 ± 0.74 mm long; for rat: 212 ± 41 μm wide, 136 ± 28 μm thick, and 1.67 ± 0.24 mm long) were dissected from the right ventricle. The muscles were dissected in a modified Krebs-Henseleit solution containing (in mM) 137 NaCl, 5 KCl, 1.2 MgSO4, 1.2 NaH2PO4, 20 NaHCO3, 10 glucose, and 0.25 CaCl2. 2,3-Butanedione monoxime (BDM; 20 mM) was added to this solution to minimize cutting damage (15). Muscles were mounted into the setup as described previously (3, 13, 14) and stimulated for a 3-ms duration at 120% threshold (typically ∼6 V) at either 1 Hz (dog) or 4 Hz (rat), which is at or slightly below their physiological resting rates, while perfused with an oxygenated Krebs-Henseleit solution, now without BDM and containing 1.5 mM Ca2+. The muscles were stretched until an increase in passive (diastolic) force was no longer accompanied by a substantial increase in developed force. Previous studies have shown this length (i.e., optimal length) to correspond to a sarcomere length of about 2.2 μm, which approximates the end-diastolic sarcomere length in the in vivo beating heart (17). The muscles were allowed time to equilibrate at 37°C (∼20 min or until twitches were consistent).
The muscle stimulation protocol to determine the effect of twitch duration on the contractile function of subsequent twitches was conducted as described previously for rabbit (24). Briefly, the time from stimulation of one twitch until stimulation of the next twitch will henceforth be referred to as the cycle length, which was changed randomly around a baseline cycle length of 150 ms for rat and 350 ms for dog. That is, the cycle lengths chosen for rat were 110, 130, 150, 170, and 190 ms, which is 5.3–9.1 Hz, with an overall average cycle length of 150 ms. The cycle lengths chosen for dog were 250, 300, 350, 400, and 450 ms, which is 2.2–4 Hz, with an overall average cycle length of 350 ms. These ranges were chosen because of their very close proximity to the in vivo physiological ranges for each respective animal. During these protocols, the average frequency over time remained constant to avoid changes in Ca2+, which may result from a stabilized increase or decrease in frequency. Each of the muscles was subjected to an ∼8-min protocol, where a computer-based program randomly generated cycle-length sequences within the aforementioned temporal constraints. Force development was measured at an extracellular Ca2+ concentration of 1.5 mM over the specified range of frequencies.
Twitch contractions were recorded continuously throughout the experiment. Force development was normalized to the cross-sectional area of the trabeculae to allow for comparison between muscles of different diameters. Data were collected and analyzed using custom-designed software (in LabVIEW, National Instruments, Austin, TX). Data are represented as mean ± SEM.
With the use of bis-fura-2 to obtain [Ca2+]i transients in rabbit trabeculae, a fluorescence emission reading at both excitation wave lengths—340 nm and 380 nm—is required. To obtain the highest fidelity possible, we have to collect one data set at 340 and one at 380, as well as the average of five to 10 runs. Therefore, a fixed, pseudo-random stimulation protocol was used to enable assessment of the Ca2+ transient. The sequence for 2.86 Hz baseline is: 350, 350, 250, 250, 450, 300, 400, 350, 450, 450, 250, 250, 300, 400, 350, 450, 450, 250, 350, and 350 ms. Briefly, after being stabilized, trabeculae were injected iontophorically with bis-fura-2, as described previously (1, 23). For loading of the dye, temperature was temporarily dropped to room temperature to facilitate the loading process (at body temperature, the rate of dye leak is higher). We loaded the bis-fura-2 until the photomultiplier output at baseline 380 nm excitation was between six and 10 times the initial background. The stimulation was turned on at 1 Hz to aid spread of the dye after loading, and the perfusion system was returned to 37°C. We have shown that the kinetics of this indicator are efficiently fast to accurately track the Ca2+ transient at the highest frequency (14). The muscle was stimulated by the pseudo-random protocol. The reading of fluorescent emission at excitation 340 and 380 nm was recorded separately (i.e., each cycle-length protocol was run twice). The order of protocols of the excitation wavelengths, in a given trabeculae, is random, to exclude the effect of time on the fluorescent signal. The ratio of fluorescence (340/380) was determined as the indicator of Ca2+ concentration.
On data subsets, regression analysis was performed, and Pearson's correlation coefficient was given for each analysis.
RESULTS
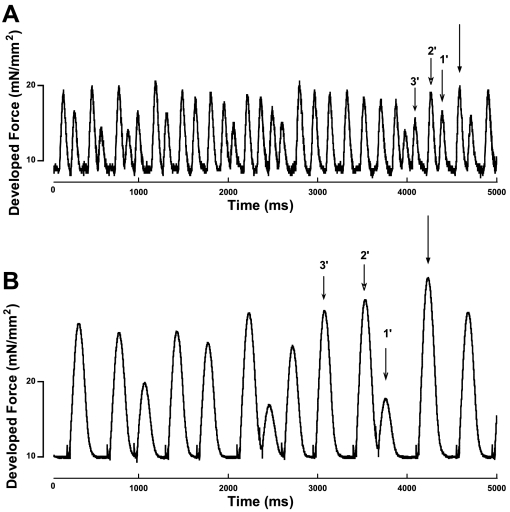
Figure 1 shows representative chart sections of the random cycle-length protocol in rat (Fig. 1A) and dog (Fig. 1B). The stimulation pattern was determined randomly, with each cycle length selected from one of the five options. Consistant with our previously published data in rabbit (24), it can be seen that developed force was very different between twitches of differing previous cycle-length signatures in both rat and dog. All twitches were categorized according to their previous three cycle lengths. All twitches in a record were analyzed, so each analyzed twitch also acted as primary, secondary, and tertiary for respective analysis of the three following twitches.
Fig. 1.
Representative chart sections showing 5 s of a rat (A) and a dog (B) trabecula being stimulated using the variable cycle-length (CL) protocol. The 3 cycle lengths—primary (1′), secondary (2′), and tertiary (3′)—are labeled. The twitch was then categorized according to its previous cycle length signature.
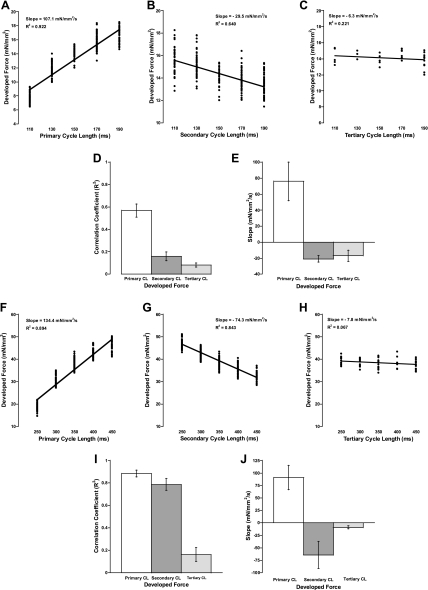
The effect of randomized twitch durations, or randomized cycle lengths, on the development of force for the subsequent twitch is shown in Fig. 2. Figure 2, A–C, shows representative plots for rat, whereas Fig. 2, F–H, shows representative plots for dog. There was a strong positive relationship between developed force and increasing primary cycle length when the secondary cycle length was selected constant in both rat and dog. The relationship between developed force and the secondary cycle length, while the primary cycle length was selected constant, was negative in rat, and this negative relationship was more pronounced in dog. Finally, the tertiary cycle length, when primary and secondary were held constant, had only a slight negative effect in rat and even less of a negative effect in dog. Figure 2, D and I, shows the correlation coefficients for rat and dog, respectively. Figure 2, E and J, shows the slopes for rat and dog, respectively. Both species exhibit a positive slope for the primary cycle length and negative slopes for the secondary and tertiary cycle lengths. Overall, as the primary cycle length is increased, there is a greater increase in the developed force of the focal twitch. In dog muscles, the magnitude of the response was significantly greater than in rat.
Fig. 2.
A–C and F–H: representative plots of the 3 different cycle lengths vs. developed force. A: effect of primary cycle length (all with a 150-ms secondary cycle length) in rat. B: effect of secondary (all with 150-ms primary cycle length) in rat. C: effect of tertiary (all with 150-ms secondary and tertiary cycle lengths) in rat. D: average correlation coefficient (R2) for all experiments in rat. E: average slopes of the linear fits to demonstrate that the primary cycle length correlates positively with developed force, whereas the secondary and tertiary cycle lengths correlate negatively with developed force in rat. F: effect of primary cycle length (all with a 350-ms secondary cycle length) in dog. G: effect of secondary (all with 350-ms primary cycle length) in dog. H: effect of tertiary (all with 350-ms secondary and tertiary cycle lengths) in dog. I: average correlation coefficient for all experiments in dog. J: average slopes of the linear fits to demonstrate that the primary cycle length correlates positively with developed force, whereas the secondary and tertiary cycle lengths correlate negatively with developed force in dog.
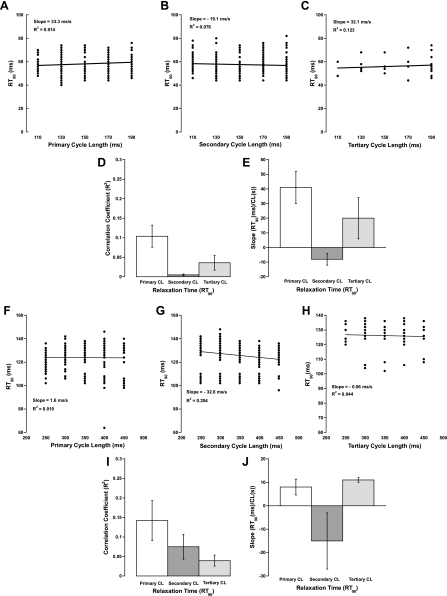
The effect of cycle length on the time from peak tension (TTP) to 90% relaxation (RT90) did not correlate significantly with any of the primary, secondary, or tertiary cycle lengths. Figure 3, A–C and F–H, shows representative plots for the effect of cycle length on relaxation time in rat and dog, respectively. Figure 3, D and I, shows the very low correlation coefficients for all of the cycle lengths in rat and dog, respectively, and suggests that the correlation coefficient for the secondary cycle length is much less in rat than in dog, although the correlative value is low for both species. The primary and tertiary cycle lengths had a positive effect on slope, whereas the secondary cycle length had a negative effect in both rat and dog, as seen in Fig. 3, E and J, respectively.
Fig. 3.
Effect of cycle length on relaxation time. A–C: representative plots of the 3 different cycle lengths vs. time from peak tension to 90% relaxation (RT90) for rat. D: average correlation coefficients of all experiments for rat. E: average slopes for all experiments in rat. F–H: representative plots of the 3 different cycle lengths vs. RT90 for dog. I: average correlation coefficients of all experiments for dog. J: average slopes for all experiments in dog.
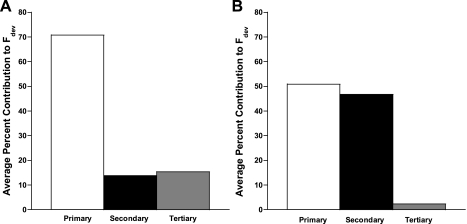
The percent average that each preceding cycle length contributed to the developed force of a given twitch for rat is shown in Fig. 4A and for dog, Fig. 4B. As described previously, the percent contribution was calculated by determining the percentile difference between the short and long cycle-length developed force for all four cycle lengths (24). To display each individual change as a percentage of the total, the total absolute change from the short to the long cycle lengths was added together. The primary cycle length in rat clearly contributes more of an effect than secondary and tertiary cycle lengths, which contributed somewhat equally. In dog, however, whereas the primary cycle length still exhibits more of an effect than secondary or tertiary, both the primary and secondary appear to contribute extensively more than the tertiary.
Fig. 4.
Average percentage that each preceding cycle length contributed to developed force (Fdev) of a given twitch for rat (A) and dog (B). The impact of the primary twitch was calculated as the percent of the full range (defined as the largest difference between the highest and lowest force) caused by the 3 beats combined.
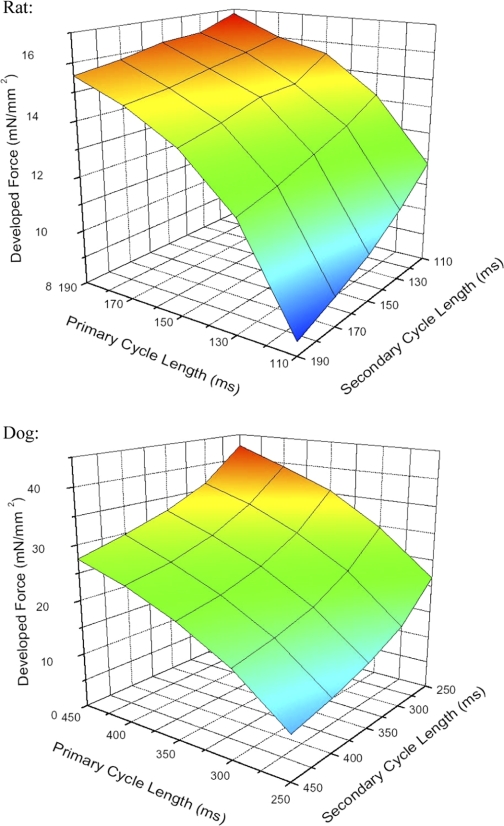
Figure 5 shows a three-dimensional plot of the effects of the interaction between the primary and secondary cycle lengths on developed force. This plane shows the developed force for each primary-secondary combination. In both species, the combination that produced the most force was the shortest secondary cycle length followed by the longest primary cycle length, whereas the counterpart was true—the longest secondary cycle length followed by the shortest primary cycle length produced the least amount of force. This relationship, however, seems to be more level in rat (top panel) compared with dog (bottom panel), in which this relationship is more steep.
Fig. 5.
A 3-dimensional plane representation of developed force vs. primary and secondary cycle length for rat (top panel) and dog (bottom panel). From these graphs, it can be seen that a short secondary followed by a long primary renders the highest force, whereas a long secondary followed by a short primary gives the lowest force in both species.
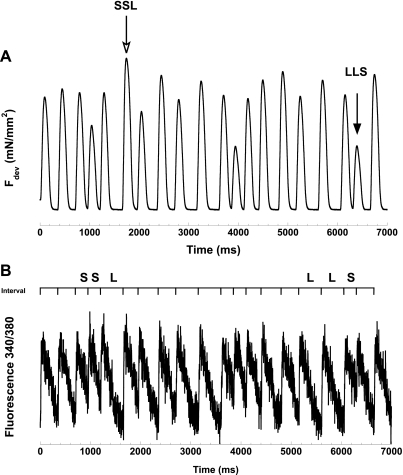
The success rate of obtaining Ca2+ transient data in dog myocardium is very low, only one in ∼10 experiments provided useful data. Thus since a direct comparison of Ca2+ transients in rat and dog is not possible, we elected to assess these in rabbits. The reason for rabbits is threefold: 1) iontophoresis-based Ca2+ transient assessment experiments can be performed with an ∼70% success rate; 2) it allows direct comparison outcomes with our previous work (24); and 3) the fraction of the Ca2+ transient that cycles via the SR with each beat is ∼70% in the rabbit (closely resembling dog and human), whereas this is only ∼5–8% in the rat (2). Figure 6 shows a representative force and [Ca2+]i tracing taken in a rabbit trabecula, which was stimulated by the fixed, pseudo-random protocol. This pseudo-random protocol contains the two most extreme combinations of three cycle lengths: shortest tertiary-shortest secondary-longest primary (SSL), which generally gives the highest developed force, and longest tertiary-longest secondary-shortest primary (LLS), which gives the lowest developed force. In this pseudo-random protocol, the force responds to the previous cycle-length signature similarly to the data that we obtained from the completely random cycle-length protocol. Compared with the dramatic change in force, changes in the amplitude of the Ca2+ transient during the random cycle-length protocol occur to a markedly lesser extent.
Fig. 6.
Representative force and calcium (Ca2+) tracing of the pseudo-random cyle-length protocol. Two extreme combinations (yielding, respectively, the highest and lowest force)—shortest tertiary-shortest secondary-longest primary (SSL) and longest tertiary-longest secondary-shortest primary (LLS)—are indicated by arrows in A.
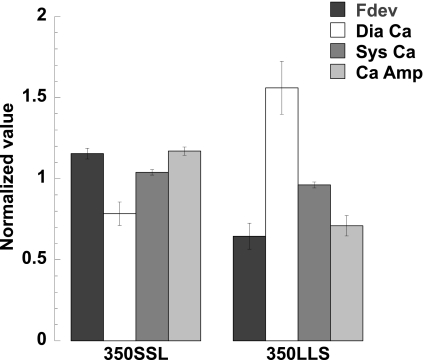
We further analyzed the Ca2+ transient and developed force in this pseudo-random protocol by normalizing each twitch to the second twitch of the protocol, which is in the middle of three baseline cycle lengths. In previous studies using bis-fura-2, the fluorescence signal ratio of 340/380 was converted into [Ca2+]i by obtaining the minimum and maximum ratios, as described previously (1, 11, 21, 22). In the present study, we decided to use the fluorescence signal ratio of 340/380 as an indicator of [Ca2+]i because of the technical difficulties of calibration after long protocols. Since we are interested in the dynamic regulations within the random cycle-length protocol, only twitches within a single given protocol were compared. Figure 7A shows the normalized developed force vs. diastolic Ca2+, Fig. 7B shows the normalized developed force vs. systolic Ca2+, and Fig. 7C shows the normalized developed force vs. Ca2+ amplitude. The data show that the normalized developed force ranges from 0.27 to 1.26 (n = 7 trabeculae; = 126 twitches), and the normalized diastolic Ca2+ ranges from 0.32 to 2.28. The normalized systolic Ca2+ shows less fluctuation compared with diastolic Ca2+, with ranges of 0.78–1.18. The Ca2+ amplitude is thus more dependent on the changes in diastolic Ca2+. Figure 8 shows the two extreme combinations: SSL and LLS.
Fig. 7.
Scatter plot of developed force vs. Ca2+. A: the normalized developed force vs. diastolic Ca2+. B: the normalized developed force vs. systolic Ca2+. C: the normalized developed force vs. Ca2+ amplitude.
Fig. 8.
Twitches with extreme combinations of cycle lengths, SSL and LLS, were analyzed on developed force, diastolic Ca2+ level (Dia Ca), systolic Ca2+ level (Sys Ca), and Ca2+ transient amplitude (Ca Amp).
DISCUSSION
In this study, we have shown that at least three twitches prior to a given twitch contribute to the force of that twitch and that the relative contribution of each of these prior twitches differs among species. In the present study, we initially investigated these effects in rat and dog, similar to our previous study (24), which investigated twitch dynamics in rabbit. In close agreement with this previous study on rabbit myocardium, the primary cycle length correlated positively with force in rat and dog myocardium, whereas the secondary and tertiary cycle lengths negatively affected force. When comparing the correlation coefficients for developed force for each of the cycle lengths for both rat and dog, in addition to the values previously reported for rabbit (24), it was observed that the correlation coefficient is greatest for the primary cycle length, compared with the secondary and tertiary, and that this value is greater with a larger species size. Both the primary and secondary cycle lengths have a greater correlation coefficient for dog compared with rabbit, and these values are in turn greater than the correlation coefficient seen for rat. This suggests that in all species studied, the length of the primary cycle has the largest impact on twitch dynamics, although the exact quantitative contribution is species dependent.
We previously reported (24) that in rabbit, the primary cycle length contributes ∼64% to the force of the subsequent twitch, whereas the secondary and tertiary cycle lengths, respectively, contribute ∼27% and 8%. When evaluating the percent contribution for each cycle length for rat and dog in this study, it can be observed that the smaller the species, the larger the percent contribution of the primary cycle length. For instance, the percent contribution of the primary cycle length for rat was greater than previously reported for rabbit, which in turn, was greater than seen for dog. Likewise, the percent contribution of the tertiary cycle length increased as species size decreased, whereas the opposite was true for the secondary cycle length; the percent contribution of the secondary cycle length increased as species size increased. This study revealed that the average percentage of the primary cycle length contributed to developed force of a given twitch for rat exceeds 70%, whereas the contribution of secondary and tertiary cycle length is much less (both are ∼15%). In dog, the primary cycle length appears to contribute ∼50%, whereas the secondary seems to have a similar effect (>40%), and the tertiary has a much diminished effect (<5%).
It is well known that there are substantial differences in Ca2+ handling between small rodents and bigger mammals. In small rodents, Ca2+ released from SR accounts for 92–98% of Ca2+ transients, whereas in bigger mammals, the SR contribution is only ∼70% (2). In rabbit, we found that changes in the Ca2+ transient were quantitatively much smaller than the dramatic changes in contractile force during the cycle-length protocol. Around the Ca2+ concentrations occurring during the peak of the Ca2+ transient, only little variation was shown, but the steady-state relationship between force and Ca2+ concentration is extremely steep, with Hill-coefficient values ∼4–8 (6). Thus a small change in Ca2+ can result in a much larger change in force. There are a significant number of regulatory processes that can further alter the force-Ca2+ relationship. In our pseudo-random cycle-length protocol, under near-physiological conditions, there are, however, several factors that can be excluded from the complicated regulation system. A common factor that modulates the steady-state force-Ca2+ relationship, length of the muscle (5), was kept constant, as our experiments were done at a single, optimal length. Also, since the baseline frequency was fixed in the protocol, changes in protein phosphorylation caused by changes in frequency can be excluded (12, 21, 22). Our data thus support the intrinsic properties, and instantaneous response of myofilaments accounts for the dynamic relationship between Ca2+ and force in intact working myocardium. Interestingly, during the pseudo-random cycle-length protocol, the systolic Ca2+ concentration did not change significantly. For a given twitch with a short primary cycle length, the previous Ca2+ transient appears not to decline fully. This leads to an elevated diastolic Ca2+ value and a blunted Ca2+ transient amplitude for the given twitch. It indicates that the absolute systolic Ca2+ ion concentration is not the sole determinant in the Ca2+-force relationship in the isometric twitch of an intact muscle. This phenomenon may also explain the difference between rat and dog: the fraction of the cytosolic Ca2+ transient taken up by the SR is much greater in rat than in dog; thus changes in cytosolic Ca2+ are negated quicker in the rat, and thus the impact of secondary and tertiary twitches is reduced. In addition, given the small impact of systolic Ca2+ levels, we conclude that the dynamic regulation of contractility in intact multicellular preparations appears to be a delicate balance between Ca2+ transient parameters and myofilament Ca2+ responsiveness and appears not to be governed by a single linear relationship: both the Ca2+ transient and myofilament responsiveness are influenced/regulated by multiple parameters, including load, frequency, as well as feedback on each other. Future approaches to further elucidate this balance could test whether and how the hysteresis between the cytosolic Ca2+ transient and the force production is critically impacted by the preceding cycle lengths.
The correlation coefficients for the TTP to RT90 were extremely low in both rat and dog for all of the cycle lengths studied. Thus despite large changes in force development, kinetics of the contraction, which are linked by properties of the sarcomere (9), were virtually unaltered. The individual cycle lengths, on a beat-to-beat basis, did not significantly change the RT90. It is, however, well known that when cycle length is decreased (i.e., frequency of stimulation increases), the kinetics of cardiac muscle contraction accelerate, a process that is generally blunted or impaired in various cardiomyopathies. Unlike the force-frequency relationship, which under certain conditions can display positive, negative, or biphasic behavior, at steady state, the speed of contraction always accelerates when stimulation frequency is enhanced, and this acceleration of kinetics occurs in rats, mice, humans, dogs, and rabbits alike (10). In this study, we show that the random cycle-length protocol can be used to differentiate between immediate effects of stimulation frequency vs. its steady-state behavior.
Previously, it has been shown that phosphorylation of certain proteins, such as troponin I and myosin-binding protein C, can occur at steady state when stimulation frequency is increased (21). Such post-translational modifications likely contribute to faster relaxation kinetics at higher frequencies. However, since RT90 was not changed significantly by immediate changes in cycle length, it suggests that phosphorylation of these proteins may not be occurring, or at least not to a functionally significant level, on a beat-to-beat basis. This would be in agreement with the previous study in rabbit (24), although current correlation coefficients for rat and dog are somewhat lower than those reported for rabbit.
This protocol uses a randomly changing cycle length centered around an overall average cycle length. The use of this protocol provides a potential clinically relevant model for variations naturally occurring in the heart on a beat-to-beat basis. The entire protocol takes less than 10 min to execute, which resulted in only minimal or no rundown of the preparations. These data were collected within the physiological frequency range of each species, at physiological temperature, and on a beat-to-beat basis, unlike previous studies that have been performed at steady state (21). Because understanding the normal functioning myocardium is pertinent to elucidating the complete pathological condition, the data in the present study were collected under conditions that enable comparisons with the in vivo situation of the effects of heart-rate variability.
Intuitively, it may be expected that the primary cycle length would have the strongest correlation with force development and that this quantitative effect would gradually diminish with each cycle length that is further removed from the analyzed beat. As time passes, the effect of a small change in cycle length is dampened, and after sufficient time has passed, the contractile output will equilibrate to steady state. Interestingly, although in rats, the primary cycle length indeed had much more of an influence than the secondary, in dog, the secondary and primary cycle lengths had similar contributions in determining the subsequent twitch's force development. This occurred despite the overall shorter cycle lengths in rat, suggesting that the absolute amount of time passed correlates more poorly with force of contraction than the number of beats. If the time dependence of the cycle-length history would be the primary determinant of the strength of contraction in rats because of the shorter cycle lengths, the effect of the secondary would be relatively larger, since on average (two beats at 150 ms each), much less time has passed than in the dog (two beats at 350 ms each) experiments. Thus in addition to the overall time effect that decreases the impact of cycle length, as it is temporally further removed from the analyzed contraction, additional factors affect the species difference between cycle-length history and contractility.
In summary, we show that at least three twitches prior to a given twitch contribute to the force of that twitch and that the relative contribution of each of these prior twitches differs between species. Twitch force in rat is affected principally by the primary prior twitch, whereas twitch force in dog is mainly affected by both the primary and secondary prior twitches. With the use of randomized cycle lengths to distinguish the intrinsic response from the signaling-mediated effects of frequency-dependent activation on myofilament properties and Ca2+ handling, quantifying the relative contribution of these two processes, the molecular mechanisms underlying this phenomenon, and whether these processes are deranged in disease may prove useful.
GRANTS
This study was supported by National Heart, Lung, and Blood Institute Grants R01 746387 (to P. M. L. Janssen) and HL-086700 (to G. E. Billman) and two American Heart Association Great Rivers Affiliate Predoctoral Fellowships (to M. M. Monasky and N. Hiranandani).
DISCLOSURES
No conflicts of interest, financial or otherwise, are declared by the author(s).
ACKNOWLEDGMENTS
The authors thank Anil Birdi for technical assistance.
REFERENCES
- 1. Backx PH, Ter Keurs HE. Fluorescent properties of rat cardiac trabeculae microinjected with fura-2 salt. Am J Physiol Heart Circ Physiol 264: H1098–H1110, 1993 [DOI] [PubMed] [Google Scholar]
- 2. Bers DM. Cardiac excitation-contraction coupling. Nature 415: 198–205, 2002 [DOI] [PubMed] [Google Scholar]
- 3. Billman GE, Nishijima Y, Belevych AE, Terentyev D, Xu Y, Haizlip KM, Monasky MM, Hiranandani N, Harris WS, Gyorke S, Carnes CA, Janssen PML. Effects of dietary omega-3 fatty acids on ventricular function in dogs with healed myocardial infarctions: in vivo and in vitro studies. Am J Physiol Heart Circ Physiol 298: H1219–H1228, 2010 [DOI] [PMC free article] [PubMed] [Google Scholar]
- 4. Burkhoff D, Yue DT, Franz MR, Hunter WC, Sunagawa K, Maughan WL, Sagawa K. Quantitative comparison of the force-interval relationships of the canine right and left ventricles. Circ Res 54: 468–473, 1984 [DOI] [PubMed] [Google Scholar]
- 5. Dobesh DP, Konhilas JP, de Tombe PP. Cooperative activation in cardiac muscle: impact of sarcomere length. Am J Physiol Heart Circ Physiol 282: H1055–H1062, 2002 [DOI] [PubMed] [Google Scholar]
- 6. Gao WD, Perez NG, Marban E. Calcium cycling and contractile activation in intact mouse cardiac muscle. J Physiol 507: 175–184, 1998 [DOI] [PMC free article] [PubMed] [Google Scholar]
- 7. Georgakopoulos D, Kass D. Minimal force-frequency modulation of inotropy and relaxation of in situ murine heart. J Physiol 534: 535–545, 2001 [DOI] [PMC free article] [PubMed] [Google Scholar]
- 8. Gwathmey JK, Slawsky MT, Hajjar RJ, Briggs GM, Morgan JP. Role of intracellular calcium handling in force-interval relationships of human ventricular myocardium. J Clin Invest 85: 1599–1613, 1990 [DOI] [PMC free article] [PubMed] [Google Scholar]
- 9. Janssen PML. Kinetics of cardiac muscle contraction and relaxation are linked and determined by properties of the cardiac sarcomere. Am J Physiol Heart Circ Physiol 299: H1092–H1099, 2010 [DOI] [PMC free article] [PubMed] [Google Scholar]
- 10. Janssen PML, Periasamy M. Determinants of frequency-dependent contraction and relaxation of mammalian myocardium. J Mol Cell Cardiol 43: 523–531, 2007 [DOI] [PMC free article] [PubMed] [Google Scholar]
- 11. Janssen PML, Stull LB, Marban E. Myofilament properties comprise the rate-limiting step for cardiac relaxation at body temperature in the rat. Am J Physiol Heart Circ Physiol 282: H499–H507, 2002 [DOI] [PubMed] [Google Scholar]
- 12. Lamberts RR, Hamdani N, Soekhoe TW, Boontje NM, Zaremba R, Walker LA, de Tombe PP, van der Velden J, Stienen GJ. Frequency-dependent myofilament Ca2+ desensitization in failing rat myocardium. J Physiol 582: 695–709, 2007 [DOI] [PMC free article] [PubMed] [Google Scholar]
- 13. Monasky MM, Janssen PML. The positive force-frequency relationship is maintained in absence of sarcoplasmic reticulum function in rabbit, but not in rat myocardium. J Comp Physiol B 179: 469–479, 2009 [DOI] [PubMed] [Google Scholar]
- 14. Monasky MM, Varian KD, Davis JP, Janssen PML. Dissociation of force decline from calcium decline by preload in isolated rabbit myocardium. Pflugers Arch 456: 267–276, 2008 [DOI] [PubMed] [Google Scholar]
- 15. Mulieri LA, Hasenfuss G, Ittleman F, Blanchard EM, Alpert NR. Protection of human left ventricular myocardium from cutting injury with 2,3-butanedione monoxime. Circ Res 65: 1441–1449, 1989 [DOI] [PubMed] [Google Scholar]
- 16. Mulieri LA, Hasenfuss G, Leavitt B, Allen PD, Alpert NR. Altered myocardial force-frequency relation in human heart failure. Circulation 85: 1743–1750, 1992 [DOI] [PubMed] [Google Scholar]
- 17. Rodriguez EK, Hunter WC, Royce MJ, Leppo MK, Douglas AS, Weisman HF. A method to reconstruct myocardial sarcomere lengths and orientations at transmural sites in beating canine hearts. Am J Physiol Heart Circ Physiol 263: H293–H306, 1992 [DOI] [PubMed] [Google Scholar]
- 18. Rossman EI, Petre RE, Chaudhary KW, Piacentino V, 3rd, Janssen PML, Gaughan JP, Houser SR, Margulies KB. Abnormal frequency-dependent responses represent the pathophysiologic signature of contractile failure in human myocardium. J Mol Cell Cardiol 36: 33–42, 2004 [DOI] [PubMed] [Google Scholar]
- 19. Schouten VJ, ter Keurs HE. The force-frequency relationship in rat myocardium The influence of muscle dimensions. Pflugers Arch 407: 14–17, 1986 [DOI] [PubMed] [Google Scholar]
- 20. van Ravenswaaij-Arts CM, Kollee LA, Hopman JC, Stoelinga GB, van Geijn HP. Heart rate variability. Ann Intern Med 118: 436–447, 1993 [DOI] [PubMed] [Google Scholar]
- 21. Varian KD, Janssen PML. Frequency-dependent acceleration of relaxation involves decreased myofilament calcium sensitivity. Am J Physiol Heart Circ Physiol 292: H2212–H2219, 2007 [DOI] [PubMed] [Google Scholar]
- 22. Varian KD, Kijtawornrat A, Gupta SC, Torres CA, Monasky MM, Hiranandani N, Delfin DA, Rafael-Fortney JA, Periasamy M, Hamlin RL, Janssen PML. Impairment of diastolic function by lack of frequency-dependent myofilament desensitization rabbit right ventricular hypertrophy. Circ Heart Fail 2: 472–481, 2009 [DOI] [PMC free article] [PubMed] [Google Scholar]
- 23. Varian KD, Raman S, Janssen PML. Measurement of myofilament calcium sensitivity at physiological temperature in intact cardiac trabeculae. Am J Physiol Heart Circ Physiol 290: H2092–H2097, 2006 [DOI] [PubMed] [Google Scholar]
- 24. Varian KD, Xu Y, Torres CA, Monasky MM, Janssen PML. A random cycle length approach for assessment of myocardial contraction in isolated rabbit myocardium. Am J Physiol Heart Circ Physiol 297: H1940–H1948, 2009 [DOI] [PMC free article] [PubMed] [Google Scholar]


