Abstract
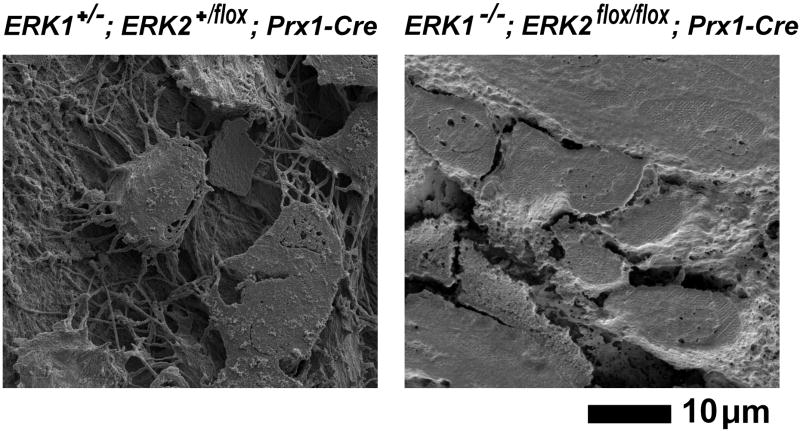
To examine the roles of FGF and ERK MAPK signaling in osteocyte differentiation and function, we performed microarray analyses using the osteocyte cell line MLO-Y4. This experiment identified a number of mineralization-related genes that were regulated by FGF2 in an ERK MAPK dependent manner. Real-time PCR analysis indicated that FGF2 upregulates Ank, Enpp1, Mgp, Slc20a1, and Dmp1 in MLO-Y4 cells. Consistent with this observation, the selective FGF receptor inhibitor PD173074 decreased Ank, Enpp1, Slc20a1, and Dmp1 mRNA expression in mouse calvaria in organ culture. Since Dmp1 plays a central role in osteocyte differentiation and mineral homeostasis, we further analyzed FGF regulation of Dmp1. Similar to FGF2, FGF23 upregulated Dmp1 expression in MLO-Y4 cells in the presence of Klotho. Furthermore, increased extracellular phosphate levels partially inhibited FGF2-induced upregulation of Dmp1 mRNA expression, suggesting a coordinated regulation of Dmp1 expression by FGF signaling and extracellular phosphate. In MLO-Y4 osteocytes and in MC3T3E1 and primary calvaria osteoblasts, U0126 strongly inhibited both basal expression of Dmp1 mRNA and FGF2-induced upregulation. Consistent with the in vitro observations, real-time PCR and immunohistochemical analysis showed a strong decrease in Dmp1 expression in the skeletal elements of ERK1−/−; ERK2 flox/flox; Prx1-Cre mice. Furthermore, scanning electron microscopic analysis revealed that no osteocytes with characteristic dendritic processes develop in the limbs of ERK1−/−; ERK2 flox/flox; Prx1-Cre mice. Collectively, our observations indicate that FGF signaling coordinately regulates mineralization-related genes in the osteoblast lineage and that ERK signaling is essential for Dmp1 expression and osteocyte differentiation.
Keywords: Dmp1, FGF, MAPK, osteoblasts, osteocytes
Introduction
Osteoblasts arise from undifferentiated mesenchymal cells and undergo sequential steps of differentiation. Osteoblasts lay down osteoid matrix, coordinate its mineralization, and subsequently become embedded in bone matrix as osteocytes. Numerous studies have indicated that the differentiation and function of osteoblasts are under the control of various systemic hormones and local cytokines and growth factors. Some of the important regulators of osteoblast differentiation are fibroblast growth factors (FGFs). The inactivation of Fgf2 in mice causes decreased bone mass and decreased bone formation [1]. Furthermore, the genetic inactivation of Fgfr2 causes reduced osteoblast proliferation and increased osteopenia, whereas Fgfr1 has been implicated in stage-dependent regulation of osteoblast proliferation and differentiation [2, 3]. In humans, activating mutations in FGFR2 cause syndromic craniosynostosis, such as Apert and Crouzon syndromes [4]. These observations indicate that FGF signaling plays an essential role in the control of osteoblast differentiation and bone formation.
FGF signaling is mediated by various intracellular signaling pathways including protein kinase C, phospholipase C-γ, and the extracellular signal-regulated kinase (ERK) mitogen-activated protein kinase (MAPK) pathway [5]. Studies from our laboratory as well as other investigators have shown that the ERK MAPK pathway plays an essential role in mediating FGF signaling in skeletal cells [6, 7]. Our studies using genetically engineered mouse models have indicated that ERK1 and ERK2 play an essential role in osteoblast and chondrocyte differentiation [8]. The genetic inactivation of ERK1 and ERK2 in undifferentiated mesenchymal cells leads to severe impairment of osteoblast differentiation and bone formation. In addition, a number of missense-activating mutations in HRAS, KRAS, BRAF, MEK1, and MEK2 have been identified in Costello, Noonan, LEOPARD, and cardio-facio-cutaneous syndromes, highlighting the importance of the ERK MAPK pathway in human skeletal development [9, 10].
While numerous in vivo and in vitro studies have examined the mechanisms of osteoblast differentiation, relatively little is known about the transition from osteoblasts to osteocytes. Osteocytes are non-proliferative, terminally differentiated cells in the osteoblast lineage, and the osteocyte is the most abundant cell type in bone. Recent studies have indicated that osteocytes function as a mechanosensor in the bone, coordinate bone homeostasis, and secrete dentin matrix protein 1 (Dmp1) and FGF23 to regulate phosphate homeostasis [11–14]. Dmp1 is a noncollagenous protein expressed in the osteoblast lineage, which is most abundantly expressed in osteocytes. Dmp1 has been shown to play a critical role in osteocyte differentiation [11, 15]. Dmp1-null mice show defective osteoblast-to-osteocyte maturation and defects in mineralization. Furthermore, DMP1 mutations in humans cause autosomal recessive hypophosphatemic rickets (ARHR) and osteomalacia. Interestingly, both Dmp1-null mice and patients with DMP1 mutations show increased FGF23 expression in osteocytes and elevated systemic FGF23 levels, indicating that DMP1 acts upstream of FGF23 and regulates phosphate metabolism.
To investigate the role of FGF and ERK MAPK signaling in the late stages of osteoblast differentiation, we examined the effects of FGF2 and a MEK inhibitor, U0126, in MLO-Y4 osteocytes, an immortalized cell line that maintains the characteristics of osteocytes [16]. We show here that FGF2 coordinately regulates a number of mineralization-related genes in an ERK MAPK dependent manner in MLO-Y4 cells. Our in vivo and in vitro observations indicate that Dmp1 expression in osteoblasts and osteocytes requires FGF and ERK signaling. Furthermore, scanning electron microscopic (SEM) analysis shows that no osteocytes with characteristic dendritic processes develop in the absence of ERK1 and ERK2. These observations indicate that FGF and ERK signaling plays an essential role in osteocyte differentiation and mineral homeostasis.
Materials and methods
Cell and calvaria organ culture
MLO-Y4 cells were cultured in α-MEM containing 2.5% FCS and 2.5% calf serum. MC3T3-E1 cells were cultured in α-MEM containing 10% FCS. Primary calvaria osteoblasts were isolated from neonatal mouse calvaria after sequential digestion with 0.1% collagenase and 0.2% dispase as described previously [17]. The cells were grown in α-MEM, 10% FCS, and the medium was further supplemented with 5 mM β-glycerophosphate and 100 μg/ml ascorbic acid upon reaching confluence. For embryonic calvaria organ culture, calvariae were isolated from wild type embryos at 18.5 days post-gestation. Each calvaria was individually placed in a well of a 48-well plate containing 200 μl α-MEM supplemented with 10% FCS, 50 μg/ml ascorbic acid, 1 mM β-glycerophosphate, and penicillin/streptomycin. Cultures were maintained at 37°C in a humidified incubator with 5% CO2 in air. Recombinant human FGF2, mouse FGF23, and mouse Klotho were purchased from R&D. MEK1/MEK2 inhibitor U0126 and FGF receptor inhibitor PD173074 were purchased from Promega and Tocris Bioscience, respectively. Cycloheximide and heparin were purchased from Sigma.
To determine the effect of extracellular inorganic phosphate concentration on MLO-Y4 cells, cells were incubated in α-MEM containing 0.25% FCS and 0.25% calf serum for 16 h 40 min and treated for 8 h with FGF2 and inorganic phosphate, which was added as a mixture of NaH2PO4 and Na2HPO4 (pH7.2).
To examine the effects of FGF2 on mineralization, MLO-Y4 cells and primary calvaria osteoblasts were plated in 24-well plates, and medium was supplemented with 5 mM of β-glycerophosphate and 100μg/ml of ascorbic acid with or without 10 ng/ml FGF2 upon reaching confluence. The medium was changed every 3 days. Mineralization was evaluated by alizarin red staining at 10 days after the induction of mineralization. Cells were fixed in 70% ethanol for 15 min and stained with 1% alizarin red solution.
Mutant animals
The institutional animal care and use committee of Case Western Reserve University approved all animal procedures. All animal care and use were performed in accordance with the institutional animal use methods and policies. ERK1-null mice and mice with the floxed allele of ERK2 were described previously [18, 19]. Prx1-Cre transgenic mice were obtained from James Martin [20]. ERK1−/−; ERK2flox/flox; Prx1-Cre embryos were generated as described [8]. Mice with the floxed allele of Fgfr2 were purchased from the Jackson Laboratory [2].
RNA extraction and semi-quantitative and real-time PCR
Total RNA was extracted from cells and mouse skeletal elements using the RNeasy kit (Qiagen). RNA was reverse-transcribed to cDNA with the High Capacity cDNA Archive Kit (Applied Biosystems). Real-time PCR was performed on the Applied Biosystems 7500 Real-time PCR detection system. All the real-time PCR analyses were done in triplicate or quadruplicate. TaqMan probe sets were designed and synthesized by Applied Biosystems (Dmp1; Mm00803833_g1, Erk2; Mm00442479_m1, Enpp1; Mm00501097_m1, Mgp; Mm00485009_m1, Ank; Mm00445040_m1, Slc20a1; Mm00489378_m1, Fgf23; Mm00445621_m1, Gapdh; 4352932E, sclerostin (Sost); Mm00470479_m1, klotho; Mm00502002_m1). To compare gene expression levels, the comparative cycle threshold (Ct) method was used. Gapdh was used as an endogenous control to correct for potential variation in RNA loading or in efficiency of amplification. Semi-quantitative PCR was performed on the Applied Biosystems GeneAmp PCR system 9700 using the following primer sets: Dmp1, (forward) 5′-AGATCCCTCTTCGAGAACTTCGCT-3′ and (reverse) 5′-TTCTGATGACTCACTGTTCGTGGGTG -3′, PCR product: 242 bp; Fgfr1, (forward) 5′-TGGAGTTCATGTGTAAGGTG-3′ and (reverse) 5′-ATAAAGAGGACCATCCTGTG-3′, PCR product: 856bp; Fgfr2, (forward) 5′-AAATACCAAATCTCCCAACC-3′ and (reverse) 5′-GCCGCTTCTCCATCTTCT-3′, PCR product: 373bp; Fgfr3, (forward) 5′-ACTGTACTCAAGACTGCAGG-3′ and (reverse) 5′-GTCCTTGTCAGTCGCATCAT-3′, PCR product: 635bp; Fgfr4, (forward) 5′-TACAGTGGCTGAAACACGTCGTCA-3′ and (reverse) 5′-ACAAGCAGAACCAGTGAGCCTGAT-3′, PCR product: 304bp; Gapdh (forward) 5′-ACCACAGTCCATGCCATCAC-3′ and (reverse) 5′-TCCACCCTGTTGCTGTA-3′, PCR product: 452bp. cDNA was amplified 28–35 cycles, and the band intensity was compared while the band intensity and cycle numbers were linear.
Microarray
Microarray analysis using Affymetrix Mouse Genome 430 2.0 Array was performed at the Gene Expression and Genotyping Core Facility of the Case Comprehensive Cancer Center at Case Western Reserve University. The differentially expressed genes were identified using the Affymetrix GCOS software and the Ariadne Pathway Studio software.
Western blot analysis
Phosphorylation of ERK1 and ERK2 was determined by Western blot analysis using anti-ERK1 antibody (Santa Cruz Biotechnology, sc-94) and anti-phospho-p44/42 MAP kinase (Thr202/Tyr204) antibody (Cell Signaling Technology, #9101S). For Western blot detection of Dmp1, MLO-Y4 cells in 100 mm dishes were serum starved and treated with 10 ng/ml FGF2 for 21 h. Culture supernatant was concentrated from 6 ml to135 μl using centrifugal filter units (Millipore; Amicon Ultra-15) and supplemented with proteinase inhibitor cocktail (Thermo Scientific). Total cell lysates were prepared by lysing the cells in 20 mM Tris-HCl (pH8.0), 150 mM NaCl, 1% Triton X-100, 1 mM sodium orthovanadate, 1 mM sodium fluoride, 1 mM β-glycerophosphate, supplemented with proteinase inhibitor cocktail. Twenty microliters of concentrated medium or 40μg of total cellular protein was separated by 10% or 4–15% sodium dodecyl sulfate-polyacrylamide gel electrophoresis and electrophoretically transferred to polyvinylidene difluoride filters (Millipore). The filters were blocked in StartingBlock T20 Blocking Buffers (Thermo Scientific) containing 0.05% Tween-20 and then incubated with anti-mouse Dmp-1 antibody (R&D, AF4386) at 0.4 μg/ml. Filters were then incubated with the horseradish peroxidase-conjugated donkey anti-sheep IgG antibody (SantaCruz), and the signal was detected by enhanced chemiluminescence (Thermo Scientific). The signal was quantitated using ImageJ software (NIH, Bethesda, MD). Dmp1 protein levels in the supernatant were normalized by the total cellular protein as determined by bicinchoninic acid protein assay kit (Thermo Scientific). As an internal control, the expression of β-actin protein was evaluated using the anti-β-actin antibody (Cell Signaling Technology, #4967).
Histology
For von Kossa staining, bone samples were fixed in 10% formalin and embedded in paraffin. Seven-micron sections were stained with 5% silver nitrate solution for 5 min, fixed with 5% sodium thiosulfate for 3 min, and counterstained with nuclear fast red (KPL, Contrast RED). For Goldner’s trichrome staining, bone tissues were embedded in methyl methacrylate, and sections were stained using a standard protocol. For immunohistochemical detection of Dmp1, bone samples were fixed in 10% formalin, demineralized in 0.5M EDTA, and embedded in paraffin. Seven-micron sections were deparaffinized, and endogenous peroxidase activity was blocked with 3% H2O2 in methanol for 10 min. Then the sections were blocked with 10% normal donkey serum in phosphate buffer saline for 30 min. Sections were reacted with anti-mouse Dmp-1 antibody (R&D) for 2 h at room temperature. For control, anti-mouse Dmp-1 antibody was either omitted or replaced by normal sheep IgG at the same concentration. The sections were further incubated with the secondary antibody (donkey anti-sheep IgG conjugated to biotin) for 30 min, and reacted with streptavidin horseradish-peroxidase (Biocare) for 15 min, followed by incubation with diaminobenzidine (Vector Laboratories: ImmPACT DAB). Sections were counterstained with hematoxylin. Samples were photographed using a Leica DM 6000B microscope, Leica DC500 digital camera, and Leica Application Suite 1.3 software.
Scanning electron microscopy
To image the osteocyte lacunar-canalicular system, acid-etched, resin-casted samples were analyzed by SEM [21]. Bone samples were first fixed in 70% ethanol, embedded in methyl methacrylate, and sliced with a tungsten carbide knife. The surface of the specimens was polished sequentially using a wet 1,200 grit Carbimet 2 Abrasive Disc (P2500, Buehler) and Microcloth (Buehler) with 1.0, 0.25, and 0.05 μm Metadi Supreme Diamond suspension (Buehler). The polished surface was acid-etched in 9% phosphoric acid for 1 min and immersed in sodium hypochlorite (bleach) for 5 min. Specimens were sputter coated with 3–5 nm of palladium using Denton Desk IV. Scanning electron microscope images were collected using the Helios Nanolab-650 Dual Beam FIB system (FEI) or Nova Nano-lab 200 (FEI) with accelerating voltage of 2–3 kV.
Measurement of serum phosphate concentration
To determine serum phosphate concentration, blood was collected from control and ERK1−/−; ERK2flox/flox; Prx1-Cre mice at P0. Then serum was separated, and phosphate concentration was measured using the phosphate assay kit (Stanbio).
Statistical analysis of data
Statistical analysis was performed using Analyse-it (Analyse-it Software). A one way ANOVA analysis followed by Fisher’s least significant difference (LSD) for post-hoc analysis was used to compare the four groups of different treatment. A t-test was applied to compare the control group and PD173074 treatment group. P values <0.05 were considered statistically significant.
Results
FGF receptor expression and FGF2-induced ERK activation in MLO-Y4 cells
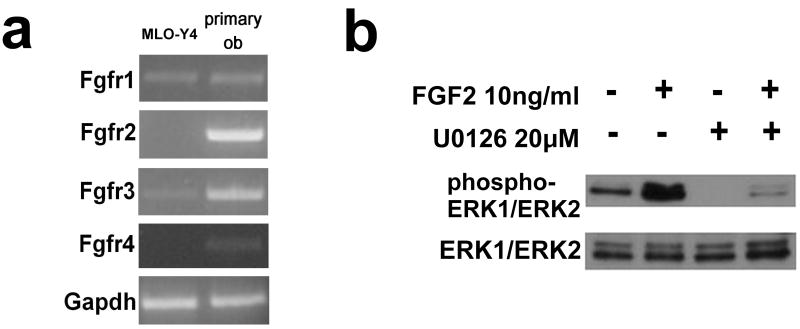
To identify FGF receptors that mediate FGF signaling in MLO-Y4 cells and primary calvaria osteoblasts, we first examined the expression of Fgfr1, Fgfr2, Fgfr3, and Fgfr4 by semi-quantitative RT-PCR. While primary calvaria osteoblasts expressed all of the four FGF receptors, only Fgfr1 and Fgfr3 mRNAs were detected in MLO-Y4 cells (Fig. 1a).
Fig. 1.
(a) FGF receptor expression in MLO-Y4 cells and primary calvaria osteoblasts (primary ob). The expression of Fgfr1, Fgfr2, Fgfr3 and Fgfr4 was examined by semi-quantitative RT-PCR. (b) Western blot analysis showing the activation of the ERK MAPK pathway by FGF2 and its inhibition by U0126. MLO-Y4 cells were treated with U0126 or its solvent DMSO for 45 min followed by FGF2 treatment for 120 min. Total cell lysates were subjected to Western blot analysis. The bottom panel shows total ERK1/2 expression and upper panel shows phosphorylated ERK1/2.
We next examined activation of the ERK MAPK pathway by FGF2 and its inhibition by the MEK inhibitor U0126 in MLO-Y4 cells. Western blot analysis using the phospho-specific antibody indicated that FGF2 induces ERK phosphorylation at Thr202 and Tyr204, and that U0126 strongly inhibits FGF2-induced ERK phosphorylation (Fig. 1b).
FGF2 regulates mineralization-related genes in MLO-Y4 cells through the ERK MAPK pathway
To investigate the roles of the ERK MAPK pathway and FGF signaling in the late stages of osteoblast differentiation, we performed microarray analysis using the osteocyte cell line MLO-Y4. MLO-Y4 cells were treated with 10 ng/ml FGF2 in the presence or absence of 20 μM U0126. RNA was extracted 3 and 8 h after the treatment and subjected to microarray analysis. We identified 172 genes that were reproducibly increased or decreased at least twofold at 3 h after FGF2 treatment in two independent experiments (Supplementary Table 1). We also identified 434 genes that were reproducibly increased or decreased at least twofold at 8 h after FGF2 treatment. U0126 treatment reduced the number of FGF2-regulated genes to 25 and 85 at 3 and 8 h, respectively. Among genes that were differentially regulated by FGF2, at least four mineralization-related genes, Ank, Dmp1, Mgp, and Slc20a1, were upregulated by FGF2 in MLO-Y4 cells (Table 1). We also found that Enpp1 was downregulated twofold by U0126 at 8 h after treatment in one of the two experiments.
Table 1.
Five mineralization-related genes were identified by microarray analysis of FGF2 and U0126-treated MLO-Y4 cells. The cells were treated with 10 ng/ml FGF2 in the presence or absence of 20 μM U0126 for 8 h. The table shows the average fold changes of two independent experiments.
| Gene | Fold changes | |||
|---|---|---|---|---|
| symbol | name | FGF2 vs. control | U0126 vs. control | FGF2+U0126 vs. control |
| Dmp1 | Dentin matrix protein 1 | 7.07 | −11.1 | −1.08 |
| Ank | Progressive ankylosis | 3.56 | −1.96 | −1.12 |
| Mgp | Matrix Gla protein | 2.26 | −1.38 | −1.45 |
| Slc20a1 | Solute carrier family 20, member 1 | 6.0 | 1.39 | 2.49 |
| Enpp1 | Ectonucleotide pyrophosphatase/phosphodiesterase 1 | 1.0 | −1.71 | −1.21 |
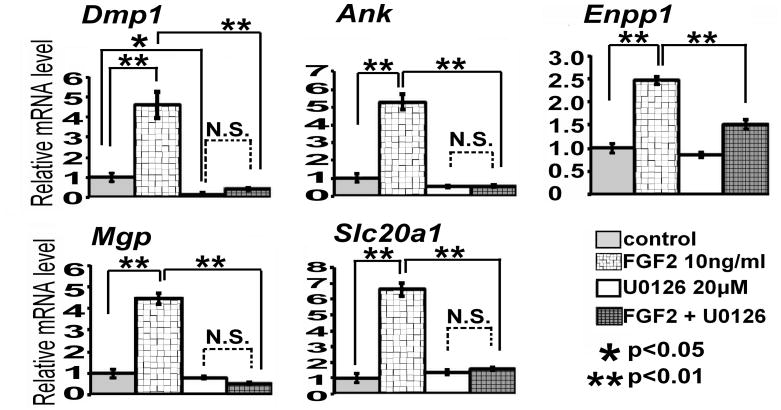
The regulation of the five mineralization-related genes, Ank, Dmp1, Mgp, Slc20a1, and Enpp1, was further confirmed by real-time PCR. FGF2 upregulated all of the five mineralization-related genes two- to sixfold after treatment, and this FGF2-induced upregulation was inhibited by U0126 (p<0.01) (Fig. 2). In the presence of U0126, FGF2 did not significantly increase Ank, Dmp1, Mgp, and Slc20a1 expression, strongly suggesting that the FGF2-induced upregulation was mediated by the ERK MAPK pathway. Furthermore, U0126 strongly inhibited basal expression of Dmp1 mRNA (p<0.05). Dmp1 mRNA expression decreased to 16% of control at 8 h after U0126 treatment. These results suggest that Dmp1 expression depends on ERK MAPK signaling.
Fig. 2.
Five mineralization-related genes were upregulated by FGF2 in MLO-Y4 cells, and the FGF2-induced upregulation was inhibited by U0126. The cells were treated with 10 ng/ml FGF2 in the presence or absence of 20μM U0126. RNA was extracted at 3 h after FGF2 treatment for Enpp1 and at 8 h for Dmp1, Ank, Mgp, and Slc20-a1. mRNA expression levels were examined by real-time PCR in triplicate. Data represent means ± standard deviations. The figure presents data from one of two experiments with similar results. (N.S.) Not significant.
PD173074 inhibits mineralization-related genes in mouse calvaria
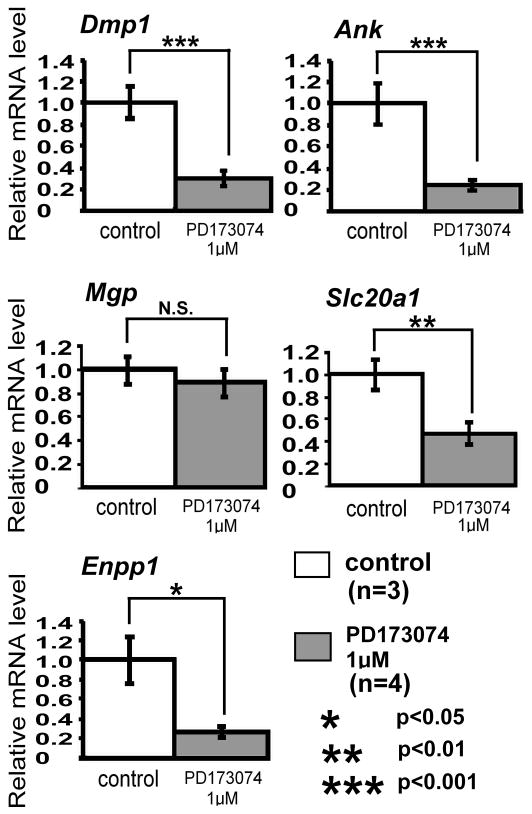
To address the role of FGF signaling in a more physiological context, we treated the whole neonatal calvaria with PD173074 in an organ culture system. PD173074 is a selective FGF receptor inhibitor that has been shown to inhibit all four FGF receptors [22–24]. The neonatal calvaria was treated with 1 μM of PD173074 for 24 h. The effects of PD173074 on various other kinases have been shown to be minimal at this concentration [23]. PD173074 inhibited Dmp1, Ank, Enpp1, and Slc20a1 expression by 70, 76, 74, and 53% of the control, respectively, while Mgp expression was unaffected (Fig. 3). These findings suggest that Dmp1, Ank, Enpp1, and Slc20a1 expression depends on FGF signaling.
Fig. 3.
PD173074 inhibits expression of Dmp1, Ank, Slc20a1, and Enpp1 in mouse calvaria in organ culture. Calvariae isolated from wild type embryos at 18.5 days post-gestation were maintained in organ culture and treated with the selective FGF receptor inhibitor PD173074 at 1 μM for 24 h. Expression of mineralization-related genes, Dmp1, Ank, Mgp, Slc20a1, and Enpp1 was examined by real-time PCR. Real-time PCR was done in triplicate for each calvaria sample. Data represent means ± standard deviations of 3 control calvariae and 4 calvariae treated with PD173074. The figure presents data from one of two experiments with similar results. *p<0.05, **p<0.01, ***p<0.001.
FGF2 inhibits mineralization of primary calvaria osteoblasts
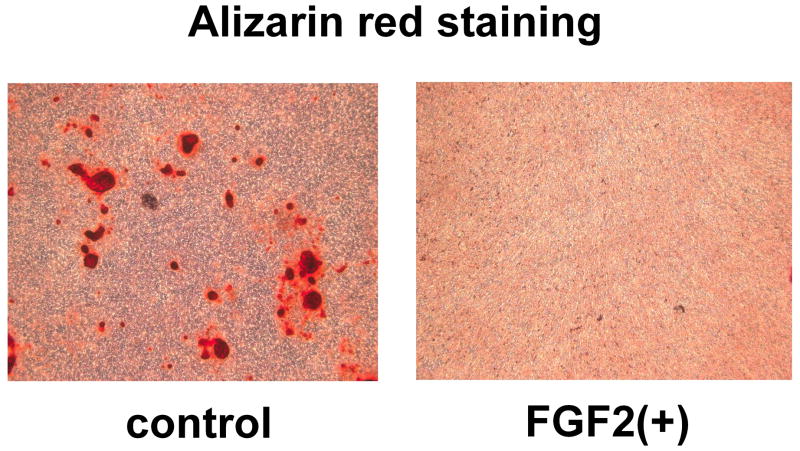
To examine the overall effects of FGF2 on mineralization, mineralization was induced in MLO-Y4 cells and primary calvaria osteoblasts in the presence or absence of FGF2. FGF2 treatment for 10 days resulted in reduced mineralization of primary calvaria osteoblasts as shown by alizarin red staining (Fig. 4). In contrast, MLO-Y4 cells did not mineralize their surrounding matrices as described previously [25].
Fig. 4.
FGF2 inhibited matrix mineralization of primary calvaria osteoblasts. Mineralization was induced in confluent primary osteoblast culture for 10 days by supplementing the medium with 5 mM β-glycerophosphate and 100 μg/ml ascorbic acid in the presence or absence of 10 ng/ml FGF2. Matrix mineralization was evaluated by alizarin red staining.
FGF2 increases Dmp1 mRNA and protein levels in MLO-Y4 cells
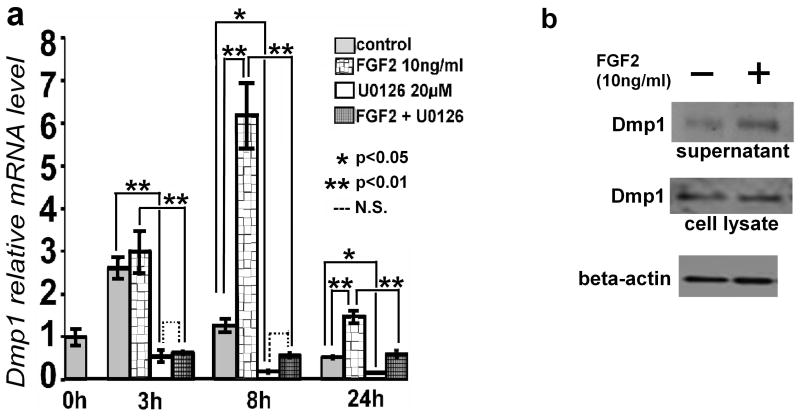
Since Dmp1 has been implicated in osteocyte differentiation, we focused our study on the regulation of Dmp1. We examined the time course of Dmp1 mRNA upregulation after FGF2 treatment. FGF2-induced Dmp1 expression reached its maximum at 8 h, and Dmp1 mRNA levels decreased thereafter (Fig. 5a). We further confirmed FGF2-induced Dmp1 upregulation at the protein level by Western blot analysis. It has been shown that full-length Dmp1 is proteolytically cleaved to form two fragments approximately 37 and 57 kDa [26]. The 57 kDa C-terminal fragment has been shown to regulate osteocyte maturation and mineralization [15]. Dmp1 protein was detected as a single band at 57 kDa in the culture supernatant of MLO-Y4 cells (Fig. 5b). FGF2 treatment increased Dmp1 protein levels in the supernatant two- to sixfold, consistent with FGF2 upregulation of Dmp1 mRNA expression. We did not observe an obvious increase in Dmp1 protein levels in total cell lysates, suggesting that Dmp1 protein does not accumulate inside the cells (Fig. 5b).
Fig. 5.
FGF2 increases Dmp1 mRNA and protein levels in MLO-Y4 cells. (a) Time-dependent increase of Dmp1 mRNA after FGF2 treatment. The cells were treated with 10 ng/ml FGF2 in the presence or absence of 20 μM U0126. RNA was isolated at 3, 8 and 24 h after FGF2 treatment. Dmp1 mRNA levels were measured by real-time PCR in triplicate. Data represent means ± standard deviations. (b) FGF2 increases Dmp1 protein levels in the culture supernatant of MLO-Y4 cells, while Dmp1 protein levels in total cell lysates remain unchanged. MLO-Y4 cells were treated with 10 ng/ml FGF2 in the absence of serum for 21 h. Culture supernatant was concentrated using centrifugal filter units and subjected to Western blot analysis. The bottom panel shows β-actin protein levels in total cell lysates as a loading control. The figure presents data from one of four experiments with similar results. (N.S.) Not significant.
FGF2 regulates Dmp1 expression in primary calvaria osteoblasts
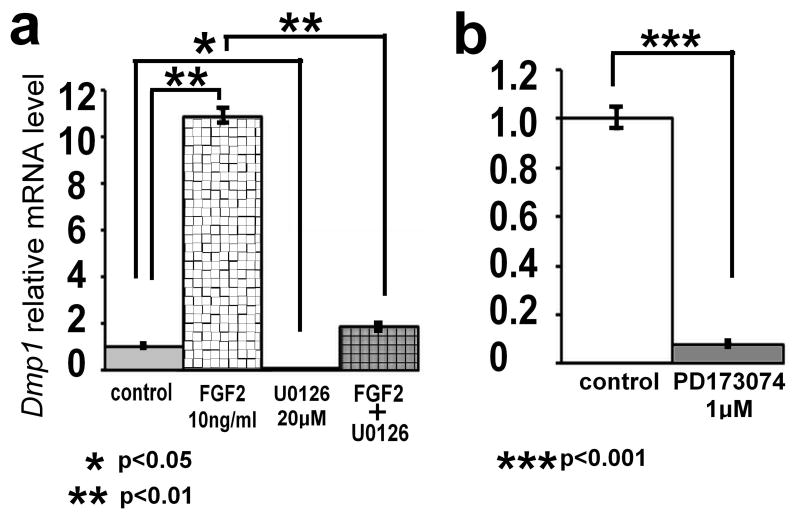
To examine the generality of FGF2-induced upregulation of Dmp1 mRNA in the osteoblast lineage, we further examined the effects of FGF2 in primary calvaria osteoblasts and preosteoblastic cell line MC3T3E1. Similar to MLO-Y4 osteocytes, FGF2 increased Dmp1 mRNA expression in primary calvaria osteoblasts and MC3T3E1 cells, and U0126 strongly inhibited basal Dmp1 expression and FGF2-induced upregulation (Fig. 6a and data not shown). In addition, the treatment of primary calvaria osteoblasts with selective FGF receptor inhibitor PD173074 strongly inhibited Dmp1 expression (p<0.001) (Fig. 6b).
Fig. 6.
FGF2 upregulates and PD173074 inhibits Dmp1 expression in primary calvaria osteoblasts. (a) Primary calvaria osteoblasts were treated with 10 ng/ml FGF2 in the presence or absence of 20 μM U0126. RNA was isolated at 7 h after FGF2 treatment. (b) Primary calvaria osteoblasts were treated with the selective FGF receptor inhibitor PD173074 at 1 μM. RNA was isolated at 31 h after PD173074 treatment. Dmp1 mRNA levels were examined by real-time PCR in triplicate. Data represent means ± standard deviations. The figure presents data from one of two experiments with similar results.
FGF2-induced upregulation of Dmp1 expression requires new protein synthesis
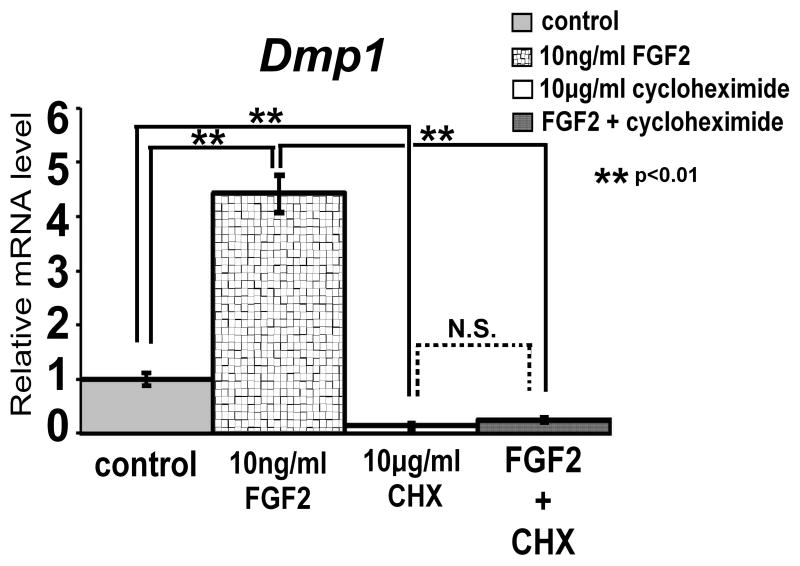
To further examine the mechanism of FGF2-induced upregulation of Dmp1 expression, we treated MLO-Y4 cells with 10 ng/ml FGF2 in the absence and presence of 10 μg/ml cycloheximide to block protein synthesis. FGF2-induced Dmp1 expression was significantly inhibited in the presence of cycloheximide (p<0.01), indicating that FGF2-induced upregulation of Dmp1 expression requires new protein synthesis (Fig. 7). Interestingly, cycloheximide treatment alone strongly inhibited Dmp1 expression, suggesting that continued protein synthesis is required for basal Dmp1 expression.
Fig. 7.
Cycloheximide inhibits FGF2-induced upregulation of Dmp1 expression. MLO-Y4 cells were treated with 10 ng/ml FGF2 in the presence or absence of 10 μg/ml cycloheximide (CHX). RNA was extracted at 7 h after FGF2 treatment, and Dmp1 mRNA expression was examined by real-time PCR in triplicate. Data represent means ± standard deviations. The figure presents data from one of two experiments with similar results. (N.S.) Not significant.
Inorganic phosphate levels modulate FGF2 regulation of Dmp1 expression in MLO-Y4 cells
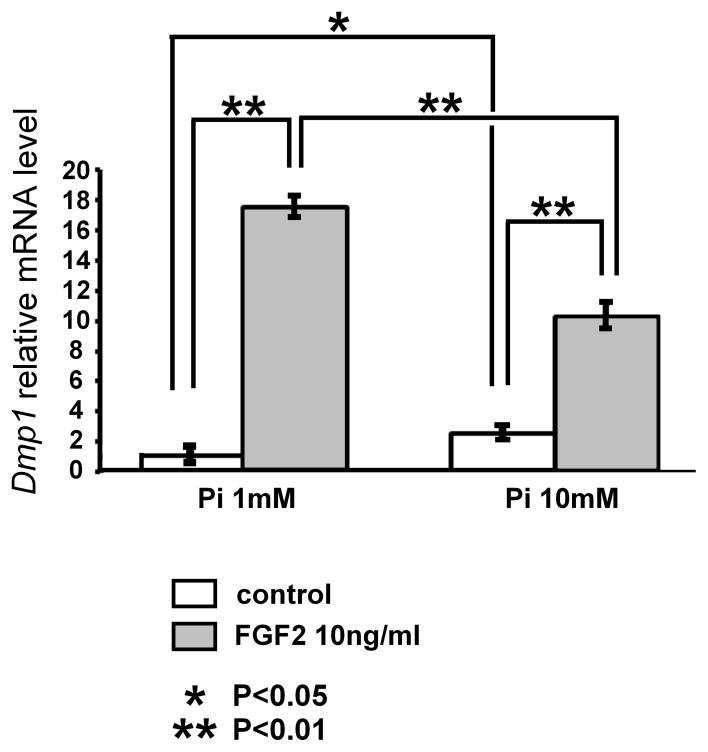
Since Dmp1 is implicated in phosphate homeostasis, we tested the effects of extracellular phosphate concentration on the regulation of Dmp1 mRNA expression by FGF2. MLO-Y4 cells were cultured in α-MEM containing 0.25% FCS and 0.25% calf serum and treated with 10 ng/ml FGF2 and sodium phosphate to achieve final phosphate concentrations of 1 and 10 mM. At phosphate concentration of 10 mM, Dmp1 mRNA levels induced by FGF2 were diminished by 40% compared to the cells cultured at low phosphate concentration of 1 mM (Fig. 8). On the other hand, phosphate treatment alone increased Dmp1 mRNA expression levels in the absence of FGF2. Overall, the magnitude of FGF2 effects on Dmp1 regulation is diminished by increased phosphate concentration.
Fig. 8.
Increased phosphate concentration diminishes the magnitude of FGF2 effects on Dmp1 regulation in MLO-Y4 cells. Cells were cultured in α-MEM containing 0.25% FCS and 0.25% calf serum, and treated with 10 ng/ml FGF2 in the presence of 1 or 10 mM phosphate. RNA was extracted at 8 h after FGF2 treatment, and Dmp1 mRNA expression was examined by real-time PCR in triplicate. Data represent means ± standard deviations. The figure presents data from one of three experiments with similar results. *p<0.05, **p<0.01
FGF23 increases Dmp1 expression in MLO-Y4 cells in the presence of Klotho
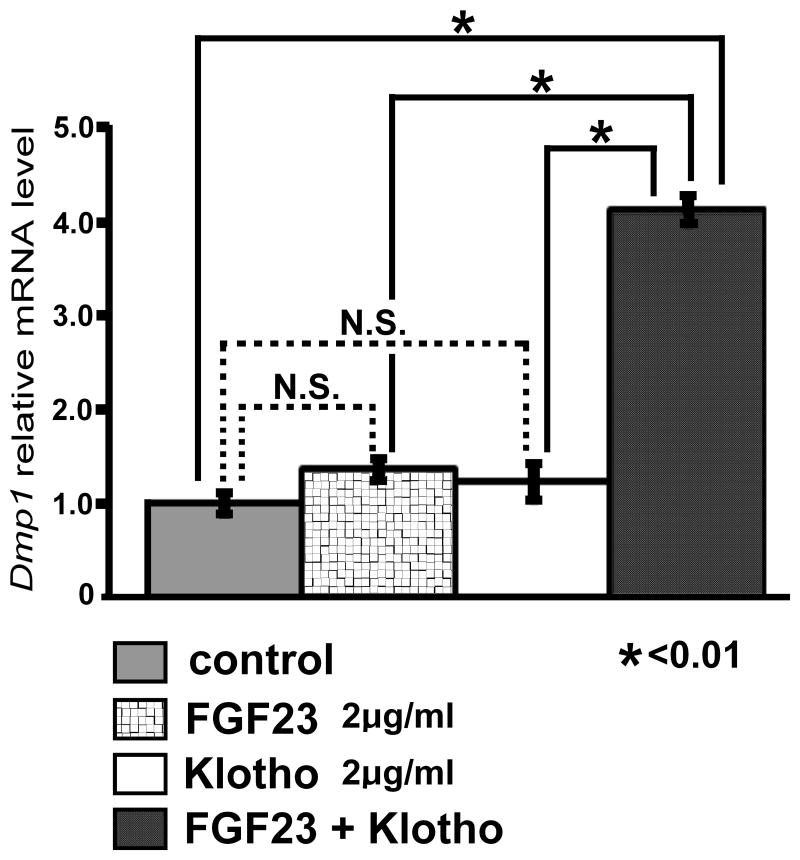
Since osteocytes produce FGF23, we further examined the effects of FGF23 on Dmp1 expression. MLO-Y4 cells were treated with 2μg/ml FGF23 and 2 μg/ml Klotho, the co-receptor for FGF23, either alone or in combination in the presence of 50μg/ml heparin. The combined treatment of FGF23 and Klotho upregulated Dmp1 mRNA expression fourfold at 8 h after the treatment, while either FGF23 or Klotho alone did not affect Dmp1 expression (Fig. 9).
Fig. 9.
FGF23 upregulates Dmp1 expression in MLO-Y4 cells in the presence of Klotho. Cells were incubated inα-MEM containing 0.25% FCS and 0.25% calf serum for 17 h and treated with 2μg/ml FGF23 and 2μg/ml Klotho either alone or in combination in the presence of 50 μg/ml heparin. RNA was extracted at 8 h after the treatment, and Dmp1 mRNA expression was examined by real-time PCR in triplicate. Data represent means ± standard deviations. The figure presents data from one of three experiments with similar results. *p<0.01 (N.S.) Not significant.
ERK1 and ERK2 inactivation abolishes Dmp1 expression in vivo
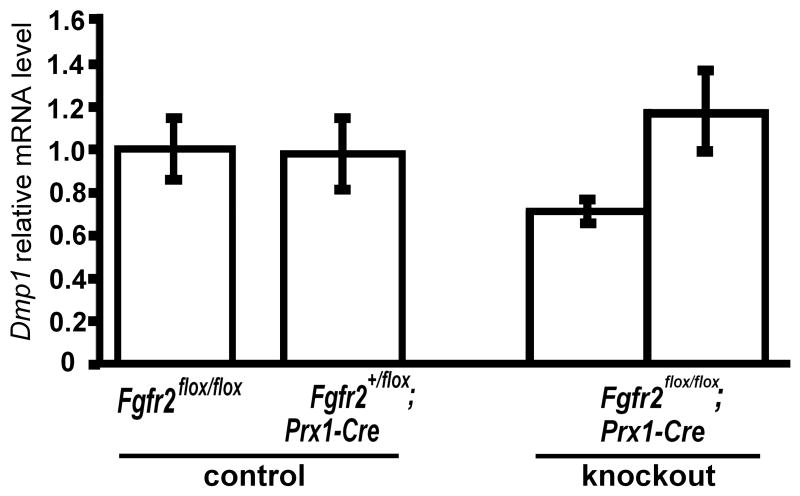
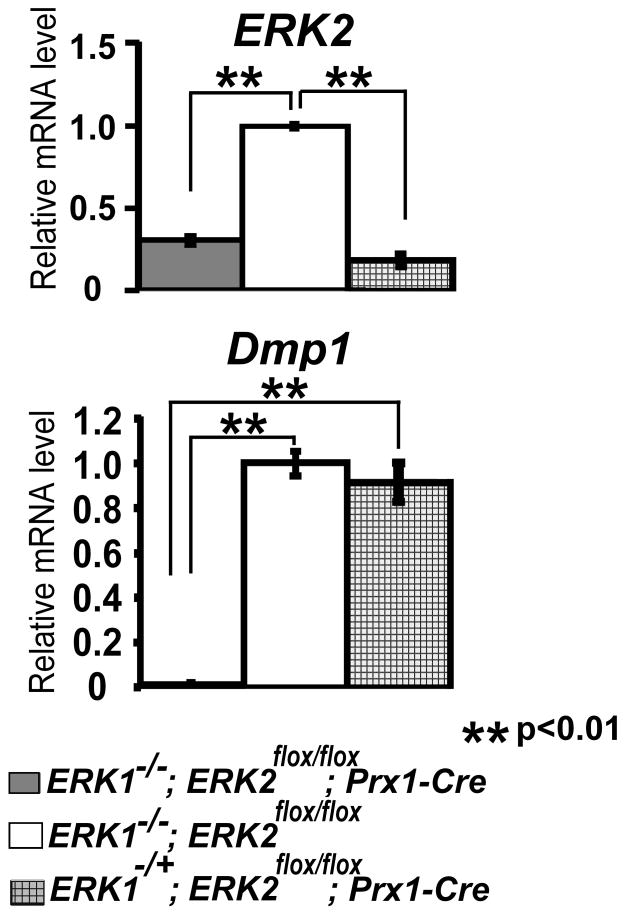
To examine the role of Fgfr2 and ERK1/ERK2 in Dmp1 expression in vivo, we examined Dmp1 expression in the skeletal elements, in which Fgfr2 and ERK1/ERK2 are inactivated using the Prx1-Cre transgene. While Dmp1 was normally expressed in the skeletal elements of Fgfr2flox/flox; Prx1-Cre embryos (Fig. 10), Dmp1 expression was remarkably decreased in the humeri and tibiae of ERK1−/−; ERK2flox/flox; Prx1-Cre embryos at embryonic day 16.5 (E16.5) (Fig. 11). In the humeri and tibiae, Dmp1 expression of ERK1−/−; ERK2flox/flox; Prx1-Cre mice was about 1.0 and 10% of control littermates, respectively.
Fig. 10.
Fgfr2 inactivation does not affect Dmp1 mRNA expression in vivo. Dmp1 expression in the combined samples of tibiae and femora of E18.5 Fgfr2flox/flox; Prx1-Cre and control littermate embryos was examined by real-time PCR. Data represent means ± standard deviations of samples from each individual embryo.
Fig. 11.
ERK1 and ERK2 inactivation abolishes Dmp1 mRNA expression in vivo. ERK2 and Dmp1 expression in the humeri of E16.5 ERK1−/−; ERK2flox/flox; Prx1-Cre and control littermate embryos was examined by real-time PCR. Data represent means ± standard deviations.
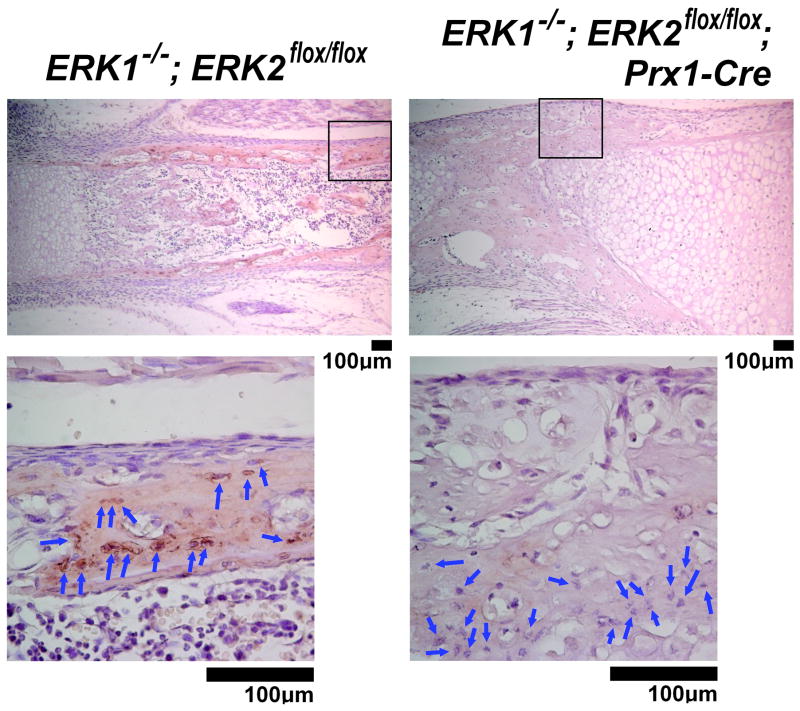
We further examined Dmp1 protein expression in osteocytes of ERK1−/−; ERK2flox/flox; Prx1-Cre mice by immunohistochemistry. Although ERK1−/−; ERK2flox/flox; Prx1-Cre mice showed a remarkable impairment of bone formation, bone-like architecture was observed in the diaphyses of long bones, and osteocyte-like cells were found within the bone-like matrix (Fig. 12). While intense staining for Dmp1 was observed in osteocytes and their surrounding matrices in control mice, immunoreactivity for Dmp1 was remarkably reduced in ERK1−/−; ERK2flox/flox; Prx1-Cre mice. Collectively, these observations indicate that ERK1 and ERK2 are essential for Dmp1 expression in osteocytes in vivo.
Fig. 12.
Immunohistochemical analysis for Dmp1 protein expression in the tibiae of ERK1−/−; ERK2flox/flox; Prx1-Cre mice at postnatal day 0. The staining for Dmp1 was remarkably reduced in osteocytes (blue arrows) of ERK1−/−; ERK2flox/flox; Prx1-Cre mice, whereas control littermate ERK1−/−; ERK2flox/flox mice showed intense staining in osteocytes and their surrounding matrices. The boxed area in the upper panel is magnified in the bottom panel.
Since Dmp1 is involved in phosphate regulation through FGF23, we further examined serum phosphate concentrations of ERK1−/−; ERK2flox/flox; Prx1-Cre mice at P0. There were no statistically significant differences between ERK1−/−; ERK2flox/flox; Prx1-Cre mice and control mice (data not shown).
ERK1 and ERK2 inactivation disrupts formation of lacunar-canalicular system
To examine the effects of ERK1 and ERK2 inactivation on the development of lacunar-canalicular system, acid-etched, resin-casted bone samples of ERK1−/−; ERK2flox/flox; Prx1-Cre mice were further examined by scanning electron microscopy. While osteocytes in the control mice show a typical morphology with dendritic processes, osteocytes in ERK1−/−; ERK2flox/flox; Prx1-Cre mice lack dendritic processes, indicating that ERK1 and ERK2 inactivation disrupts the formation of osteocyte lacunar-canalicular system (Fig. 13).
Fig. 13.
Scanning electron microscopy images of the acid-etched, resin-casted osteocyte lacunar-canalicular system in the tibia at postnatal day 0. While control ERK1+/−; ERK2+/flox; Prx1-Cre mice show osteocytes with characteristic dendritic processes and organized canaliculi (left panel), osteocytes in ERK1−/−; ERK2flox/flox; Prx1-Cre mice lack dendritic processes, and no canalicular system is observed.
Normal bone mineralization in the absence of ERK1 and ERK2
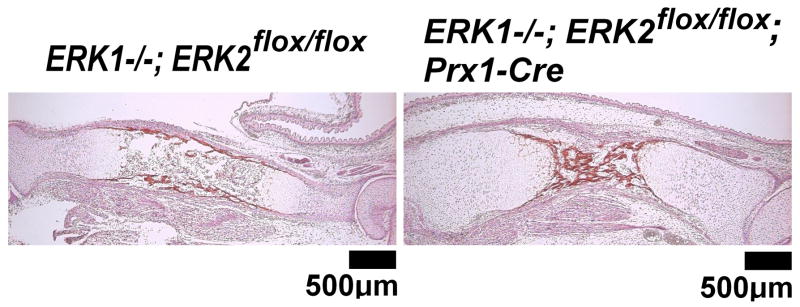
Since FGF signaling regulates mineralization-related genes in osteoblasts and osteocytes, we assessed matrix mineralization in the skeletal elements of ERK1−/−; ERK2flox/flox; Prx1-Cre mice by von Kossa staining at E16.5 and Goldner’s trichrome staining at P0 (Fig. 14 and data not shown). We observed no differences in matrix mineralization between control mice and ERK1−/−; ERK2flox/flox; Prx1-Cre mice. This observation suggests that despite impaired osteoblast and osteocyte differentiation in ERK1−/−; ERK2flox/flox; Prx1-Cre mice, the mineralization of bone matrix proceeds in the absence of ERK1 and ERK2.
Fig. 14.
von Kossa Staining of the tibia of ERK1−/−; ERK2flox/flox; Prx1-Cre and control embryos at E16.5. No difference in matrix mineralization was observed between ERK1−/−; ERK2flox/flox; Prx1-Cre and control mice.
Discussion
Our microarray analysis in MLO-Y4 osteocytes indicated that a number of mineralization-related genes are regulated by FGF2 via the ERK MAPK pathway. Dmp1 is a critical regulator of skeletal mineralization and phosphate homeostasis. Slc20a1 (Pit-1) is a sodium-dependent Pi co-transporter that regulates phosphate homeostasis [27]. Matrix Gla protein (MGP) is an inhibitor of mineralization implicated in vessel and cartilage calcification [28]. Ank is a transmembrane protein that transports intracellular pyrophosphate to the extracellular milieu [29]. Enpp1 (ectonucleotide pyrophosphatase/phosphodiesterase, PC-1) is a major generator of extracellular pyrophosphate (PPi), which inhibits hydroxyapatite crystal deposition and growth [30]. All of these genes were upregulated by FGF2, and U0126 inhibited FGF2-induced upregulation. While FGF2 regulation of Enpp1 and Ank has been reported in primary calvarial pre-osteoblasts [31, 32], the upregulation of Mgp, Slc20a1, and Dmp1 by FGFs has not been described previously. These results indicate that FGF signaling coordinately regulates mineralization-related genes in osteoblasts and osteocytes. Furthermore, the basal expression of Ank, Slc20a1, Enpp1, and Dmp1 was inhibited by the selective FGF receptor inhibitor PD173074 in mouse calvaria maintained in organ culture, strongly suggesting that FGF signaling is essential for the normal expression of Ank, Slc20a1, Enpp1, and Dmp1. While the significance of the coordinated regulation requires further investigation, the increase in Ank, Mgp, Enpp1 expression by FGF2 is consistent with previous reports showing the inhibitory effects of FGF signaling on mineralization in differentiated osteoblasts [3, 31, 33, 34]. While our experiments in primary calvaria osteoblasts also showed inhibitory effects of FGF signaling on mineralization, positive effects of FGF and ERK signaling on mineralization have been reported in other systems [35]. The apparent discrepancy may be due to the roles of FGF and ERK in promoting osteoblast differentiation, which in turn results in increased mineralization, while FGF and ERK also upregulate genes such as Ank, Mgp, and Enpp1 that inhibit mineralization. Depending on the specific experimental condition, either the former of the latter mechanisms may become more predominant.
Recent studies using genetically engineered mouse models have indicated that Dmp1 plays an important role in skeletal mineralization, osteoblast-osteocyte transition, and osteocyte maturation [11, 15]. Our experiments indicate that FGF2 upregulates Dmp1 expression in cells in the osteoblast lineage through the ERK MAPK pathway, and FGF and ERK signaling are required for Dmp1 expression in osteoblasts and osteocytes. Since Dmp1 is predominantly expressed in osteocytes in the osteoblast lineage, our results suggest that FGF and ERK signaling play an essential role in the late stages of osteoblast differentiation. The role of FGF on osteocyte differentiation may not be a simple acceleration, since we also found that FGF2 inhibits Sost expression in primary calvaria osteoblasts (data not shown).
Another important function of DMP1 is the regulation of phosphate homeostasis through FGF23. FGF23 is secreted from osteocytes, and circulating FGF23 increases renal phosphate excretion. Loss-of-function mutations in DMP1 cause ARHR in humans, and both patients with DMP1 mutations and Dmp1-null mice show hypophosphatemia with increased FGF23 expression in osteocytes. We found that FGF23 increases Dmp1 expression in MLO-Y4 cells in the presence of Klotho, a cofactor essential for FGF23 receptor binding [36, 37]. The lack of response to FGF23 alone is consistent with our observation that Klotho mRNA was not detected in MLO-Y4 cells by real-time PCR (data not shown). Our results suggest the possibility that osteocyte-derived FGF23 might regulate Dmp1 expression locally depending on the availability of Klotho.
We also examined Fgf23 expression in FGF2 and U0126-treated MLO-Y4 cells. We found that FGF23 expression was not affected by FGF2 or U0126 in MLO-Y4 cells, indicating that FGF2 and U0126 regulate Dmp1 expression independent of Fgf23 expression (data not shown). Our results also showed that the regulation of Dmp1 expression by FGF2 is modulated by extracellular inorganic phosphate levels. It is interesting to speculate that FGF and inorganic phosphate coordinately regulate Dmp1 expression in osteocytes to regulate phosphate homeostasis.
FGF receptors are likely to play both redundant and distinct roles in bone development, since various mutations in FGF receptors in mice and humans cause both overlapping and distinct phenotypes [2, 3, 38, 39]. Given the importance of FGF signaling and Dmp1 in the skeletal system, it is of interest to identify FGF receptors that regulate Dmp1 expression. PD173074, which blocks all isoforms of FGF receptors, inhibited Dmp1 expression in the mouse calvaria, indicating the requirement of FGF signaling for Dmp1 expression. However, Dmp1 was normally expressed in the skeletal elements of Fgfr2flox/flox; Prx1-Cre mice, suggesting that signals from other FGF receptors contribute to Dmp1 expression (Fig. 10). This is also consistent with our observations that FGF2 upregulates Dmp1 in MLO-Y4 cells that express only Fgfr1 and Fgfr3. The remarkable inhibition of Dmp1 expression by U0126 in MLO-Y4 cells and the lack of Dmp1 expression in osteocytes of ERK1−/−;ERK2flox/flox;Prx1-Cre mice indicate the requirement of ERK MAPK signaling for Dmp1 expression. Because ERK1 and ERK2 are common downstream effectors of Fgfr1, Fgfr2, Fgfr3, and Fgfr4, signals originating from any of the four FGF receptors may regulate Dmp1.
In summary, we have shown that a number of mineralization-related genes are regulated by FGF2 in a MAPK-dependent manner in the osteocyte cell line MLO-Y4. Our experiments also indicate that Dmp1 expression in osteoblasts and osteocytes requires FGF and ERK MAPK signaling, and ERK1 and ERK2 are essential for osteocyte differentiation and the development of osteocyte lacunar-canalicular system. Further analysis of FGF and MAPK signaling in osteocytes will provide novel information on the mechanisms of osteocyte differentiation and mineral homeostasis.
Supplementary Material
Acknowledgments
We thank Lynda Bonewald for MLO-Y4 cells and James Martin for Prx1-Cre mice. We also thank Teresa Pizzuto and Ajay Singh for technical assistance and Valerie Schmedlen for editorial assistance. Work in the laboratory of the authors was supported by NIH grants R01AR055556 and R03DE019814 to S.M. The Gene Expression and Genotyping Facility of the Case Comprehensive Cancer Center was supported by NIH grant P30CA43703.
References
- 1.Montero A, Okada Y, Tomita M, Ito M, Tsurukami H, Nakamura T, Doetschman T, Coffin JD, Hurley MM. Disruption of the fibroblast growth factor-2 gene results in decreased bone mass and bone formation. J Clin Invest. 2000;105:1085–1093. doi: 10.1172/JCI8641. [DOI] [PMC free article] [PubMed] [Google Scholar]
- 2.Yu K, Xu J, Liu Z, Sosic D, Shao J, Olson EN, Towler DA, Ornitz DM. Conditional inactivation of FGF receptor 2 reveals an essential role for FGF signaling in the regulation of osteoblast function and bone growth. Development. 2003;130:3063–3074. doi: 10.1242/dev.00491. [DOI] [PubMed] [Google Scholar]
- 3.Jacob AL, Smith C, Partanen J, Ornitz DM. Fibroblast growth factor receptor 1 signaling in the osteo-chondrogenic cell lineage regulates sequential steps of osteoblast maturation. Dev Biol. 2006;296:315–328. doi: 10.1016/j.ydbio.2006.05.031. [DOI] [PMC free article] [PubMed] [Google Scholar]
- 4.Wilkie AO. Bad bones, absent smell, selfish testes: the pleiotropic consequences of human FGF receptor mutations. Cytokine Growth Factor Rev. 2005;16:187–203. doi: 10.1016/j.cytogfr.2005.03.001. [DOI] [PubMed] [Google Scholar]
- 5.Debiais F, Lemonnier J, Hay E, Delannoy P, Caverzasio J, Marie PJ. Fibroblast growth factor-2 (FGF-2) increases N-cadherin expression through protein kinase C and Src-kinase pathways in human calvaria osteoblasts. J Cell Biochem. 2001;81:68–81. doi: 10.1002/1097-4644(20010401)81:1<68::aid-jcb1024>3.0.co;2-s. [DOI] [PubMed] [Google Scholar]
- 6.Murakami S, Balmes G, McKinney S, Zhang Z, Givol D, de Crombrugghe B. Constitutive activation of MEK1 in chondrocytes causes Stat1-independent achondroplasia-like dwarfism and rescues the Fgfr3-deficient mouse phenotype. Genes Dev. 2004;18:290–305. doi: 10.1101/gad.1179104. [DOI] [PMC free article] [PubMed] [Google Scholar]
- 7.Matsushita T, Wilcox WR, Chan YY, Kawanami A, Bukulmez H, Balmes G, Krejci P, Mekikian PB, Otani K, Yamaura I, Warman ML, Givol D, Murakami S. FGFR3 promotes synchondrosis closure and fusion of ossification centers through the MAPK pathway. Hum Mol Genet. 2009;18:227–240. doi: 10.1093/hmg/ddn339. [DOI] [PMC free article] [PubMed] [Google Scholar]
- 8.Matsushita T, Chan YY, Kawanami A, Balmes G, Landreth GE, Murakami S. Extracellular signal-regulated kinase 1 (ERK1) and ERK2 play essential roles in osteoblast differentiation and in supporting osteoclastogenesis. Mol Cell Biol. 2009;29:5843–5857. doi: 10.1128/MCB.01549-08. [DOI] [PMC free article] [PubMed] [Google Scholar]
- 9.Bentires-Alj M, Kontaridis MI, Neel BG. Stops along the RAS pathway in human genetic disease. Nat Med. 2006;12:283–285. doi: 10.1038/nm0306-283. [DOI] [PubMed] [Google Scholar]
- 10.Aoki Y, Niihori T, Narumi Y, Kure S, Matsubara Y. The RAS/MAPK syndromes: novel roles of the RAS pathway in human genetic disorders. Hum Mutat. 2008;29:992–1006. doi: 10.1002/humu.20748. [DOI] [PubMed] [Google Scholar]
- 11.Feng JQ, Ward LM, Liu S, Lu Y, Xie Y, Yuan B, Yu X, Rauch F, Davis SI, Zhang S, Rios H, Drezner MK, Quarles LD, Bonewald LF, White KE. Loss of DMP1 causes rickets and osteomalacia and identifies a role for osteocytes in mineral metabolism. Nat Genet. 2006;38:1310–1315. doi: 10.1038/ng1905. [DOI] [PMC free article] [PubMed] [Google Scholar]
- 12.Tatsumi S, Ishii K, Amizuka N, Li M, Kobayashi T, Kohno K, Ito M, Takeshita S, Ikeda K. Targeted ablation of osteocytes induces osteoporosis with defective mechanotransduction. Cell Metab. 2007;5:464–475. doi: 10.1016/j.cmet.2007.05.001. [DOI] [PubMed] [Google Scholar]
- 13.Xiao ZS, Quarles LD. Role of the polycytin-primary cilia complex in bone development and mechanosensing. Ann N Y Acad Sci. 2010;1192:410–421. doi: 10.1111/j.1749-6632.2009.05239.x. [DOI] [PMC free article] [PubMed] [Google Scholar]
- 14.Dallas SL, Bonewald LF. Dynamics of the transition from osteoblast to osteocyte. Ann N Y Acad Sci. 2010;1192:437–443. doi: 10.1111/j.1749-6632.2009.05246.x. [DOI] [PMC free article] [PubMed] [Google Scholar]
- 15.Lu Y, Yuan B, Qin C, Cao Z, Xie Y, Dallas SL, McKee MD, Drezner MK, Bonewald LF, Feng JQ. The biological function of DMP1 in osteocyte maturation is mediated by its 57 kDa C-terminal fragment. J Bone Miner Res. 2011;26:331–340. doi: 10.1002/jbmr.226. [DOI] [PMC free article] [PubMed] [Google Scholar]
- 16.Kato Y, Windle JJ, Koop BA, Mundy GR, Bonewald LF. Establishment of an osteocyte-like cell line, MLO-Y4. J Bone Miner Res. 1997;12:2014–2023. doi: 10.1359/jbmr.1997.12.12.2014. [DOI] [PubMed] [Google Scholar]
- 17.Hill TP, Spater D, Taketo MM, Birchmeier W, Hartmann C. Canonical Wnt/beta-catenin signaling prevents osteoblasts from differentiating into chondrocytes. Dev Cell. 2005;8:727–738. doi: 10.1016/j.devcel.2005.02.013. [DOI] [PubMed] [Google Scholar]
- 18.Selcher JC, Nekrasova T, Paylor R, Landreth GE, Sweatt JD. Mice lacking the ERK1 isoform of MAP kinase are unimpaired in emotional learning. Learn Mem. 2001;8:11–19. doi: 10.1101/lm.37001. [DOI] [PMC free article] [PubMed] [Google Scholar]
- 19.Samuels IS, Karlo JC, Faruzzi AN, Pickering K, Herrup K, Sweatt JD, Saitta SC, Landreth GE. Deletion of ERK2 mitogen-activated protein kinase identifies its key roles in cortical neurogenesis and cognitive function. J Neurosci. 2008;28:6983–6995. doi: 10.1523/JNEUROSCI.0679-08.2008. [DOI] [PMC free article] [PubMed] [Google Scholar]
- 20.Logan M, Martin JF, Nagy A, Lobe C, Olson EN, Tabin CJ. Expression of Cre Recombinase in the developing mouse limb bud driven by a Prxl enhancer. Genesis. 2002;33:77–80. doi: 10.1002/gene.10092. [DOI] [PubMed] [Google Scholar]
- 21.Kubek DJ, Gattone VH, 2nd, Allen MR. Methodological assessment of acid-etching for visualizing the osteocyte lacunar-canalicular networks using scanning electron microscopy. Micro Res Tech. 2010;73:182–186. doi: 10.1002/jemt.20772. [DOI] [PubMed] [Google Scholar]
- 22.Koziczak M, Holbro T, Hynes NE. Blocking of FGFR signaling inhibits breast cancer cell proliferation through downregulation of D-type cyclins. Oncogene. 2004;23:3501–3508. doi: 10.1038/sj.onc.1207331. [DOI] [PubMed] [Google Scholar]
- 23.Pardo OE, Latigo J, Jeffery RE, Nye E, Poulsom R, Spencer-Dene B, Lemoine NR, Stamp GW, Aboagye EO, Seckl MJ. The fibroblast growth factor receptor inhibitor PD173074 blocks small cell lung cancer growth in vitro and in vivo. Cancer Res. 2009;69:8645–8651. doi: 10.1158/0008-5472.CAN-09-1576. [DOI] [PubMed] [Google Scholar]
- 24.St-Germain JR, Taylor P, Tong J, Jin LL, Nikolic A, Stewart II, Ewing RM, Dharsee M, Li Z, Trudel S, Moran MF. Multiple myeloma phosphotyrosine proteomic profile associated with FGFR3 expression, ligand activation, and drug inhibition. Proc Natl Acad Sci USA. 2009;106:20127–20132. doi: 10.1073/pnas.0910957106. [DOI] [PMC free article] [PubMed] [Google Scholar]
- 25.Kato Y, Boskey A, Spevak L, Dallas M, Hori M, Bonewald LF. Establishment of an osteoid preosteocyte-like cell MLO-A5 that spontaneously mineralizes in culture. J Bone Miner Res. 2001;16:1622–1633. doi: 10.1359/jbmr.2001.16.9.1622. [DOI] [PubMed] [Google Scholar]
- 26.Qin C, Brunn JC, Cook RG, Orkiszewski RS, Malone JP, Veis A, Butler WT. Evidence for the proteolytic processing of dentin matrix protein 1. Identification and characterization of processed fragments and cleavage sites. J Biol Chem. 2003;278:34700–34708. doi: 10.1074/jbc.M305315200. [DOI] [PubMed] [Google Scholar]
- 27.Li X, Giachelli CM. Sodium-dependent phosphate cotransporters and vascular calcification. Curr Opin Nephrol Hypertens. 2007;16:325–328. doi: 10.1097/MNH.0b013e3281c55ef1. [DOI] [PubMed] [Google Scholar]
- 28.Luo G, Ducy P, McKee MD, Pinero GJ, Loyer E, Behringer RR, Karsenty G. Spontaneous calcification of arteries and cartilage in mice lacking matrix GLA protein. Nature. 1997;386:78–81. doi: 10.1038/386078a0. [DOI] [PubMed] [Google Scholar]
- 29.Ho AM, Johnson MD, Kingsley DM. Role of the mouse ank gene in control of tissue calcification and arthritis. Science. 2000;289:265–270. doi: 10.1126/science.289.5477.265. [DOI] [PubMed] [Google Scholar]
- 30.Hessle L, Johnson KA, Anderson HC, Narisawa S, Sali A, Goding JW, Terkeltaub R, Millan JL. Tissue-nonspecific alkaline phosphatase and plasma cell membrane glycoprotein-1 are central antagonistic regulators of bone mineralization. Proc Natl Acad Sci USA. 2002;99:9445–9449. doi: 10.1073/pnas.142063399. [DOI] [PMC free article] [PubMed] [Google Scholar]
- 31.Hatch NE, Nociti F, Swanson E, Bothwell M, Somerman M. FGF2 alters expression of the pyrophosphate/phosphate regulating proteins, PC-1, ANK and TNAP, in the calvarial osteoblastic cell line, MC3T3E1(C4) Connect Tissue Res. 2005;46:184–192. doi: 10.1080/03008200500237203. [DOI] [PubMed] [Google Scholar]
- 32.Hatch NE, Franceschi RT. Osteoblast differentiation stage-specific expression of the pyrophosphate-generating enzyme PC-1. Cells Tissues Organs. 2009;189:65–69. doi: 10.1159/000151375. [DOI] [PMC free article] [PubMed] [Google Scholar]
- 33.Mansukhani A, Bellosta P, Sahni M, Basilico C. Signaling by fibroblast growth factors (FGF) and fibroblast growth factor receptor 2 (FGFR2)-activating mutations blocks mineralization and induces apoptosis in osteoblasts. J Cell Biol. 2000;149:1297–1308. doi: 10.1083/jcb.149.6.1297. [DOI] [PMC free article] [PubMed] [Google Scholar]
- 34.Kono SJ, Oshima Y, Hoshi K, Bonewald LF, Oda H, Nakamura K, Kawaguchi H, Tanaka S. Erk pathways negatively regulate matrix mineralization. Bone. 2007;40:68–74. doi: 10.1016/j.bone.2006.07.024. [DOI] [PubMed] [Google Scholar]
- 35.Miraoui H, Oudina K, Petite H, Tanimoto Y, Moriyama K, Marie PJ. Fibroblast growth factor receptor 2 promotes osteogenic differentiation in mesenchymal cells via ERK 1/2 and protein kinase C signaling. J Biol Chem. 2009;284:4897–4904. doi: 10.1074/jbc.M805432200. [DOI] [PubMed] [Google Scholar]
- 36.Kurosu H, Ogawa Y, Miyoshi M, Yamamoto M, Nandi A, Rosenblatt KP, Baum MG, Schiavi S, Hu MC, Moe OW, Kuro-o M. Regulation of fibroblast growth factor-23 signaling by klotho. J Biol Chem. 2006;281:6120–6123. doi: 10.1074/jbc.C500457200. [DOI] [PMC free article] [PubMed] [Google Scholar]
- 37.Urakawa I, Yamazaki Y, Shimada T, Iijima K, Hasegawa H, Okawa K, Fujita T, Fukumoto S, Yamashita T. Klotho converts canonical FGF receptor into a specific receptor for FGF23. Nature. 2006;444:770–774. [Google Scholar]
- 38.Bellus GA, Gaudenz K, Zackai EH, Clarke LA, Szabo J, Francomano CA, Muenke M. Identical mutations in three different fibroblast growth factor receptor genes in autosomal dominant craniosynostosis syndromes. Nat Genet. 1996;14:174–176. doi: 10.1038/ng1096-174. [DOI] [PubMed] [Google Scholar]
- 39.White KE, Cabral JM, Davis SI, Fishburn T, Evans WE, Ichikawa S, Fields J, Yu X, Shaw NJ, McLellan NJ, McKeown C, Fitzpatrick D, Yu K, Ornitz DM, Econs MJ. Mutations that cause osteoglophonic dysplasia define novel roles for FGFR1 in bone elongation. Am J Hum Genet. 2005;76:361–367. doi: 10.1086/427956. [DOI] [PMC free article] [PubMed] [Google Scholar]
Associated Data
This section collects any data citations, data availability statements, or supplementary materials included in this article.


