Abstract
Epileptic seizures are a common and poorly understood co-morbidity for individuals with primary brain tumors. To investigate peritumoral seizure etiology, we implanted patient-derived glioma cells into scid mice. Within 14–18 days, glioma-bearing animals developed spontaneous, recurring abnormal EEG events consistent with epileptic activity that progressed over time. Acute brain slices from these animals showed significant glutamate release from the tumor mediated by the system xc− cystine/glutamate transporter. Biophysical and optical recordings showed glutamatergic epileptiform hyperexcitability that spread into adjacent brain. Glutamate release from the tumor and the ensuing hyperexcitability were inhibited by sulfasalazine (Azulfidine), an FDA approved drug that blocks system xc−. Acute administration of sulfasalazine at concentrations equivalent to that used by those with Crohn’s disease reduced epileptic event frequency in tumor-bearing mice. Sulfasalazine should be considered as an adjuvant treatment to ameliorate peritumoral seizures associated with glioma.
Keywords: system xc−, tumor-associated epilepsy, glioma, sulfasalazine, EEG
Gliomas are the deadliest and most common of primary brain tumors and currently lack effective treatments. They grow relentlessly often causing profound neurological impairments as the enlarging tumor impinges on vital brain structures. Peritumoral seizures are an early symptom and up to 80% of those with glioma experience at least one seizure during the course of their illness 1,2. Approximately one third of individuals develop recurrent seizures, known as tumor-associated epilepsy 3, and these can be refractory to traditional anti-epileptic medication 2. The etiology of tumor associated seizures and their relationship with tumor growth is poorly understood. Increased glutamate levels have been implicated in numerous seizure disorders and glutamate can reach neurotoxic levels immediately preceding and during spontaneous seizures 4. Previous studies conducted in both humans with glioma and glioma-implanted animals have suggested that epileptiform activity originates within the peritumoral border, 1–2 mm away from the tumor mass, where invading tumor cells surround neurons 5–7. A recent clinical study involving nine glioma patients examined glutamate concentrations in CNS dialysates taken from peritumoral cortex and from uninvolved brain, and found peritumoral glutamate levels above 100 μM, 100-fold higher than levels in uninvolved brain 8. This increase in peritumoral glutamate may be ascribed to the activity of the Na+-independent system xc− cystine/glutamate transporter 9–11. System xc− is a heterodimeric transporter consisting of a catalytic (xCT) and a regulatory (CD98) subunit, both of which are highly expressed by glioma cells 12. System xc− imports cystine for the synthesis of the antioxidant glutathione, and cystine uptake is coupled to glutamate release 13,14.
In this study, we hypothesize that glutamate release from gliomas through system xc− activates glutamate receptors on peritumoral neurons, leading to neuronal hyperexcitability and epileptic activity. To elucidate the possible relationship between tumor-mediated glutamate release and epileptic activity, we modeled the disease in glioma-bearing mice to permit both in vivo and in situ analysis. Using EEG recordings, we found that abnormal EEG activity develops in tumor-bearing animals but not in controls. This activity presents as short duration abnormal EEG events that typically increase in frequency as the tumor progresses. Brain slices prepared from these animals show enhanced glutamate release and peritumoral neuronal hyperexcitability. This excitability spreads into the tumor-associated brain as shown by optical recordings. Importantly, pharmacological inhibition of system xc−-mediated glutamate release from gliomas by sulfasalazine (SAS), an FDA approved drug, inhibits peritumoral hyperexcitability and reduces epileptic event frequency in tumor-bearing mice.
Results
Glioma-bearing mice exhibit recurrent epileptic activity
We adopted a widely-used mouse model of glioma 15,16 to study the relationship between glutamate release from glioma cells and development of epileptic activity in vivo. Specifically, we implanted either the U251GFP human glioma cell line, or human glioma xenografts GBM12 and GBM22, intracranially into mice. The glioma xenografts originated from two patient biopsies and were propagated by ectopic implantation into the flanks of nude mice 17. These xenografts are currently considered the best available glioma model system because they retain gene and protein expression and exhibit their original invasive properties 17,18. We initially validated tumor growth following intracranial implantation of U251 cells engineered to express firefly-luciferase (U251ffluc) by imaging cell bioluminescence using a Xenogen IVIS system (Supplementary Fig. 1). In agreement with published reports 13, tumor size was similar between animals and correlated positively with bioluminescence intensity. Histological evaluation of the resulting tumor showed invasion into surrounding brain as commonly observed in the human disease (Supplementary Fig. 2). We validated expression of xCT, the catalytic subunit of system xc−, in all tumor types by Western blot, and, using 3H-glutamate tracer studies, show functional system xc− activity that was SAS-sensitive and Na+-independent (Supplementary Fig. 3).
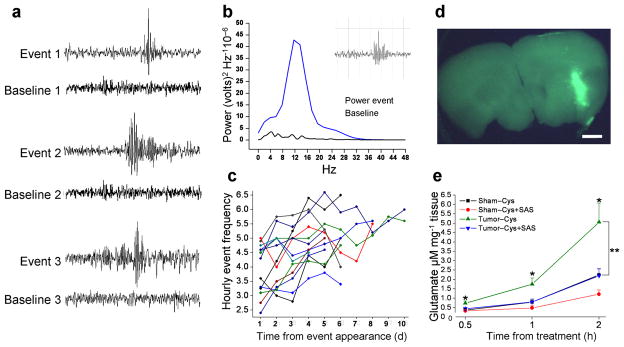
Intracranial EEG electrodes were placed in 86 glioma-implanted animals and 14 sham-operated control animals (sham) (15 groups), 1 week after glioma cell implantation. One week later, continuous EEG/video monitoring was conducted for 10–14 d. Spontaneous, recurring and unprovoked abnormal EEG activity was observed in 37.2% of glioma-bearing animals (n = 32) (Fig. 1a). Event duration was between 0.5 and 1 s (0.538 s ± 0.113, n = 400) (Fig. 1a), and events showed a discrete rise in the power spectrum at 12–15 Hz (Fig. 1b). Activity increased progressively over time (Fig. 1c). No abnormal activity was detected in any sham animal. Although 3 animals exhibited epileptic activity that progressed to tonic-clonic convulsions, the behavioral phenotype typically associated with these EEG events was subtle; mice exhibited freezing behavior with facial automatisms and head tremor, a finding that agrees with a previous study in glioma-bearing rats 7. EEG activity was similar in duration, amplitude and frequency to those described for post-traumatic epilepsy in humans and rodents 19; thus, in our study we refer to this as epileptic activity 19.
Figure 1.
Tumor-bearing mice exhibit abnormal spontaneous EEG activity indicative of epileptic activity. (a) Representative EEG recordings from 3 glioma-implanted animals juxtaposing abnormal events and baselines (BL) for each animal. (b) A power spectrum from one representative event (inset) and corresponding BL from the same animal. A distinct peak in the Power Spectrum between 12–15 Hz served as characteristic inclusion criteria. (c) Epileptic activity increases over time. Frequency of activity was quantified for 13 tumor-bearing mice over 10 consecutive days (d), with hourly event frequency plotted as a function of time. (d) U251GFP tumors were identified in acute cortical brain by fluorescence prior to conducting glutamate release assays. Scale bar = 1 mm. (e) Extracellular glutamate, released in the presence of 100 μM cystine, was measured from acute cortical brain slices from 7 sham-operated (n = 21 slices), and 9 U251GFP-implanted animals (n = 27) after 0.5, 1, and 2 h incubation. Glioma-bearing slices released significantly more glutamate, time-dependently, than sham slices at any time point *P < 0.05. In the presence of 250 μM SAS, glutamate release from glioma-bearing slices was significantly inhibited at 1 h (**P < 0.01) and 2 h (**P < 0.01) time points. Glutamate release from sham slices was not significantly affected by SAS at any time point.
Glutamate release is inhibited by blocking system xc−
We hypothesize that the epileptic activity in glioma-bearing mice was due to glutamate release by the tumor via the system xc− transporter. We prepared acute cortical slices containing tumor from 9 U251GFP-bearing and 7 sham animals (3 slices per animal), and measured glutamate release into the bath in the presence of 100 μM cystine by tandem HPLC-Mass Spectrometry. Slices were incubated individually and the presence of tumor confirmed by EGFP fluorescence (Fig. 1d). Glioma-bearing slices showed a time-dependent increase in glutamate compared to sham slices, with levels increasing to 5 μM after 2 h incubation (0.5 h: 0.3675 ± 0.07 control, 0.735 ± 0.111 tumor; 1 h: 0.7941 ± 0.15 control, 1.745 ± 0.33 tumor; 2 h: 2.242 ± 0.33 control, 5.059 ± 1.01 tumor) (*P < 0.05) (Fig. 1e). Due to glutamate dilution in the bath, and astrocytic uptake in tumor-free areas, the absolute concentration within peritumoral tissue is likely higher. To show that glutamate release occurred through system xc− , the same number of sister slices from these animals were incubated in bath containing 250μM SAS. SAS-treated slices released significantly less glutamate [1 h (0.7984 ± 0.15); 2 h (2.199 ± 0.36) (**P < 0.01)] (Fig. 1e). In sham slices, glutamate release was unaffected by SAS, suggesting that system xc− does not contribute significantly to glutamate release in tumor-free brain.
Glutamate release by gliomas induces epileptiform activity
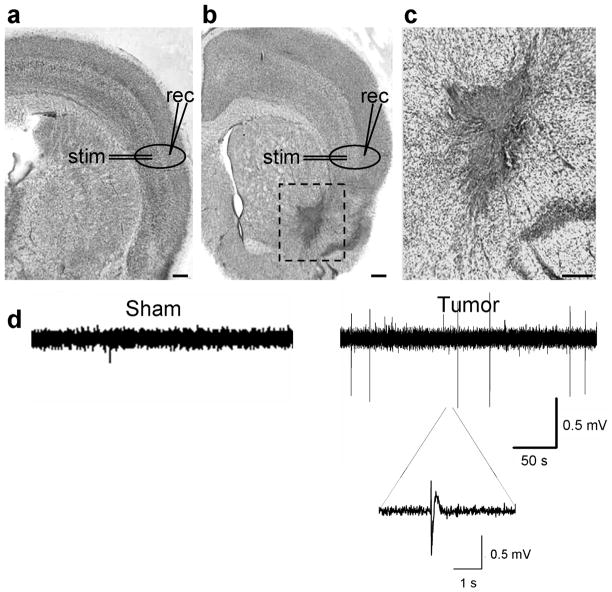
We next examined whether peritumoral brain exhibits abnormal spontaneous activity. An extracellular field recording electrode was placed in cortical layer II/III, 0.5–1.5 mm from the tumor, and in comparable regions of sham cortex (Fig. 2a–c). Short spontaneous paroxysmal discharges (100–500 ms) were observed in 23% of slices from 12 U251GFP glioma-bearing animals in Mg2+-containing ACSF (n = 43), yet these were absent in slices from 5 sham animals (n = 27) (Fig. 2d). Slice viability was validated by recording evoked activity in response to field electrode stimulation in deeper layer IV.
Figure 2.
Acute cortical slices from tumor-bearing mice exhibit spontaneous epileptiform activity. Examples of cresyl violet-stained brain slices from a sham (a), and a glioma-implanted animal (b), clearly shows the dark-stained U251GFP tumor. Scale bar = 350 μm. In the sham slice, the typical six-layered cortical lamination pattern is evident, but in the glioma-bearing slice, the lateral cortical laminar pattern is disorganized around the tumor. Recording (rec) and stimulating (stim) electrodes were placed in peritumoral regions and in corresponding regions of sham slices as shown. Tumor cells migrate deeper into the brain on white matter tracts (box), as shown in a slice at 10 x magnification (c). Scale bar = 150 μm. (d) Extracellular field recordings conducted in the presence of Mg2+ show spontaneous activity in the slice from a representative U251GFP-bearing animal that does not occur in the sham slice.
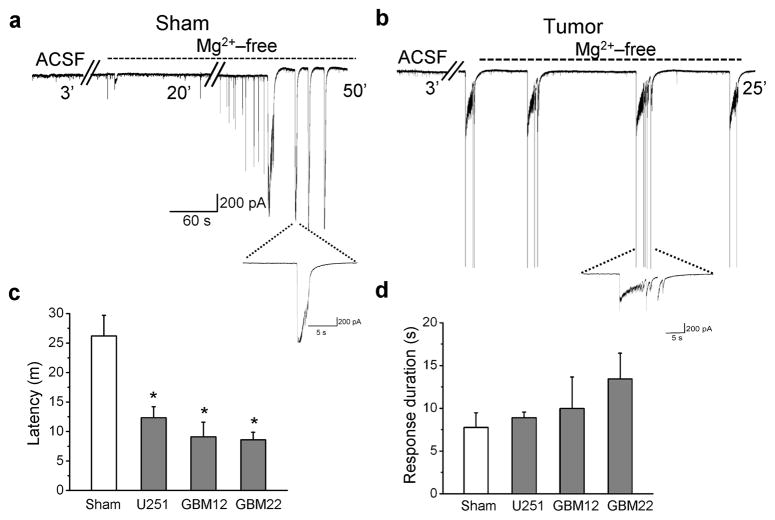
To further assess peritumoral neuronal excitability, we obtained whole-cell patch-clamp recordings from neurons in slices from 19 glioma-bearing and 4 sham animals. Excitability was enhanced by removal of extracellular Mg2+ that normally blocks NMDARs 20,21. All recordings were conducted in 100 μM cystine to assure sufficient substrate availability for system xc−. Peritumoral neurons exhibited a significantly shorter latency to the first epileptiform discharge in slices containing U251GFP (12 min ± 2, n = 16, *P < 0.05), GBM12 (9 min ± 2.5, n = 7,*P < 0.05) or GBM 22 (8.5 min ± 1.3, n = 13, *P < 0.05) tumors (Fig. 3a–c) as compared to shams (26 min ± 3.5, n = 16) Event duration was similar between slices containing tumors U251GFP (7.8 s ± 1.7, n = 12, P > 0.05), GBM12 (8.9 s ± 0.7, n = 5, P > 0.05), GBM22 (13 s ± 3, n = 8, P > 0.05), and sham slices (7 s ± 2, n = 11) (Fig. 3d).
Figure 3.
Acute cortical slices from tumor-bearing mice are hyperexcitable. Whole-cell recordings conducted in Mg2+-free bath on cortical slices from a sham-operated animal (a), and a tumor-bearing animal (b), illustrate a more rapid development of epileptiform activity in peritumoral neurons following Mg2+ removal as compared to sham neurons. Individual events are displayed on an expanded time scale below each recording. (c) Average latency to development of epileptiform activity was plotted for 16 neurons from 4 sham animals, and 16 U251GFP, 7 GBM12 and 13 GBM22 peritumoral neurons from 19 glioma-implanted animals. Latency was significantly shorter for peritumoral neurons compared to shams. *P < 0.05. (d) However, the average event duration was similar between all glioma-bearing slices and between glioma-bearing and sham slices.
Hyperexcitability spreads through cortical networks
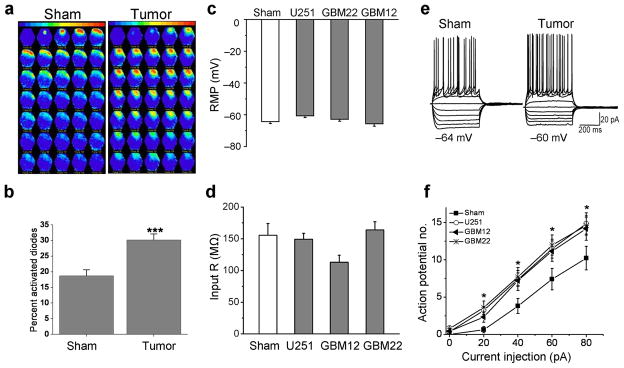
To evaluate peritumoral cortical network hyperexcitability, we used the voltage-sensitive dye RH414 with a Neuroplex 464 diode array to visualize the spatial-temporal propagation of voltage following brief electrical stimulation as previously described 22. The stimulating electrode was placed in acute cortical slices within 0.5–1.5 mm of U251GFP tumors and in comparable anatomical areas within sham slices. Pseudo-colored images correspond to the degree of membrane depolarization. Visual observation of array data revealed more pronounced spread of depolarization in glioma-bearing slices compared to shams in response to 80μA stimulating current (Fig. 4a). To quantify these differences, the amplitude, voltage spread, and response duration were measured in slices from U251GFP-implanted (n = 4) and sham-operated animals (n = 4). Response amplitude and duration were not significantly different between slices at 80μA stimulation (data not shown). However, the percentage of activated diodes registering a voltage change above baseline was significantly greater in glioma-bearing slices (30.17% ± 1.95, n = 11) compared to shams (18.77 % ± 1.88, n = 8, ***P < 0.001), consistent with an increased area of excitability (Fig. 4b).
Figure 4.
Acute cortical slices from glioma-bearing mice show increased cortical network activity and hyperexcitable layer II/III peritumoral pyramidal cells. (a) Representative examples of optical recordings comparing a slice from a sham and a slice from a U251GFP-bearing animal incubated in the voltage dye RH414, then field- stimulated with 80 μA. Each image is a pseudo-colored representation of activity measured using a Neuroplex 464-diode array. Adjacent frames are 1.8 ms apart. (b) Spread of voltage response, measured by the number of activated diodes within the array, was significantly greater in glioma-bearing slices compared to shams. **P < 0.01. Summary of RMP (c) and input resistance (IR) (d) recorded using whole-cell patch clamp technique in peritumoral neurons from U251GFP, GBM12, and GBM22-implanted animals. (e) Examples of voltage responses to increasing amplitude current injections, from −100 pA to + 80 pA (in 20 pA steps) in whole-cell current clamped pyramidal peritumoral neurons in glioma-bearing and in sham slices (pulse duration, 500 ms). (f) The average action potential number obtained in response to 20, 40, 60 and 80 pA depolarizing current pulses are plotted as a function of applied current in the input-output curves to illustrate that peritumoral neurons exhibit significantly more action potentials *P < 0.05.
Properties of peritumoral layer II/III pyramidal cells
Peritumoral hyperexcitability may result from alterations of intrinsic neuronal properties, such as resting membrane potential (RMP) or input resistance (IR). However, RMP (~ −60 mV) and IR, assessed by whole-cell current-clamp recordings in visually-identified layer II/III pyramidal cells (confirmed by biocytin staining), were similar between all glioma-bearing animals (n = 43) and shams (n = 7) (Fig. 4c, d). Peritumoral neuronal IR from slices containing U251GFP (150 ± 18 MΩ, n = 60, P > 0.05), GBM12 (113 ± 9 MΩ, n = 10, P > 0.05), or GBM22 (164 ±12 MΩ, n = 41, P > 0.05) was equivalent to slices from sham animals (155 ± 18 MΩ, n = 26, P > 0.05) (Fig. 4c). However, in peritumoral neurons, the number of action potentials fired in response to 20, 40, 60 and 80 pA current injections was significantly greater than in sham neurons (20 pA: *P < 0.05; 40 pA: *P < 0.05; 60 pA: *P < 0.05; 80 pA: *P < 0.05) (Fig. 4e, f) indicating a lowered excitability threshold.
Block of system xc−- eliminates epileptiform activity
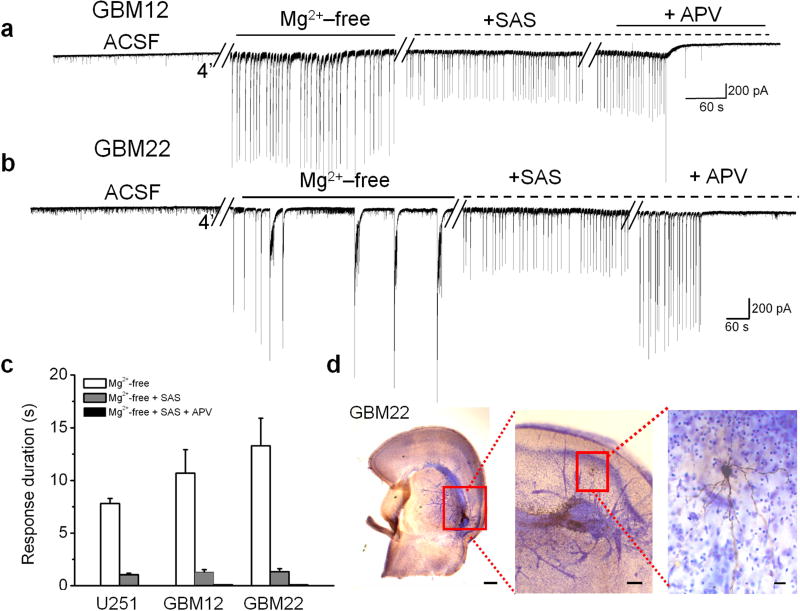
To determine whether glutamate release from system xc− contributes to epileptiform activity in peritumoral brain, we obtained whole-cell patch clamp recordings from peritumoral neurons in acute brain slices from 3 U251GFP (n = 7), 3 GBM12 (n = 6), and 3 GBM22 (n = 5) implanted animals, and 4 sham animals (n = 6). Epileptiform activity was readily induced in Mg2+-free solution as shown for representative examples of GBM12 and GBM22 peritumoral neurons (Fig. 5a, b). Blocking system xc− -mediated glutamate release with 250 μM SAS decreased events longer than 3 s (U251GFP: 9 ± 0.6 s; U251GFP + SAS: 0.8 ± 0.2 s, **P < 0.01; GBM12: 11 ± 2 s; GBM12 + SAS: 1 ± 0.2 s, **P < 0.01; GBM22: 13 ± 2 s; GBM22 + SAS 1.4 ± 0.4 s, **P < 0.01) (Fig. 5a–c), and reduced the amplitude of all remaining events by 44 ± 6%. The remaining activity was completely abolished following application of 50 μM of the NMDA antagonist APV (Fig. 5a–c). All recorded peritumoral neurons were located close to tumor masses (Fig. 5d).
Figure 5.
Sulfasalazine (SAS) application reduces epileptiform activity in acute cortical slices from glioma-bearing mice. Recordings of epileptiform activity exhibited by peritumoral neurons following removal of Mg2+ in animals bearing GBM12 (a), or GBM22 (b) tumors. Subsequent bath application of 250 μM SAS eliminated events lasting longer than 3 s, and event amplitude was reduced by 44%. Bath application of 50 μM APV, an NMDA receptor blocker, completely abolished all activity (c). (d) A cresyl violet-stained slice containing GBM22 shows the proximity of a biocytin-filled recorded neuron (inset) to the darker-stained tumor. Scale bars = 350μm and 150 μm.
These data indicate that peritumoral neurons have a reduced excitability threshold, presumably due to elevated levels of peritumoral glutamate. Consistent with this, bath application of 20 μM glutamate in the presence of Mg2+ induced epileptiform activity in 66% of U251GFP glioma-bearing slices (n = 9) from 4 animals, but not in slices (n = 6) from 3 sham animals (Supplementary Fig. 4). Loss of GABAergic inhibition may also contribute to abnormal excitability; Bicuculline (BIC), a GABAAR antagonist, has been shown to facilitate excitatory synchronization 23. Whole-cell recordings conducted in the presence of 10 μM BIC showed that neurons in slices (n = 6) from 3 sham animals exhibited typical spontaneous sEPSCs, without development of epileptiform activity. However, spontaneous epileptiform events were observed in 50% of peritumoral neurons in slices (n = 11) from 3 U251GFP-implanted animals, suggesting changes in both excitatory and inhibitory properties (Supplementary Fig 5).
Sulfasalazine decreases epileptic activity in mice
The biophysical data demonstrate that peritumoral epileptiform activity is inhibited by blocking system xc−-mediated glutamate release with SAS. If glutamate release via system xc− causes epileptic activity in vivo, SAS treatment could reduce or eliminate this activity in glioma-bearing animals. Fourteen U251GFP-implanted mice exhibiting epileptic activity were injected i.p. twice daily for 3 d with either 1 ml PBS (n = 6) or 1 ml of 8 mg ml−1 SAS (n = 8), an equivalent dose taken by Crohn’s disease patients. EEGs recorded 4 h immediately preceding and 4 h immediately following treatment were analyzed. Frequency of activity in SAS-treated mice was significantly decreased in the 4 h after (4.25 ± 2.41) compared to the 4 h before treatment (7.50 ± 3.41, **P < 0.01) (Fig. 6a), but was unaffected by PBS treatment (before: 7.23 ± 2.09; after: 6.73 ± 2.24, P > 0.05). A detailed hourly analysis of treatment shows the most profound drop in frequency within the first 2 h after treatment (1h: SAS: 0.356 ± 0.091; PBS: 1.733 ± 0.22; ***P < 0.001; 2h: SAS: 1.00 ± 0.135; PBS: 1.77 ± 0.005, ***P < 0.001) (Fig. 6b). These results reflect the previously reported, relatively short biological half-life (~80 min) of SAS in plasma of treated mice 24. Mice did not develop a tolerance to SAS. Repeated dosing showed similar efficacy suppressing epileptic activity as shown for one representative animal (Fig. 6c).
Figure 6.
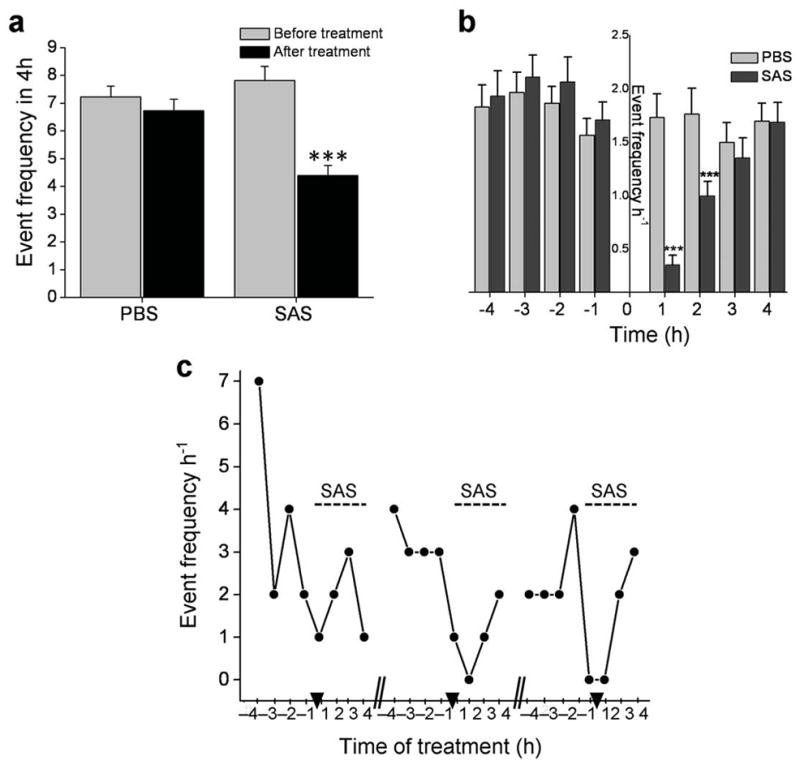
Sulfasalazine reduces frequency of epileptic activity in tumor-bearing mice. (a) The average number of epileptic events for 8 SAS-treated and 6 PBS-treated tumor bearing mice was quantified for the 4 h period before and the 4 h period after treatment. Activity was significantly decreased in the 4 h period following SAS treatment (***P < 0.001), while PBS-injected animals showed no significant change in frequency. (b) The average hourly event frequency is plotted for 8 SAS treated animals compared to 6 PBS-treated mice before and after treatment. Injection time is indicated by “0”. The frequency of hourly activity was similar between SAS and PBS-treated animals in each of the 4 h before treatment; however, after treatment, mice given SAS experienced significantly less activity within the 1st h (***P < 0.001) and the 2nd h (**P< 0.01) compared to mice given PBS. (c) The effects of SAS treatment on epileptic activity indicate that mice do not become desensitized to the drug. The number of events that occurred by hour in the 8 h treatment block (4 h before and 4 h after) is displayed for one animal; hash marks separate 3 consecutive days and arrow heads indicate the time of SAS injection.
Discussion
Recurring seizures, often referred to as tumor-associated epilepsy, are a well-documented yet poorly understood co-morbidity affecting approximately one third of individuals with glioma 3. By modeling the disease in mice implanted with 3 different patient-derived gliomas, we show through EEG and video recording that 37.2% develop spontaneous, recurrent, abnormal EEG activity. Biophysical recordings conducted on acute cortical slices from these animals show that peritumoral neuronal hyperexcitability is attributable to glutamate release by glioma cells via the system xc− cystine/glutamate transporter. Glutamate released from glioma-bearing slices measured in the 5 μM range, sufficient to activate neuronal glutamate receptors 25, although the actual glutamate concentration seen by these peritumoral neurons is likely much higher than what we measured in our assays due to dilution into the medium and astrocytic reuptake. A recent study done in ambulatory glioma patients measured peritumoral glutamate in excess of 100 μM 8.
Peritumoral astrocytes that would normally be effective in removing and catabolizing extracellular glutamate 26 appear overwhelmed by glutamate release from the tumor. Peritumoral neurons exhibited a lowered threshold for action potential generation and a reduced latency to develop epileptiform activity after Mg2+ removal. This activity was GluR- dependent and completely blocked by APV. Application of 20 μM glutamate in the presence of Mg2+ induced hyperexcitability in peritumoral but not sham neurons. Therefore, the reduced activation threshold for peritumoral neurons is largely attributed to an enhanced glutamatergic drive with a contribution of reduced GABAergic inhibition. Further studies will examine changes in peritumoral transmitter receptors in greater detail.
Elevated levels of extracellular glutamate have previously been implicated in development of seizures and epilepsy 27,28,29, although in those studies the glutamate source was neuronal. In glioma-bearing animals, the primary glutamate source is the growing tumor 30 . We show that glutamate release by gliomas is through system xc− because it is Na+-independent, cystine-dependent, and blocked by SAS. Previous studies similarly show system xc−-mediated glutamate release from gliomas in vitro 9, in situ 31, and in vivo 32, leading to tumor growth 13, tumor-associated excitotoxicity 32, and edema 33,32.
We found that SAS treatment reduced epileptic activity in glioma-bearing mice, implicating glutamate release via system xc− in the generation of tumor-associated epileptic events. System xc− may also generate epileptic events in humans. Together with previous studies, our findings establish that system xc− is a viable target for novel seizure treatments. The effects of SAS are encouraging, particularly since SAS is an FDA-approved drug with well-described, tolerable side-effects that support its use as adjuvant treatment for peritumoral epilepsy. A clinical trial conducted on several end-stage glioblastoma patients with poor neurological status used SAS to inhibit NfkB; they reported no significant impact on tumor growth 34. However, this underpowered study enrolled a neurologically unfavorable patient population and did not assess anti-epileptic effects. Seizures often present early in disease progression and particularly affect patients with low-grade, slow-growing tumors that can become refractory to traditional antiepileptic drugs; these patients are the most likely to benefit from SAS treatment 1. Clearly, a well-designed clinical study of SAS treatment for low-grade glioma patients is warranted.
METHODS
Glioma cells
We used the human glioma cell line U251MG [glioblastoma multiforme (GBM), World Health Organization (WHO) grade IV] to generate U251GFP cells. GBM12 and GBM22 tumors, previously established from human biopsies were prepared for implantation as described 17,18. All procedures were approved and performed under guidelines of the Institutional Animal Care and Use Committee of the University of Alabama at Birmingham.
Intracranial xenografts
We intracranially implanted either 5 × 10⁵ U251GFP, 2.5 × 10⁵ GBM12, or 2.5 × 10⁵ GBM22 glioma cells in 10 μl of 5% methylcellulose stereotactically into the left hemisphere of 8–10 week old female C.B.17 scid mice as previously described 35. Control mice were injected with methylcellulose.
EEG acquisition
We placed intracranial recording electrodes (Plastics One, Inc.) on the right hemisphere with a ground on the left. We acquired data (250 Hz sampling rate) using 8 Biopac Systems amplifiers and AcqKnowledge 4.0 EEG Acquisition and Reader Software (BIOPAC Systems Inc.). Digitized files were analyzed offline by a blinded investigator using AcqKnowledge 4 software. Events of 12–15 Hz, and ≥5 x baseline amplitude were flagged for further analysis; duration, amplitude and frequency were computed in AcqKnowledge software. We used corresponding video (L20WD800 Series, Lorex Technology, Inc.) to assess behavior.
Glutamate release assays
Coronal brain slices (300 μm) (n = 3) recovered 1 h in ACSF, then transferred to 200 μl buffer containing 100 μM cystine or 100 μM cystine and 250 μM SAS. We removed 25 μl samples after 30, 60, and 120 m (volume maintained) for analysis at the UAB Mass Spectrometry Core Facility using previously-described tandem HPLC-Mass Spectrometry methods 36 with a liquid chromatography column (Waters Acquity UPLC hydrophilic interaction (ZICTM-HILIC 20 mm x 2.1 mm, 35 μm) and 5 μm pre-microfilter (The Nest Group, Inc.). We quantified glutamate using Applied Biosystems/MDS Sciex API-3200 Triple Quadropole in negative chemical ionization (APCI) mode, and data were acquired and analyzed using Analyst 1.4.2 software (Applied Biosystems). Results are μM of glutamate mg−1 of wet tissue.
Electrophysiology
Anesthetized animals were decapitated and brains immersed in ice-cold ACSF [(in mM): 135 NMDG, 1.5 KCl, 1.5 KH2PO4, 23 choline bicarbonate, 25 D-glucose, 0.5 CaCl2, 3.5 MgSO4]. Coronal slices (300 μm) recovered 1 h in ACSF [(in mM): 125 NaCl, 3 KCl, 1.25 NaH2PO4, 25 NaHCO3, 2 CaCl2, 1.3 MgSO4, 25 glucose] at 37 ° then transferred to a recording chamber. We obtained whole-cell recordings using an intracellular solution of [(in mM): 134 K-gluconate, 1 KCl, 10 HEPES, 2 Mg-ATP, 0.2 Na-GTP, and 0.5 EGTA, pH 7.4, 285–290 mOsm], and an Axopatch 1B amplifier (Molecular Devices). We made tight seals with patch electrodes (KG-33 glass, Garner Glass) with a 3–5 MΩ open-tip resistance at −70 mV. Tumors were identified by florescence or bright field (Supplementary Fig. 5) and layer II/III peritumoral pyramidal cells visualized using a Zeiss Axioscope microscope, a 40 × water immersion lens, and infrared illumination. We conducted whole-cell recordings in the presence of 0.100 mM cystine. External solutions contained 0.250 SAS, 0.05 APV, 0.010 Glu, 0.020 Glu or 0.010 mM BIC. For extracellular recordings, coronal slices (400 μm) recovered 1 h at RT, placed in an interface chamber (Fine Science Tools), and superfused 1–2 ml m−1 with 95% O2 and 5% CO2 ACSF at 34 ± 1oC for 1 h. We conducted field recordings using ACSF-filled glass pipettes. Data were acquired using Clampex 10 software and a Digidata 1440A interface (Molecular Devices), filtered at 5 kHz, digitized at 10–20 kHz, and analyzed using Clampfit 10.0 software (Molecular Devices).
Optical recordings
We conducted optical recordings on an Axiovert 135 TV (Zeiss, Germany) microscope using a NeuroPlex 464-element photodiode array (RedShirtImaging) as described 22. We placed a bipolar electrode in cortical layer II/III adjacent to U251GFP tumor, measured resting light intensity and stimulated slices at 80 μA. Signals are represented as % change in fluorescence (ΔF F−1). We used a noiseminimizing subtraction procedure to collect data over 3 trials, and analyzed peak amplitude, signal decay, and number of 3 × baseline amplitude signals (spread) using IDL custom programs (Research Systems Inc.).
Statistical analyses
We computed P values for biophysical recordings using unpaired two-tailed Student’s t test; P values were computed for glutamate assays and animal treatments with one-way ANOVA and Tukey-Kramer Multiple Comparisons Tests. Error bars represent SEM. Statistics were generated with GraphPad InStat 3.06 (GraphPad Software Inc.), significance set at P < 0.05, and graphed using Origin 7.5 (Microcal Software).
Supplementary Material
Acknowledgments
The authors would like to thank J. Hablitz and A. Albertson for technical assistance with diode array recordings; A. Margolies for help with histology; C. Langford for orthotopic xenografts; V. Cuddapah for editorial advice; M. McFerrin for technical support, and E. Dudek and K. Wilson at the University of Utah for training in EEG acquisition. Glutamate measurements were conducted at the University of Alabama at Birmingham Targeted Metabolomics and Proteomics Facility (funded by: NCCR grant S10 RR19231, U54 CA 100949, P50 AT00477, P30 DK079337, P30 AR50948). Bioluminescence imaging and some field electrode recordings were obtained in the Neuroscience Blueprint Core facility (Neuroscience Blueprint Core Grant NS57098). U251MG cells were obtained from Y. Gillespie (University of Alabama at Birmingham); U251MGffluc cells were from M. Jensen (City of Hope National Medical Center, Duarte, CA); GBM12 and 22 tumors were obtained from J. Sarkaria (Mayo Clinic, Rochester, MN) and provided by the University of Alabama at Birmingham Brain Tumor Animal Models Core (UAB SPORE P50-CA097247).
Grant support: NIH-2R01-NS052634 & 5R01-NS036692, 5T32NS048039-03, & Neuroscience Blueprint Core Grant NS57098.
Footnotes
The authors declare no competing conflicts of interest.
AUTHOR CONTRIBUTIONS
S. Buckingham and S. Campbell acquired the majority of the data presented. B. Haas was instrumental in animal surgeries and statistical analyses of data. V. Montana (supported by ABTA Basic Research Fellowship) performed glutamate release assays. S. Robel assisted in electrophysiological recordings. T. Ogunrinu performed western blots and glutamate uptake assays. H.S. designed experiments, supervised all research and co-wrote the manuscript.
REFERENCE LIST
- 1.Moots PL, et al. The course of seizure disorders in patients with malignant gliomas. Arch Neurol. 1995;52 :717–724. doi: 10.1001/archneur.1995.00540310091021. [DOI] [PubMed] [Google Scholar]
- 2.van Breemen MS, et al. Efficacy of anti-epileptic drugs in patients with gliomas and seizures. J Neurol. 2009;256:1519–1526. doi: 10.1007/s00415-009-5156-9. [DOI] [PubMed] [Google Scholar]
- 3.Hauser WA, Annegers JF, Kurland LT. Incidence of epilepsy and unprovoked seizures in Rochester, Minnesota: 1935–1984. Epilepsia. 1993;34:453–468. doi: 10.1111/j.1528-1157.1993.tb02586.x. [DOI] [PubMed] [Google Scholar]
- 4.During MJ, Spencer DD. Extracellular hippocampal glutamate and spontaneous seizure in the conscious human brain. Lancet. 1993;341:1607–1610. doi: 10.1016/0140-6736(93)90754-5. [DOI] [PubMed] [Google Scholar]
- 5.Patt S, et al. Source localization and possible causes of interictal epileptic activity in tumor-associated epilepsy. Neurobiol Dis. 2000;7:260–269. doi: 10.1006/nbdi.2000.0288. [DOI] [PubMed] [Google Scholar]
- 6.Senner V, et al. A new neurophysiological/neuropathological ex vivo model localizes the origin of glioma-associated epileptogenesis in the invasion area. Acta Neuropathol. 2004;107:1–7. doi: 10.1007/s00401-003-0771-5. [DOI] [PubMed] [Google Scholar]
- 7.Kohling R, Senner V, Paulus W, Speckmann EJ. Epileptiform activity preferentially arises outside tumor invasion zone in glioma xenotransplants. Neurobiol Dis. 2006;22:64–75. doi: 10.1016/j.nbd.2005.10.001. [DOI] [PubMed] [Google Scholar]
- 8.Marcus HJ, Carpenter KL, Price SJ, Hutchinson PJ. In vivo assessment of high-grade glioma biochemistry using microdialysis: a study of energy-related molecules, growth factors and cytokines. J Neurooncol. 2010;97:11–23. doi: 10.1007/s11060-009-9990-5. [DOI] [PubMed] [Google Scholar]
- 9.Ye ZC, Sontheimer H. Glioma cells release excitotoxic concentrations of glutamate. Cancer Res. 1999;59 :4383–4391. [PubMed] [Google Scholar]
- 10.Ye ZC, Rothstein JD, Sontheimer H. Compromised glutamate transport in human glioma cells: reduction- mislocalization of sodium-dependent glutamate transporters and enhanced activity of cystine-glutamate exchange. J Neurosci. 1999;19:10767–10777. doi: 10.1523/JNEUROSCI.19-24-10767.1999. [DOI] [PMC free article] [PubMed] [Google Scholar]
- 11.Lyons SA, Chung WJ, Weaver AK, Ogunrinu T, Sontheimer H. Autocrine glutamate signaling promotes glioma cell invasion. Cancer Res. 2007;67:9463–9471. doi: 10.1158/0008-5472.CAN-07-2034. [DOI] [PMC free article] [PubMed] [Google Scholar]
- 12.Kim JY, et al. Human cystine/glutamate transporter: cDNA cloning and upregulation by oxidative stress in glioma cells. Biochim Biophys Acta. 2001;1512:335–344. doi: 10.1016/s0005-2736(01)00338-8. [DOI] [PubMed] [Google Scholar]
- 13.Chung WJ, et al. Inhibition of cystine uptake disrupts the growth of primary brain tumors. J Neurosci. 2005;25:7101–7110. doi: 10.1523/JNEUROSCI.5258-04.2005. [DOI] [PMC free article] [PubMed] [Google Scholar]
- 14.Sato H, Tamba M, Ishii T, Bannai S. Cloning and expression of a plasma membrane cystine/glutamate exchange transporter composed of two distinct proteins. J Biol Chem. 1999;274:11455–11458. doi: 10.1074/jbc.274.17.11455. [DOI] [PubMed] [Google Scholar]
- 15.de Vries NA, Beijnen JH, van Tellingen O. High-grade glioma mouse models and their applicability for preclinical testing. Cancer Treat Rev. 2009;35:714–723. doi: 10.1016/j.ctrv.2009.08.011. [DOI] [PubMed] [Google Scholar]
- 16.Fomchenko EI, Holland EC. Mouse models of brain tumors and their applications in preclinical trials. Clin Cancer Res. 2006;12:5288–5297. doi: 10.1158/1078-0432.CCR-06-0438. [DOI] [PubMed] [Google Scholar]
- 17.Giannini C, et al. Patient tumor EGFR and PDGFRA gene amplifications retained in an invasive intracranial xenograft model of glioblastoma multiforme. Neuro-oncol. 2005;7:164–176. doi: 10.1215/S1152851704000821. [DOI] [PMC free article] [PubMed] [Google Scholar]
- 18.Sarkaria JN, et al. Identification of molecular characteristics correlated with glioblastoma sensitivity to EGFR kinase inhibition through use of an intracranial xenograft test panel. Mol Cancer Ther. 2007;6:1167–1174. doi: 10.1158/1535-7163.MCT-06-0691. [DOI] [PubMed] [Google Scholar]
- 19.D'Ambrosio R, et al. Functional definition of seizure provides new insight into post-traumatic epileptogenesis. Brain. 2009;132:2805–2821. doi: 10.1093/brain/awp217. [DOI] [PMC free article] [PubMed] [Google Scholar]
- 20.Mody I, Lambert JD, Heinemann U. Low extracellular magnesium induces epileptiform activity and spreading depression in rat hippocampal slices. J Neurophysiol. 1987;57:869–888. doi: 10.1152/jn.1987.57.3.869. [DOI] [PubMed] [Google Scholar]
- 21.Jones RS. Ictal epileptiform events induced by removal of extracellular magnesium in slices of entorhinal cortex are blocked by baclofen. Exp Neurol. 1989;104:155–161. doi: 10.1016/s0014-4886(89)80009-3. [DOI] [PubMed] [Google Scholar]
- 22.DeFazio RA, Hablitz JJ. Horizontal spread of activity in neocortical inhibitory networks. Brain Res Dev Brain Res. 2005;157:83–92. doi: 10.1016/j.devbrainres.2005.03.008. [DOI] [PubMed] [Google Scholar]
- 23.Gutnick MJ, Connors BW, Prince DA. Mechanisms of neocortical epileptogenesis in vitro. J Neurophysiol. 1982;48:1321–1335. doi: 10.1152/jn.1982.48.6.1321. [DOI] [PubMed] [Google Scholar]
- 24.Zheng W, Winter SM, Mayersohn M, Bishop JB, Sipes IG. Toxicokinetics of sulfasalazine (salicylazosulfapyridine) and its metabolites in B6C3F1 mice. Drug Metab Dispos. 1993;21:1091–1097. [PubMed] [Google Scholar]
- 25.Herman MA, Jahr CE. Extracellular glutamate concentration in hippocampal slice. J Neurosci. 2007;27 :9736–9741. doi: 10.1523/JNEUROSCI.3009-07.2007. [DOI] [PMC free article] [PubMed] [Google Scholar]
- 26.Danbolt NC. Glutamate uptake. Prog Neurobiol. 2001;65:1–105. doi: 10.1016/s0301-0082(00)00067-8. [DOI] [PubMed] [Google Scholar]
- 27.Rothstein JD, et al. Knockout of glutamate transporters reveals a major role for astroglial transport in excitotoxicity and clearance of glutamate. Neuron. 1996;16:675–686. doi: 10.1016/s0896-6273(00)80086-0. [DOI] [PubMed] [Google Scholar]
- 28.Meldrum BS. The role of glutamate in epilepsy and other cns disorders. Neurology. 1994;44(Suppl 8):S14–23. [review] [128 refs] [PubMed] [Google Scholar]
- 29.Tanaka K, et al. Epilepsy and exacerbation of brain injury in mice lacking the glutamate transporter glt-1. Science. 1997;276:1699–1702. doi: 10.1126/science.276.5319.1699. [DOI] [PubMed] [Google Scholar]
- 30.Behrens PF, Langemann H, Strohschein R, Draeger J, Hennig J. Extracellular glutamate and other metabolites in and around RG2 rat glioma: an intracerebral microdialysis study. J Neurooncol. 2000;47 :11–22. doi: 10.1023/a:1006426917654. [DOI] [PubMed] [Google Scholar]
- 31.Takano T, et al. Glutamate release promotes growth of malignant gliomas. Nat Med. 2001;7:1010–1015. doi: 10.1038/nm0901-1010. [DOI] [PubMed] [Google Scholar]
- 32.Savaskan NE, et al. Small interfering RNA-mediated xCT silencing in gliomas inhibits neurodegeneration and alleviates brain edema. Nat Med. 2008;14:629–632. doi: 10.1038/nm1772. [DOI] [PubMed] [Google Scholar]
- 33.Engelhorn T, et al. Cellular characterization of the peritumoral edema zone in malignant brain tumors. Cancer Sci. 2009;100:1856–1862. doi: 10.1111/j.1349-7006.2009.01259.x. [DOI] [PMC free article] [PubMed] [Google Scholar]
- 34.Robe PA, et al. Early termination of ISRCTN45828668, a phase 1/2 prospective, randomized study of sulfasalazine for the treatment of progressing malignant gliomas in adults. BMC Cancer. 2009;9:372. doi: 10.1186/1471-2407-9-372. [DOI] [PMC free article] [PubMed] [Google Scholar]
- 35.Soroceanu L, Gillespie Y, Khazaeli MB, Sontheimer H. Use of chlorotoxin for targeting of primary brain tumors. Cancer Res. 1998;58:4871–4879. [PubMed] [Google Scholar]
- 36.Buck K, Voehringer P, Ferger B. Rapid analysis of GABA and glutamate in microdialysis samples using high performance liquid chromatography and tandem mass spectrometry. J Neurosci Methods. 2009;182:78–84. doi: 10.1016/j.jneumeth.2009.05.018. [DOI] [PubMed] [Google Scholar]
Associated Data
This section collects any data citations, data availability statements, or supplementary materials included in this article.


