

Abstract
Calcineurin inhibitors (CNIs) are immunosuppressive drugs, which are used widely to prevent rejection of transplanted organs and treat autoimmune disease. Hypertension and renal tubule dysfunction, including hyperkalemia, hypercalciuria, and acidosis often complicate their use1,2. These side effects resemble familial hyperkalemic hypertension (FHHt), a genetic disease characterized by overactivity of the renal sodium chloride co-transporter (NCC), and caused by mutations in WNK kinases. We hypothesized that CNIs induce hypertension by stimulating NCC. In wild-type mice, the CNI tacrolimus caused salt-sensitive hypertension and increased the abundance of phosphorylated NCC, and the NCC regulatory kinases WNK3, WNK4, and SPAK. The functional importance of NCC in this response was demonstrated by showing that tacrolimus did not affect blood pressure in NCC knockout mice, whereas the hypertensive response to tacrolimus was exaggerated in mice over-expressing NCC. Moreover, hydrochlorothiazide reversed tacrolimus-induced hypertension. In kidney transplant recipients treated with tacrolimus, fractional chloride excretion in response to bendroflumethiazide was greater than in controls, and renal NCC abundance was also greater, extending these observations to humans. Together, these findings indicate that tacrolimus-induced hypertension is mediated largely by NCC activation, and suggest that inexpensive and well-tolerated thiazide diuretics may be especially effective in preventing the complications of CNI treatment.
First we studied whether tacrolimus was capable of inducing an FHHt-like phenotype in wild-type mice, since most previous studies had used rats3–5. In two weeks, tacrolimus increased systolic blood pressure (BP) from 123 ± 3 to 145 ± 3 mmHg (Figure 1a) and caused renal sodium (Figure 1b), and potassium retention (Figure 1c), as found previously3,4,6. Although higher systolic blood pressures were already present during the first week of treatment with tacrolimus, the full development of hypertension did not occur until the second week (Figure 1a) and was therefore preceded by a decline in urinary sodium excretion (Figure 1b). The BP increase also correlated with the degree of renal sodium retention (Figure 1d). Although reduced food intake with tacrolimus might also explain lower urinary sodium excretion, there was no weight loss in the tacrolimus group, and body weights in the two treatment groups were similar. In a separate group of mice, we showed that tacrolimus-induced hypertension was salt-sensitive (Figure 1e). Tacrolimus caused a modest increase in plasma aldosterone concentration (Figure 1f), but it is unlikely that this is the main factor causing hypertension because tacrolimus-treated mice on a high sodium diet developed more severe hypertension, despite reduced aldosterone (Figure 1d). To confirm that the modest rise in plasma aldosterone to 348 ± 20 pg ml−1 during tacrolimus treatment was not responsible for the rise in BP, additional mice were infused with aldosterone for two weeks, without tacrolimus. This treatment increased plasma aldosterone levels to 1506 ± 614 pg ml−1, but did not increase BP significantly (121 ± 6 mmHg to 125 ± 5 mmHg; P = NS). While this indicates that aldosterone alone is unlikely to be responsible for the effect of tacrolimus on BP, aldosterone could still have a permissive role.
Figure 1. Effects of tacrolimus on arterial pressure and electrolyte handing in mice.
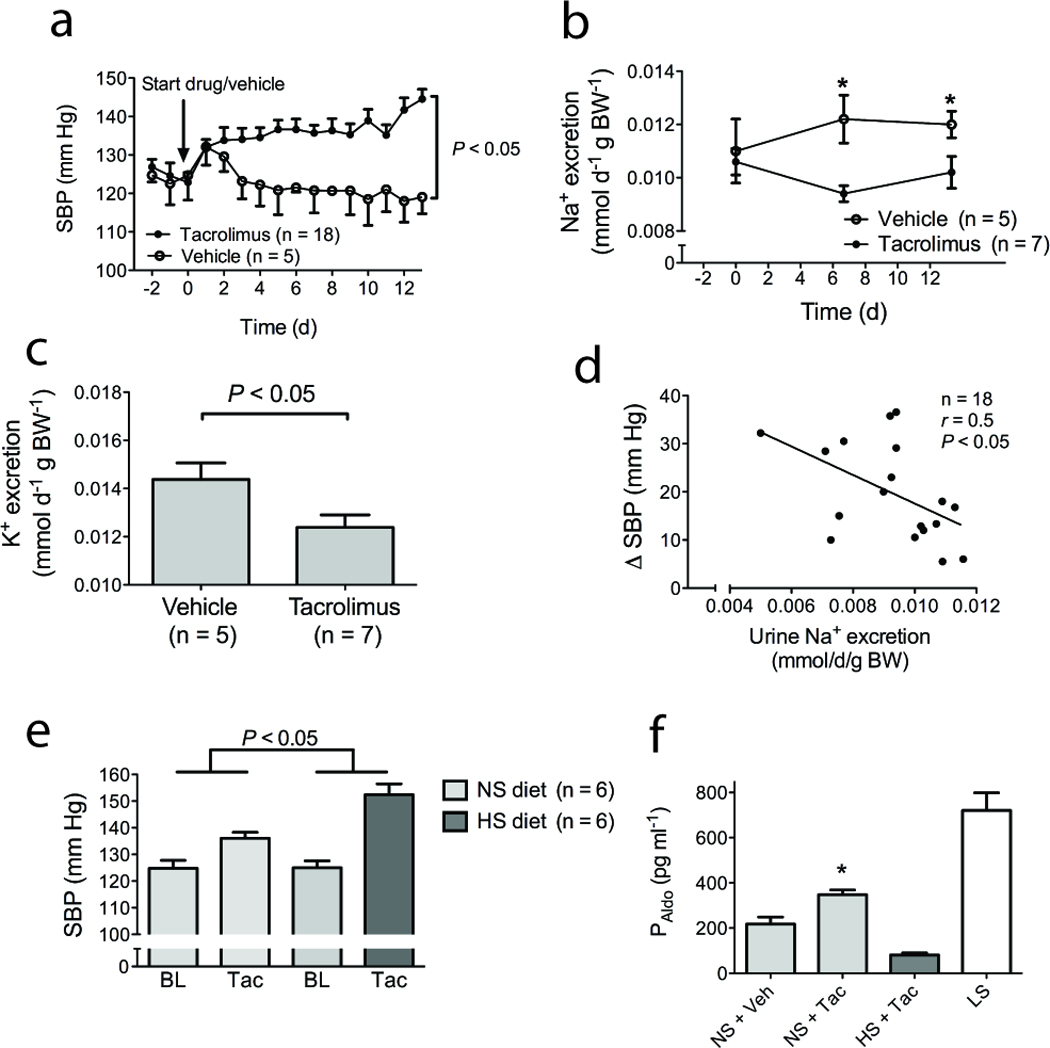
(a) Effects of tacrolimus on systolic blood pressure (SBP) during 14 days. Of note, the first day after starting injections, a transient rise in SBP was observed in both groups. Significant differences were determined by two-way ANOVA. (b) Effects of tacrolimus on twenty four hour urine sodium excretion. * indicates P<0.05 by ANOVA. (c) Effects of tacrolimus on twenty four hour urine potassium excretion. (d) Correlation between urine sodium excretion and BP rise with tacrolimus, calculated as the change from the average baseline value to the final day SBP. Significance was determined using linear regression. (e) Comparison of the rise in SBP caused by tacrolimus (Tac) treatment during high salt (HS) and normal salt (NS) diet. During the baseline (BL) BP measurements, both groups were fed the NS diet. The P-value was obtained using two-way ANOVA to analyze whether the change in blood pressure in one group was significantly different from change in blood pressure in the other group. (f) Effect of tacrolimus (Tac, n=13) on plasma aldosterone levels (PAldo), compared with vehicle (Veh) (n=5), during normal salt (NS) diet. High salt (HS) suppressed plasma aldosterone despite Tac (n=5). As an illustration of an activated renin angiotensin system, plasma aldosterone levels are also shown in untreated wild-type mice fed a low sodium diet (LS, n=5). * indicates P<0.05, compared with NS + Veh.
In addition to hypertension, tacrolimus caused hypomagnesemia, hypercalciuria, and lowered plasma bicarbonate, with a positive urine anion gap, consistent with renal tubular acidosis (RTA) (Supplementary Table 1)4; the hypercalciuria was noted to be strain-dependent (Supplementary Figure 1). Although tacrolimus did not cause frank hyperkalemia during normal potassium intake, when mice consumed high potassium chow, blood potassium concentration was higher in tacrolimus-treated mice (5.4 ± 0.2 mmol l−1) than in vehicle-treated mice (4.5 ± 0.3 mmol l−1, P = 0.02, Supplementary Figure 2). These results confirm that tacrolimus causes salt-sensitive hypertension, hypercalciuria, RTA, and potassium retention in mice, recapitulating the FHHt-phenotype.
Tacrolimus interacts with several binding proteins to exert effects7. One of these, FKBP12 (also known as FKBP1a), is essential for its immunosuppressive effects and is widely expressed, including throughout the nephron, where it is prominent along the distal tubule8. CNIs inhibit calcineurin (also called protein phosphatase 3, formerly protein phosphatase 2b), a phosphatase believed to play a central role in immunosuppression. Calcineurin comprises a catalytic (A) and a regulatory (B) subunit with three closely related isoforms (α, β and γ). Calcineurin A-α is considered to be the dominant isoform in the renal cortex, where NCC is expressed, and it is thought to be responsible for CNI nephrotoxicity9. First we confirmed that calcineurin A-α is expressed by cells of the distal convoluted tubule (DCT; Figure 2a). Next, we showed (Figure 2b) that tacrolimus treatment increased the abundance of activated phosphorylated NCC (pNCC), detected using an antibody against phosphothreonine 5310. At this time point, total NCC was not increased. Tacrolimus also decreased the abundance of the transient receptor calcium channel TRPV5 (Figure 2b), an effect consistent with the tacrolimus-induced reduction in TRPV5 mRNA reported in rats3. In rats, cyclosporine A has also been shown to increase NKCC211, but we did not find such an effect with tacrolimus in mice (Figure 2b). Tacrolimus did increase the abundance of WNK3 and WNK4 (Figure 2c); it also increased the abundance of the STE20-related kinase SPAK (Figure 2c), and caused a size shift indicating its activation12.
Figure 2. Effects of tracolimus on transport proteins and kinases in kidney and in vitro.
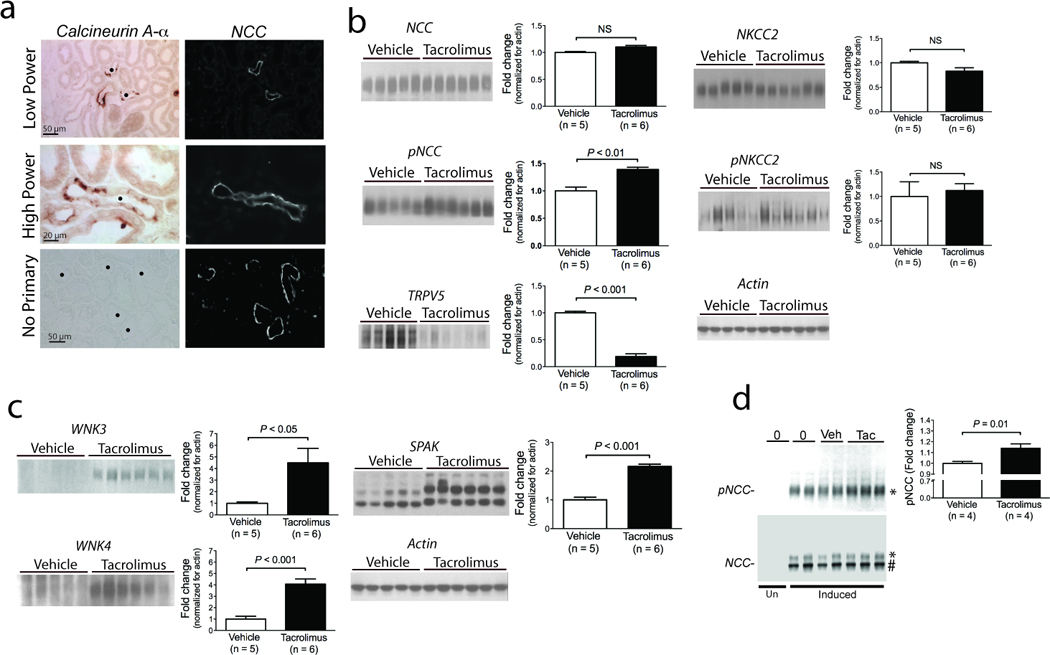
(a) Localization of calcineurin A-α in kidney; left panels show immunohistochemical detection of calcineurin, whereas right panels show NCC in the same field delineating distal convoluted tubules. A control without primary antibody is shown, for comparison. • indicates distal convoluted tubule. (b) Immunoblot images showing effects of tacrolimus on the sodium chloride cotransporters (NCC and pNCC, at approximately 130 kDa, and NKCC2 and pNKCC2 at approximately 140 kDa) and on the calcium channel TRPV5 (at approximately 90 kDa). Graphs of densitometry analysis for each are shown at the right, normalized for actin. (c) Immunoblot images showing effects of tacrolimus on WNK3 (at approximately 200 kDa), WNK4 (at approximately 150 kDa) and SPAK. Densitometry is shown at the right, normalized for actin; densitometry of SPAK was performed by averaging all isoforms. (d) Immunoblot images showing effects of tacrolimus on HEK293 cells. NCC expression was undetectable, when cells were not induced with tetracycline (Un). Induced cells were either untreated (0), treated with vehicle (Veh) or with tacrolimus (Tac). The total NCC ran at approximately 130 kDa (*) and 110 kDa (#), indicating mature and immature forms, respectively, whereas phosphorylated NCC ran only at 130 kDa. Representative immunoblots are shown. Densitometry was normalized for actin (not shown).
Both WNK3 and SPAK have been shown to increase NCC activity through effects on NCC trafficking and phosphorylation, and these kinases may have been involved in activating NCC. The increase in WNK4 seems at odds with its proposed role as a negative regulator of NCC13; but WNK4 has been shown to switch to a stimulatory form under some conditions14, and it may also have been stimulated as a compensatory response. Another group recently reported that cycloporine treatment increases WNK4 and NCC in rats15, effects consistent with the current observation.
These results point to an effect of tacrolimus on the DCT, the only nephron segment expressing NCC. One mechanism by which CNIs might stimulate NCC activity is through phosphatase inhibition, leaving WNK3 and NCC activated. To test for a direct effect on NCC, we determined the abundance of NCC and pNCC in stably transfected HEK293 cells; tacrolimus treatment increased pNCC abundance in these cells (Figure 2d). Although this is consistent with a direct effect of phosphatase inhibition on NCC activity, it is also consistent with NCC activation by phosphorylated SPAK, as HEK293 cells express this kinase endogenously (data not shown).
These results indicate that tacrolimus stimulates NCC activity in vivo and in vitro, but they do not indicate whether this effect is responsible for the BP effect. To determine whether the tacrolimus-induced changes in NCC are responsible for its hypertensive effect, we analyzed the effect of tacrolimus on BP in NCC knockout (KO) mice, and in mice over-expressing NCC. As reported previously, NCC KO mice exhibited normal BP under control conditions, but when treated with tacrolimus, BP did not increase (Figure 3a). This is in marked contrast to the effects in wild-type mice discussed above (Figure 1a). Consistent with the failure of tacrolimus to cause hypertension in NCC KO mice, tacrolimus also did not affect renal sodium, potassium and calcium excretion, or plasma bicarbonate and magnesium levels (Supplementary Table 2). The peak plasma tacrolimus level was similar in NCC KO and wild-type mice (49.8 versus 46.1 ng ml−1, determined from a pooled sample of all animals in each group), indicating that the observed differences were not the result of altered tacrolimus pharmacokinetics. These results in mice support the suggestion of Hu and colleagues16 that NCC plays an important role in tacrolimus-induced hypertension: that group reported normalization of BP, despite treatment with tacrolimus, when a previously hypertensive subject received a kidney from a donor with undetected Gitelman syndrome.
Figure 3. Effects of tacrolimus on blood pressure (BP) and sodium handling in mice in which NCC was deleted, inhibited or over-expressed.
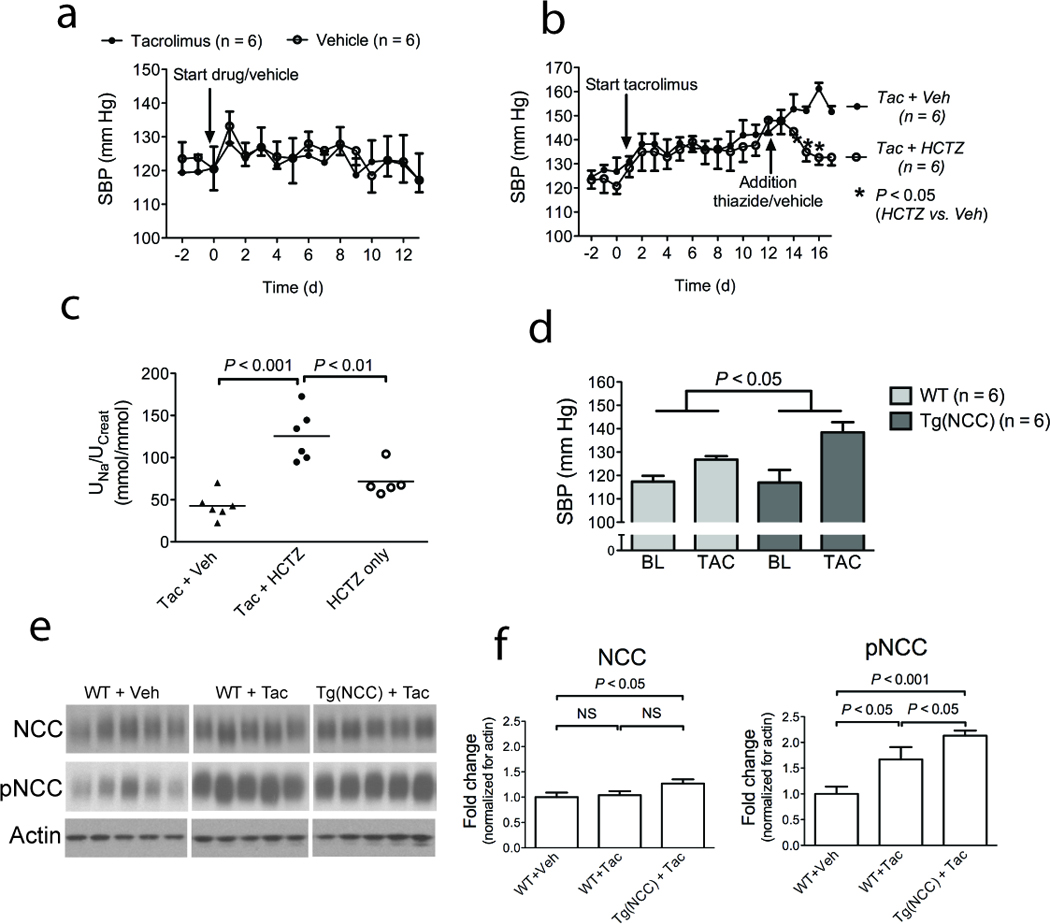
(a) Effects of tacrolimus on SBP of NCC knockout mice and littermates. Of note, the first day after starting the injections of tacrolimus or vehicle, a transient rise in BP was observed in both groups. (b) Effect of treatment with hydrochlorothiazide (HCTZ) or vehicle (Veh) on established tacrolimus-induced hypertension in wild type mice. Statistical analysis was performed by independent t-tests.; (c) Effects of HCTZ on urine sodium to creatinine ratio (UNa/UCreat) in tacrolimus-treated animals (HCTZ + Tac) and in untreated mice (HCTZ only). For comparison, UNa/UCreat in tacrolimus-treated animals given vehicle is also shown. (d) Comparison of effects of tacrolimus treatment (Tac) on blood pressure in wild type and transgenic mice overexpressing NCC. Baseline and final day BPs are shown. The P-value was obtained using two-way ANOVA to analyze whether the change in BP from baseline to the final day in one group was significantly different from the other group. Of note, the Tg (NCC) mice and their wild-type controls had a lower baseline BP than the mice in the previous experiments, which was attributed to a strain-difference (see Methods), as reported previously40. (e) Effect of tacrolimus on total and phosphorylated NCC in NCC transgenic mice and wild type littermates. (f) Quantification of effects of tacrolimus on phosphorylated NCC in wild type and NCC transgenic mice, normalized for actin.
Because NCC KO mice lack the transporter throughout life, developmental effects may have contributed to the findings in these animals. To exclude this possibility, we showed that hypertension induced in wild-type mice by tacrolimus was reversed by hydrochlorothiazide, a pharmacological inhibitor of NCC (Figure 3b). A thiazide-induced natriuresis or chloriuresis is often used as a marker of NCC activity in animals and humans17,18. Hydrochlorothiazide caused a greater natriuresis in tacrolimus-treated mice than in untreated mice (Figure 3c), supporting the conclusion that increased NCC activity mediates the tacrolimus effects. Surprisingly, treatment with hydrochlorothiazide for four days did not worsen tacrolimus-induced hypomagnesemia in wild type mice (plasma magnesium 0.72 ± 0.03 versus 0.78 ± 0.08 mmol l−1; P = 0.5).
Inasmuch as NCC KO mice were resistant to hypertension when treated with tacrolimus, we next tested the effects of tacrolimus on mice over-expressing NCC. These animals were generated recently by our group and have no overt phenotype at baseline, despite a 70% increase in total NCC, which probably reflects the fact that the abundance of pNCC is similar to that in wild-type mice (See Methods). When treated with tacrolimus, mice over-expressing NCC developed more severe hypertension than their wild-type counterparts (Figure 3d). The more severe hypertension in the transgenic NCC mice receiving tacrolimus was associated with increased pNCC; the expression levels in wild-type mice receiving tacrolimus were intermediate between knockout and over-expressing animals (Figure 3e–f). These results suggest that, when there is more NCC to phosphorylate, tacrolimus increases NCC activity even further, leading to more severe hypertension.
To analyze whether the findings in experimental animals extend to humans, we identified CNI-treated recipients of kidney transplants with an FHHt–like phenotype, defined as individuals on a CNI with resistant hypertension (requiring two or more antihypertensive agents), hyperkalemia (plasma potassium recurrently > 5.5 mmol l−1) or acidosis (serum bicarbonate recurrently < 20 mmol l−1, or requiring oral bicarbonate supplements); all had serum creatinines below 150 µmol l−1 (Supplementary Table 3). The change in fractional chloride excretion (FECl) after a single dose of bendroflumethiazide was taken as a measure of NCC activity. As shown (Figure 4a), individuals with CNI-induced hypertension had a significantly greater change in FECl after than healthy volunteer controls (Supplementary Table 3). Individuals with kidney transplants who were treated with sirolimus, but not CNIs, also had a smaller response, similar to controls. Bioimpedance measurements showed that extracellular fluid volume was expanded in the CNI group compared with controls (Figure 4b–c), although there was no significant difference in plasma renin activity or plasma aldosterone level (Figure 4d–e). Transplant biopsies from individuals in the CNI group, as well as from other individuals treated with CNIs with an FHHt phenotype (Supplementary Table 4), were examined immunohistochemically for NCC (n = 4) and pNCC (n = 4), and compared with biopsies from transplanted individuals on azathioprine (Supplementary Table 5) and from healthy native donor kidney biopsies (Supplementary Table 6). The subjects treated with CNIs had a pronounced increase in NCC and pNCC staining compared with the azathioprine and control groups (Figure 4d shows representative examples; the other biopsies are shown in Supplementary Figure 3). Ten of 14 biopsies from the CNI group versus none of 13 from the azathioprine group showed enhanced staining (P<0.001, by Fisher’s exact test).
Figure 4. Functional data and immunostaining in patients with CNI-induced hypertension compared with controls.
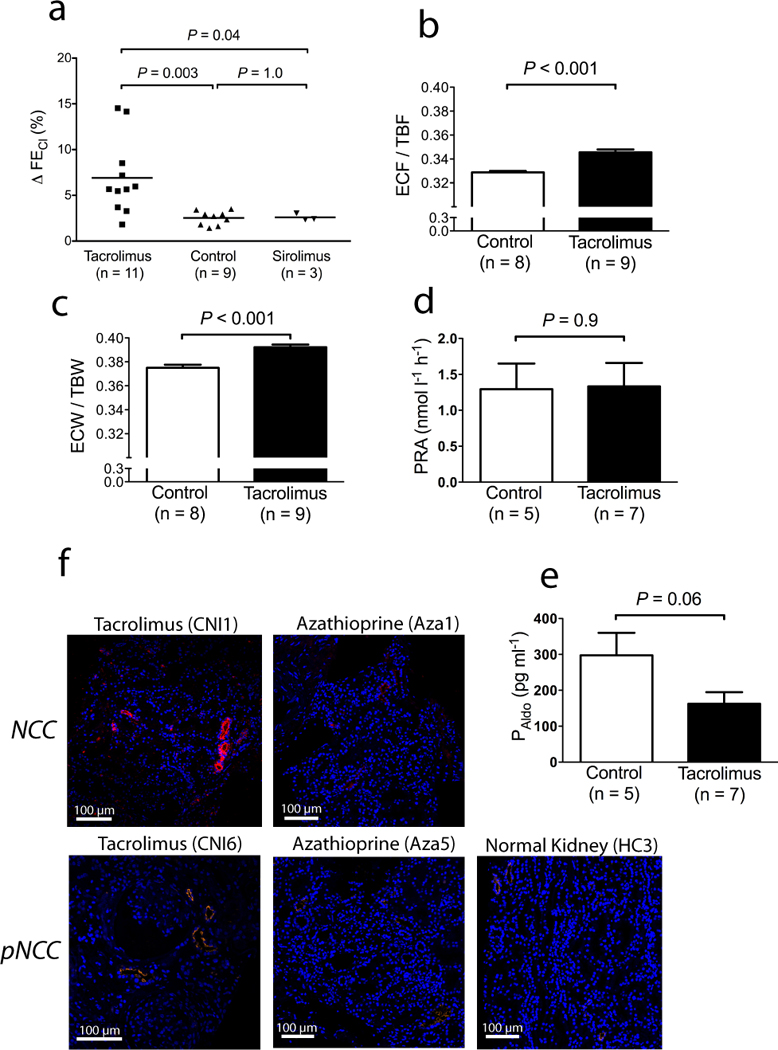
(a) Comparison of effects of 10 mg bendroflumethiazide on fractional chloride excretion (ΔFECl) in kidney transplant patients with tacrolimus-induced hypertension (Tacrolimus), healthy volunteers (Control), and kidney transplant patients receiving sirolimus (Sirolimus). (b) Comparison of extracellular fluid volume versus total body fluid volume (ECF/TBF) in kidney transplant patients with tacrolimus-induced hypertension compared with controls, measured by bioimpedance. (c) Comparison of the ratio of extracellular to total body water (ECW/TBW) in kidney transplant patients with tacrolimus-induced hypertension compared with controls, measured by bioimpedance. (d) Comparison of plasma renin activity (PRA) in kidney transplant patients with tacrolimus-induced hypertension compared with controls. (e) comparison of plasma aldosterone concentration (PAldo) in kidney transplant patients with tacrolimus-induced hypertension compared with controls. (f) Representative confocal immunofluorescence images of renal tissue showing the sodium chloride cotransporter (NCC) and the activated sodium chloride cotransporter (pNCC) in kidney transplant patients with tacrolimus-induced hypertension compared with azathioprine-treated kidney transplant patients, and with healthy controls. Images from additional biopsies and clinical characteristics are provided in Supplementary Tables 4–6 and Supplementary Figure 3.
CNI-induced hypertension has been attributed to a combination of vasoconstriction and renal sodium retention19,20. When administered in high doses, especially intravenously, vascular effects predominate5. CNIs have been shown to constrict arterioles, an effect that may be direct and via sympathetic activation. For this reason CNI-induced hypertension is often treated with calcium channel blockers19. Calcium channel blockers are mainly vasodilatory drugs, although a natriuretic effect has been demonstrated for some classes21. Our results show that activation of NCC in the DCT is necessary for CNIs to cause sustained hypertension. This does not, however, exclude an important role for vasoconstriction either as a direct effect or as a result of sodium retention. Changes in vasoreactivity occur in association with altered sodium balance; for example, individuals with FHHt exhibit an enhanced response to a ‘cold pressor’ test22, whereas subjects with Gitelman syndrome have increased vasodilation23–25. In Gitelman syndrome, the deleted gene, SLC12A3, is expressed in renal but not vascular tissue, indicating that the vasodilation must be the result kidney dysfunction23. According to Guyton’s model of whole body autoregulation, sodium retention will result in a pressure natriuresis and secondary vasoconstriction26. Indeed, a role for increased endothelin and reduced nitric oxide has been proposed in CNI-induced hypertension in rats, but only at very high doses (5 mg kg−1)5; moreover, an endothelin inhibitor does not completely prevent a rise in BP with tacrolimus5.
The prevalence of the FHHt phenotype, with hyperkalemia and acidosis, has been reported to be as high as 16–30%, in some series of patients treated with CNIs27,28. Hypertension may be less common with tacrolimus, compared with cyclosporine, but hyperkalemia seems to be more common29. A large prospective trial detected hyperkalemia and hypertension in approximately 33% of individuals with liver transplants maintained on tracrolimus2, suggesting that these complications are relatively common. Our data suggest that CNI-induced hypertension and hyperkalemia should be particularly sensitive to thiazide diuretics. While there are concerns about combining CNIs with thiazides, because of their tendency to cause magnesium wasting and glucose intolerance30, our own data and a previous clinical study31 indicate that thiazides do not worsen CNI-induced hypomagnesemia.
The contribution of CNIs to decreasing rejection rates after transplantation is undisputed, but this benefit comes at the cost of increasing rates of hypertension, which, ironically, increases the risk of long-term kidney damage and chronic allograft nephropathy32. Our findings indicate that activation of NCC plays a central role in tacrolimus-induced hypertension and suggest that a controlled trial of thiazide diuretics to treat CNI-induced hypertension is justified.
Methods
Animal studies
All animal studies were approved by OHSU’s Animal Care and Usage Committee (A858). All mice were male littermates (12–16 weeks, 25–30 grams) and were fed a normal (0.5%), high sodium (8%) or high potassium (5%) diet (Harlan Laboratories), as indicated. All mice had a BALB/c background, except for the transgenic mice and their wild-type controls (C57BL/6;129SV). Our NCC KO colony was backcrossed to BALB/c every 10 generations to maintain background. The NCC transgenic animals were recently generated by our group (McCormick, J.A., Nelson, J.H., Ellison, D.H., Increased abundance of the sodium chloride cotransporter is not sufficient to mimic familial hyperkalemic hypertension. Submitted.). Standard PCR, using previously reported primers33, was used to distinguish NCC KO and transgenic mice from wild-types. Blood pressures (BP) were measured with tail-cuffs using volumetric pressure recording (CODA-6, Kent Scentific Corporation). This method has been validated for systolic BP measurements in mice, demonstrating excellent correlation with radiotelemetry34,35. The mice were trained for five consecutive days, baseline BP was then measured for three days, followed by daily measurements before the tacrolimus or vehicle injections. Tacrolimus (Enzo Life Sciences) was dissolved in ethanol, Tween-20, and sterile saline; the vehicle solution contained the same concentrations of the solvents.
Blood and urinary measurements in mice
Whole blood was collected via terminal cardiac puncture (under anesthesia) and immediately pipetted into an i-STAT analyzer (Abbott Point of Care). The remainder of the blood was centrifuged to measure plasma magnesium (Pointe Scientific Inc), aldosterone (ELISA, IBL-America), and tacrolimus (~four hours after the last injection; Architect Tacrolimus Reagent Kit, Abott Laboratories). Metabolic cages were used for collection of spot urine and 24-h urine (under mineral oil); water and food were provided as gel to avoid dilution of urine with drinking water. A 3-h timed urine collection was used for the thiazide response; prior to this procedure, the animals’ bladders were emptied by bladder massage. Urine sodium and potassium concentrations were measured using a dual-channel flame photometer (Cole-Palmer Instrument Company). Urine chloride, calcium, and creatinine were measured using the mercuric thiocyanatem, cresolphthalein complexone and modified Jaffé methods, respectively (all Pointe Scientific Inc).
Generation and culture of human embryonic kidney 293 cells transfected with NCC
cDNA encoding full-length mouse NCC was subcloned into the pcDNA5/FRT/TO vector (Invitrogen). Flp-In 293 host cells (Invitrogen) were co-transfected with the pcDNA5/FRT/TO-NCC construct and pOG44, a plasmid expressing Flp recombinase, resulting in a homologous recombination event. Transfected cells were screened for hygromycin resistance and lack of β–galactosidase activity. The Flp-In T-REx 293 NCC cell line was maintained in high-glucose DMEM containing 10% v/v FBS, 200 µg ml−1 hygromycin, 15 µg ml−1 blasticidin, and penicillin/streptomycin. NCC induction was confirmed by incubating the cells with or without tetracycline (1 µg ml−1), followed by cell lysis and immunoblotting with antibodies against NCC and phosphorylated NCC.
Patient studies
All patient studies were approved by the West London Ethics Committee 3. Kidney transplant patients on tacrolimus (all outpatients) were selected with at least two out of three features, consisting of resistant hypertension, otherwise unexplained metabolic acidosis or hyperkalemia. They were compared with kidney transplant patients using sirolimus and with untreated healthy volunteers. The thiazide sensitivity test was based on the one described by Colussi et al.17. Urine and plasma electrolytes were measured by ion-selective electrodes, and creatinine by the compensated kinetic Jaffé method (Roche). Plasma renin activity and plasma aldosterone concentration were measured by radio-immunoassay (Diasorin and Siemens). Multifrequency bioelectrical impedance analysis was performed using a tetrapolar 8-point tactile electrode system (Inbody720, Biospace, Seoul, Korea).
Immunoblotting
Mouse kidneys were harvested and snap frozen in liquid nitrogen. Kidneys were then homogenized on ice in chilled homogenization buffer containing protease and phosphatase inhibitorsr. Twenty-80 µg of protein was separated on 3–8% Tris Acetate Gel (Invitrogen), as described previously36. All primary antibodies had been characterized and were against the following proteins: NCC, phosphorylated NCC at threonine-53, WNK3 (Supplementary Figure 4), WNK4 (all developed in our laboratory)36, NKCC2 and pNKCC237, SPAK38, and TRPV5 (Santa Cruz Biotechnology)39. Densitometry was performed using ImageJ (http://rsbweb.nih.gov/ij/).
Immunofluorescence and immunohistochemistry
For calcineurin and NCC immunohistochemistry immunofluorescence on mouse kidney sections (Figure 2a), an untreated wild-type BALB/c mouse was perfusion fixed with 4% v/v paraformaldehyde via the abdominal aorta and cryoprotected in 800 mOSM sucrose/PBS. After freezing in liquid nitrogen, 7µm sections were prepared on a cryostat. Sections were blocked with 5% w/v skim milk-phosphate-buffered saline and incubated with primary antibody at 4°C overnight, followed by incubation with Cy-3-, or horseradish peroxidase (HRP)-coupled secondary antibody. Secondary antibodies conjugated with HRP were detected using diaminobenzidine. Antibodies against calcineurin A-α were obtained from Santa Cruz Biotechnology.
Staining of human kidney sections for NCC and pNCC was done on paraffin-embedded sections stained using standard procedures; blocked with 1% w/v bovine serum albumin in PSA and using sheep antibodies against NCC (1:3000, Binding Site), and phosphorylated NCC (see above). Confocal microscopy was performed using an Olympus IX81.
Statistical analysis
All values are expressed as mean ± standard error of the mean. For the animal and human studies, comparisons between two groups were performed using the Student’s t-test (paired or unpaired, as appropriate). Multi-group comparisons were performed using 1-way analysis of variance (ANOVA) followed by a post-hoc test. In animals, BP data were analyzed using 2-way ANOVA to assess whether the changes from average baseline BP to final day BP in the two groups were different.
Supplementary Material
Acknowledgments
For technical assistance we thank N. Desmerais (animal studies), S. Rogers, K. Risowsky (immunohistochemistry), D. Gannon and A. Bakke (tacrolimus measurements in mice). We thank G. Jones and M. Harber for help in identifying human subjects. We also thank G. Shull (University of Cincinatti) for the NCC KO mice, and E. Delpire (Vanderbilt Kennedy Center) for SPAK antibodies. EJH is supported by an Erasmus Medical Center Fellowship and Kolff Junior Postdoc Grant (Dutch Kidney Foundation, KJPB 08.004); JAM is supported by the NIH (K01 DK076617); DHE is supported by the NIH (RO1 DK51496), the Department of Veterans Affairs (Merit Review), and the American Heart Association (Grant-in-Aid).
Footnotes
Portions of this work were presented at the High Blood Pressure Research Council Meeting of the American Heart Association, October 13–16, 2010 and the American Society of Nephrology November 15–18, 2010.
Author contributions
EJH and SBW performed most of the experiments, analyzed the data and wrote the initial manuscript. JAM generated the mice over-expressing NCC and participated in animal experiments and analyses. JC performed the aldosterone infusion experiments. AF contributed to the human experiments and, together with AJH, to the kidney biopsy stainings. CLY conducted the cell studies. TR, AP and SB performed the calcineurin immunohistochemistry. RJU and DHE conceived of the study, supervised the work, and edited the manuscript. All authors reviewed the manuscript.
Reference list
- 1.Kim HC, et al. Primary immunosuppression with tacrolimus in kidney transplantation: three-year follow-up in a single center. Transplant. Proc. 2004;36:2082–2083. doi: 10.1016/j.transproceed.2004.08.006. [DOI] [PubMed] [Google Scholar]
- 2.Jain A, et al. What have we learned about primary liver transplantation under tacrolimus immunosuppression? Long-term follow-up of the first 1000 patients. Ann. Surg. 1999;230:441–448. doi: 10.1097/00000658-199909000-00016. discussion 448–449. [DOI] [PMC free article] [PubMed] [Google Scholar]
- 3.Nijenhuis T, Hoenderop JG, Bindels RJ. Downregulation of Ca(2+) and Mg(2+) transport proteins in the kidney explains tacrolimus (FK506)-induced hypercalciuria and hypomagnesemia. J Am Soc Nephrol. 2004;15:549–557. doi: 10.1097/01.asn.0000113318.56023.b6. [DOI] [PubMed] [Google Scholar]
- 4.Mohebbi N, Mihailova M, Wagner CA. The calcineurin inhibitor FK506 (tacrolimus) is associated with transient metabolic acidosis and altered expression of renal acid-base transport proteins. American journal of physiology. Renal physiology. 2009;297:F499–F509. doi: 10.1152/ajprenal.90489.2008. [DOI] [PubMed] [Google Scholar]
- 5.Takeda Y, Miyamori I, Furukawa K, Inaba S, Mabuchi H. Mechanisms of FK 506-induced hypertension in the rat. Hypertension. 1999;33:130–136. doi: 10.1161/01.hyp.33.1.130. [DOI] [PubMed] [Google Scholar]
- 6.Curtis JJ, Luke RG, Jones P, Diethelm AG. Hypertension in cyclosporine-treated renal transplant recipients is sodium dependent. The American journal of medicine. 1988;85:134–138. doi: 10.1016/s0002-9343(88)80331-0. [DOI] [PubMed] [Google Scholar]
- 7.Kang CB, Hong Y, Dhe-Paganon S, Yoon HS. FKBP family proteins: immunophilins with versatile biological functions. Neurosignals. 2008;16:318–325. doi: 10.1159/000123041. [DOI] [PubMed] [Google Scholar]
- 8.Smith KD, et al. Delayed graft function and cast nephropathy associated with tacrolimus plus rapamycin use. Journal of the American Society of Nephrology : JASN. 2003;14:1037–1045. doi: 10.1097/01.asn.0000057542.86377.5a. [DOI] [PubMed] [Google Scholar]
- 9.Gooch JL, Roberts BR, Cobbs SL, Tumlin JA. Loss of the alpha-isoform of calcineurin is sufficient to induce nephrotoxicity and altered expression of transforming growth factor-beta. Transplantation. 2007;83:439–447. doi: 10.1097/01.tp.0000251423.78124.51. [DOI] [PubMed] [Google Scholar]
- 10.Rafiqi FH, et al. Role of the WNK-activated SPAK kinase in regulating blood pressure. EMBO Mol Med. 2010;2:63–75. doi: 10.1002/emmm.200900058. [DOI] [PMC free article] [PubMed] [Google Scholar]
- 11.Esteva-Font C, et al. Ciclosporin-induced hypertension is associated with increased sodium transporter of the loop of Henle (NKCC2) Nephrology, dialysis, transplantation : official publication of the European Dialysis and Transplant Association - European Renal Association. 2007;22:2810–2816. doi: 10.1093/ndt/gfm390. [DOI] [PubMed] [Google Scholar]
- 12.Anselmo AN, et al. WNK1 and OSR1 regulate the Na+, K+, 2Cl− cotransporter in HeLa cells. Proceedings of the National Academy of Sciences of the United States of America. 2006;103:10883–10888. doi: 10.1073/pnas.0604607103. [DOI] [PMC free article] [PubMed] [Google Scholar]
- 13.Yang CL, Angell J, Mitchell R, Ellison DH. WNK kinases regulate thiazide-sensitive Na-Cl cotransport. J. Clin. Invest. 2003;111:1039–1045. doi: 10.1172/JCI17443. [DOI] [PMC free article] [PubMed] [Google Scholar]
- 14.San-Cristobal P, et al. Angiotensin II signaling increases activity of the renal Na-Cl cotransporter through a WNK4-SPAK-dependent pathway. Proceedings of the National Academy of Sciences of the United States of America. 2009;106:4384–4389. doi: 10.1073/pnas.0813238106. [DOI] [PMC free article] [PubMed] [Google Scholar]
- 15.Melnikov S, Mayan H, Uchida S, Holtzman EJ, Farfel Z. Cyclosporine metabolic side effects: association with the WNK4 system. Eur. J. Clin. Invest. 2011 doi: 10.1111/j.1365-2362.2011.02517.x. [DOI] [PubMed] [Google Scholar]
- 16.Hu DC, Burtner C, Hong A, Lobo PI, Okusa MD. Correction of renal hypertension after kidney transplantation from a donor with Gitelman syndrome. Am. J. Med. Sci. 2006;331:105–109. doi: 10.1097/00000441-200602000-00021. [DOI] [PubMed] [Google Scholar]
- 17.Colussi G, et al. A thiazide test for the diagnosis of renal tubular hypokalemic disorders. Clin J Am Soc Nephrol. 2007;2:454–460. doi: 10.2215/CJN.02950906. [DOI] [PubMed] [Google Scholar]
- 18.Madala Halagappa VK, Tiwari S, Riazi S, Hu X, Ecelbarger CM. Chronic candesartan alters expression and activity of NKCC2, NCC, and ENaC in the obese Zucker rat. American journal of physiology. 2008;294:F1222–F1231. doi: 10.1152/ajprenal.00604.2007. [DOI] [PubMed] [Google Scholar]
- 19.Koomans HA, Ligtenberg G. Mechanisms and consequences of arterial hypertension after renal transplantation. Transplantation. 2001;72:S9–S12. doi: 10.1097/00007890-200109271-00004. [DOI] [PubMed] [Google Scholar]
- 20.Curtis JJ. Hypertensinogenic mechanism of the calcineurin inhibitors. Current hypertension reports. 2002;4:377–380. doi: 10.1007/s11906-002-0067-5. [DOI] [PubMed] [Google Scholar]
- 21.Segal AS, Hayslett JP, Desir GV. On the natriuretic effect of verapamil: inhibition of ENaC and transepithelial sodium transport. American journal of physiology. Renal physiology. 2002;283:F765–F770. doi: 10.1152/ajprenal.00253.2001. [DOI] [PubMed] [Google Scholar]
- 22.Paver WK, Pauline GJ. Hypertension and hyperpotassemia without renal disease in a young male. Med. J. Aust. 1964;2:305–306. doi: 10.5694/j.1326-5377.1964.tb115766.x. [DOI] [PubMed] [Google Scholar]
- 23.Calo L, Davis PA, Semplicini A. Control of vascular tone in the syndromes of Bartter and Gitelman. Crit. Rev. Clin. Lab. Sci. 2000;37:503–522. doi: 10.1080/10408360091174295. [DOI] [PubMed] [Google Scholar]
- 24.Calo L, et al. Abnormalities of Gq-mediated cell signaling in Bartter and Gitelman syndromes. Kidney international. 2001;60:882–889. doi: 10.1046/j.1523-1755.2001.060003882.x. [DOI] [PubMed] [Google Scholar]
- 25.Calo L, Davis PA, Semplicini A. Reduced content of alpha subunit of Gq protein content in monocytes of Bartter and Gitelman syndromes: relationship with vascular hyporeactivity. Kidney international. 2002;61:353–354. doi: 10.1046/j.1523-1755.2002.00128.x. [DOI] [PubMed] [Google Scholar]
- 26.Guyton AC. Blood pressure control-Special role of the kidneys and body fluids. Science. 1991;252:1813–1816. doi: 10.1126/science.2063193. [DOI] [PubMed] [Google Scholar]
- 27.Adu D, Michael J, Turney J, McMaster P. Hyperkalemia in cyclosporine treated renal allograft recipients. Lancet. 1983:370–371. doi: 10.1016/s0140-6736(83)90345-8. [DOI] [PubMed] [Google Scholar]
- 28.Heering PJ, et al. Aldosterone resistance in kidney transplantation is in part induced by a down-regulation of mineralocorticoid receptor expression. Clin. Transplant. 2004;18:186–192. doi: 10.1046/j.1399-0012.2003.00154.x. [DOI] [PubMed] [Google Scholar]
- 29.Higgins R, et al. Hyponatraemia and hyperkalaemia are more frequent in renal transplant recipients treated with tacrolimus than with cyclosporin. Further evidence for differences between cyclosporin and tacrolimus nephrotoxicities. Nephrology, dialysis, transplantation : official publication of the European Dialysis and Transplant Association - European Renal Association. 2004;19:444–450. doi: 10.1093/ndt/gfg515. [DOI] [PubMed] [Google Scholar]
- 30.Van Laecke S, et al. Posttransplantation hypomagnesemia and its relation with immunosuppression as predictors of new-onset diabetes after transplantation. American journal of transplantation : official journal of the American Society of Transplantation and the American Society of Transplant Surgeons. 2009;9:2140–2149. doi: 10.1111/j.1600-6143.2009.02752.x. [DOI] [PubMed] [Google Scholar]
- 31.Arthur JM, Shamim S. Interaction of cyclosporine and FK506 with diuretics in transplant patients. Kidney Int. 2000;58:325–330. doi: 10.1046/j.1523-1755.2000.00169.x. [DOI] [PubMed] [Google Scholar]
- 32.Schindler R, Tanriver Y, Frei U. Hypertension and allograft nephropathy--cause, consequence, or both? Nephrol Dial Transplant. 2000;15:8–10. doi: 10.1093/ndt/15.1.8. [DOI] [PubMed] [Google Scholar]
- 33.Schultheis PJ, et al. Phenotype resembling Gitelman's syndrome in mice lacking the apical Na+- Cl− cotransporter of the distal convoluted tubule [In Process Citation] J. Biol. Chem. 1998 Oct 30;273:29150–29155. doi: 10.1074/jbc.273.44.29150. [DOI] [PubMed] [Google Scholar]
- 34.Feng M, et al. Validation of volume-pressure recording tail-cuff blood pressure measurements. Am J Hypertens. 2008;21:1288–1291. doi: 10.1038/ajh.2008.301. [DOI] [PubMed] [Google Scholar]
- 35.Kurtz TW, Griffin KA, Bidani AK, Davisson RL, Hall JE. Recommendations for blood pressure measurement in humans and experimental animals. Part 2: Blood pressure measurement in experimental animals: a statement for professionals from the subcommittee of professional and public education of the American Heart Association council on high blood pressure research. Hypertension. 2005;45:299–310. doi: 10.1161/01.HYP.0000150857.39919.cb. [DOI] [PubMed] [Google Scholar]
- 36.Yang C-L, Zhu X, Ellison DH. The thiazide-sensitive Na-Cl cotransporter is regulated by a WNK kinase signaling complex. J. Clin. Invest. 2007;117:3403–3411. doi: 10.1172/JCI32033. [DOI] [PMC free article] [PubMed] [Google Scholar]
- 37.Welker P, et al. Renal Na+-K+-Cl− cotransporter activity and vasopressin-induced trafficking are lipid raft-dependent. American journal of physiology. 2008;295:F789–F802. doi: 10.1152/ajprenal.90227.2008. [DOI] [PMC free article] [PubMed] [Google Scholar]
- 38.Piechotta K, Lu J, Delpire E. Cation chloride cotransporters interact with the stress-related kinases Ste20-related proline-alanine-rich kinase (SPAK) and oxidative stress response 1 (OSR1) The Journal of biological chemistry. 2002;277:50812–50819. doi: 10.1074/jbc.M208108200. [DOI] [PubMed] [Google Scholar]
- 39.Yang SS, et al. Mechanisms for Hypercalciuria in Pseudohypoaldosteronism Type II-Causing WNK4 Knock-In Mice. Endocrinology. 2010 doi: 10.1210/en.2009-0951. [DOI] [PubMed] [Google Scholar]
- 40.Feng M, et al. Genetic analysis of blood pressure in 8 mouse intercross populations. Hypertension. 2009;54:802–809. doi: 10.1161/HYPERTENSIONAHA.109.134569. [DOI] [PMC free article] [PubMed] [Google Scholar]
Associated Data
This section collects any data citations, data availability statements, or supplementary materials included in this article.