Abstract
Background and Objectives
Several studies have demonstrated that polarization sensitive optical coherence tomography (PS-OCT) can be used to nondestructively measure the severity of subsurface demineralization in enamel and dentin, track lesion progression over time and measure remineralization. The purpose of this study was to develop methods for the automated assessment of the depth and severity of demineralization in PS-OCT scans.
Materials and Methods
Subsurface caries-like lesions of increasing depth and severity were produced in adjoining windows on 10 bovine enamel samples via exposure to demineralization for periods of 1–4 days. PS-OCT scans were acquired for each sample and analyzed using various methods to calculate the lesion depth and severity. Edge detection algorithms were most successful for measurement of the lesion depth for improved assessment of lesion severity.
Results
Edge-finding algorithms were able to detect significant differences (P <0.05) in the lesion depth and severity between each of the periods of demineralization and sound enamel. The lesion depth and mineral loss were also measured with polarized light microscopy and transverse microradiography after sectioning the teeth for comparison.
Conclusions
This study demonstrates that the depth and severity of early lesions can be calculated automatically for rapid analysis of PS-OCT images. Lasers Surg. Med. 42:62–68, 2010.
Keywords: enamel, caries, PS-OCT, image processing algorithms, early demineralization, edge detection
INTRODUCTION
New tools are needed to nondestructively assess the depth and severity of caries lesions to evaluate the effectiveness of chemical or laser intervention and for testing the efficacy of anticaries agents. The National Institute of Dental and Craniofacial Research has requested the validation of new technologies for the measurement of tooth surface demineralization or remineralization to serve as a likely surrogate end point in dental clinical trials [1]. Several studies have demonstrated that optical coherence tomography can be used to nondestructively measure the severity of subsurface demineralization in enamel and dentin and is therefore well suited for this role [2–9]. Polarization sensitivity is particularly valuable for imaging caries lesions due to the enhanced contrast of caries lesions provided by depolarization of the incident light by the lesion. Moreover, the confounding influence of the strong surface reflectance of the tooth surface is reduced in the polarization state orthogonal to the incident polarized light [5–11]. Baumgartner and coworkers [12–14] presented the first polarization resolved images of dental caries. PS-OCT images are typically processed in the form of phase and intensity images [11,15], such images best show variations in the birefringence of the tissues. Caries lesions rapidly depolarize the incident polarized light’ and the image of the orthogonal polarization to that of the incident polarization can provide improved contrast of caries lesions [5–11]. The image in the orthogonal polarization is also sometimes called the cross polarization image [16–18]. We previously developed an approach to quantifying the severity of caries lesion by integrating the reflectivity of the orthogonal polarization (⊥-axis) [5,6]. There are two mechanisms that can produce an increase in reflectivity in the orthogonal polarization. The native birefringence of the tooth enamel can rotate the phase angle of the incident light beam between the two orthogonal axes (similar to a wave-plate) as the light propagates through the enamel without changing the degree of polarization. The other mechanism is depolarization from scattering in which the degree of polarization is reduced. It is this latter mechanism that is exploited to measure the severity of demineralization. Complete depolarization of the incident linearly polarized light leads to equal distribution of the intensity in both orthogonal axes. Demineralization of the enamel due to dental decay causes an increase in the scattering coefficient by two orders of magnitude [19]. Thus, demineralized enamel induces a very large increase in the reflectivity along with depolarization. This in turn causes a large rise in the orthogonal polarization.
Another important advantage of the cross polarization approach is that the intensity of the strong reflection from the tooth surface is greatly reduced in the orthogonal polarization image enabling better resolution of the surface zone of the lesion. Moreover, the difficult task of deconvolving the strong surface reflection from the lesion can be avoided. The lesion surface zone is particularly important since it can potentially provide information about the lesion activity and the degree of remineralization [7,8,20]. The surface reflection in the orthogonal polarization state is reduced by the extinction ratio between the two polarization states in the particular PS-OCT being employed. Extinction ratios of 20–30 dB 100:1–1,000:1 are achievable for fiber-based OCT systems.
The reflectivity in the orthogonal polarization can be directly integrated to quantify the lesion severity, regardless of the tooth topography. Thus, lesion progression in the important pit and fissure systems of the molars can be monitored [6,21].
The measurement of lesion depth poses a challenge in OCT, because cutoff points have to be chosen to define the lesion depth and this is difficult because of the high dynamic range of the reflectivity. Since lesions do not have a sharp boundary and the reflectivity varies throughout the breadth of the lesion, that is, it is not a single peak, the conventional approach of choosing the point at which the intensity drops off by 3 dB does not apply. The signal fall off is very complicated because the light is exponentially attenuated while propagating into the sample and also exponentially attenuated upon exiting the sample. Cutoff intensity values such as the depth at which there is a 1/e2 decrease in intensity can be chosen but this does not always work effectively [22]. In this article edge finding routines were used to determine the lesion depth.
Another reason for developing routines for rapidly assessing demineralization in OCT images is that OCT systems are now readily available that can generate 3D tomographic images of areas of early demineralization on tooth surfaces in less than a second [23–26]. In order to rapidly process the images and effectively quantify the lesion severity, algorithms are needed to automatically extract lesion depth and severity information. In this article we demonstrate two approaches to automatically assess the depth and severity of demineralized enamel lesions.
MATERIALS AND METHODS
Sample Preparation
Ten enamel blocks, ~10 × 3 × 1 mm3, of bovine enamel were prepared from extracted bovine tooth incisors acquired from a slaughterhouse. Each enamel sample was partitioned into five regions or windows by cutting small incisions using a laser into the bovine enamel blocks (see Fig. 1). The incision area also has an increased resistance to acid dissolution that serves to more effectively isolate each group [22]. Incisions were etched using a transverse excited atmospheric pressure (TEA) CO2 laser operating at 9.3-μm, Impact 2500, GSI Lumonics (Rugby, UK). A thin layer of acid resistant varnish in the form of red nail polish, Revlon (New York, NY) was applied to protect the sound enamel control area before exposure to the 4.8 pH demineralization solution composed of a 40 ml aliquot of 2.0 mmol/L calcium, 2.0 mmol/L phosphate, and 0.075 mol/L acetate. Each sample was then placed into the demineralization solution and incubated at 37°C. After each 24 hours period of demineralization, one region of each sample was covered with a thin layer of the same acid resistant varnish to prevent further demineralization. After the fourth day, the samples were removed from the demineralization solution and the acid resistant varnish was removed using acetone. Each sample was then stored in 0.1% thymol solution to prevent fungal and bacterial growth.
Fig. 1.
A PS-OCT b-scan of the reflectivity in the orthogonal polarization (⊥-axis) to the incident linearly polarized light is shown taken along the long axis of the bovine enamel sample. The areas labeled (D0) are sound while (D1–D4) represent the 1-day periods in which that respective area was exposed to demineralization. Laser incisions separate each area (group). A red–white–blue color table was used in which strong reflectivity is in red and low reflectivity is blue.
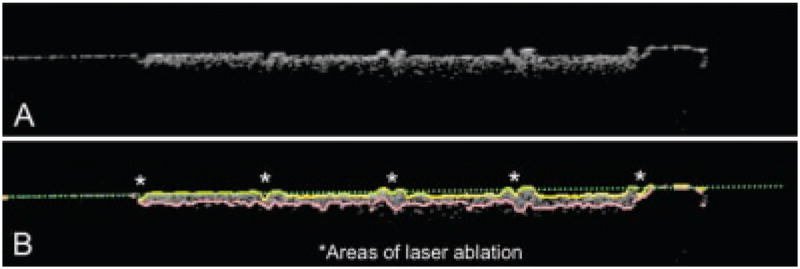
We also prepared a similar number of samples using the same conditions described above with a pH of 4.5. The lower pH resulted in rapid erosion of enamel surfaces as opposed to the desired subsurface demineralization (see Fig. 4).
Fig. 4.
A: A gray scale PS-OCT b-scan of the reflectivity in the orthogonal polarization (⊥) for one of the groups that exhibited excessive erosion. B: The same image showing the assigned edges after application of the edge detection algorithm. The green dotted line shows the original position of the enamel surface.
PS-OCT System
A autocorrelator-based Optical Coherence Domain Reflectometry (OCDR) system [27,28] with polarization switching probe, high efficiency piezoelectric fiber-stretchers, and two balanced InGaAs receivers that was designed and fabricated by Optiphase, Inc. (Van Nuys, CA) was integrated with a broadband high power superluminescent diode (SLD), Denselight (Jessup, MD) with an output power of 45-mW and a bandwidth of 35 nm and a high-speed XY-scanning system, ESP 300 controller and 850-HS stages, Newport (Irvine, CA) and used for in vitro optical tomography. An electromagnetic Faraday rotator/switch in the probe was used to acquire each polarization state. This system was used because it yields very clean PS-OCT images free of artifacts. The axial resolution was 22 μm in air and 14 μm in enamel with a lateral resolution of ~50 μm over the depth of focus of 10 mm. Each axial a-scan was 2,000 pts or pixels 316 pixels/mm and each b-scan was 240 a-scans spaced 50-μm apart. The all-fiber OCDR system has been previously described in greater detail [27,29]. The PS-OCT system was completely controlled using LabVIEW™ software, National Instruments (Austin, TX).
Polarized Light Microscopy (PLM) and Digital Transverse Microradiography (TMR)
After sample imaging was completed, ~200 μm thick serial sections were acquired using an Isomet 5000 saw (Buehler, Lake Bluff, IL), for polarized light microscopy (PLM) and digital transverse microradiography (TMR). PLM was carried out using a Meiji Techno RZT microscope (Meiji Techno Co., Ltd, Saitama, Japan) with an integrated digital camera, Canon EOS Digital Rebel XT (Canon, Inc., Tokyo, Japan). The sample sections were imbibed in water and examined in the brightfield mode with crossed polarizers and a red I plate with 500 nm retardation. A custom-built digital TMR system was used to measure mineral loss in the different partitions of the sample [30]. A high-speed motion control system with Newport UTM150 and 850G stages and an ESP300 controller coupled to a video microscopy and laser targeting system was used for precise positioning of the tooth samples in the field of view of the imaging system. The volume percent mineral for each sample thin section was determined by comparison with a calibration curve of X-ray intensity versus sample thickness created using sound enamel sections of 86.3 ± 1.9% volume percent mineral varying from 50 to 300 μm in thickness. The calibration curve was validated via comparison with cross sectional microhardness measurements. The volume percent mineral determined using microradiography for section thickness ranging from 50 to 300 μm highly correlated with the volume percent mineral determined using microhardness r2 = 0.99 [30].
Integrated Reflectivity
The integrated reflectivity, ΔR in units of (dB × μm) was calculated for each of the five windows (one sound, four demineralized) for every sample. Line profiles were taken from the orthogonal polarization (⊥-axis) PS-OCT images or b-scans in each of the five regions, and the reflectivity was integrated from the enamel surface to various depths, yielding the integrated reflectivity, ΔR, of the regions in units of decibels per micron. Previous studies have shown that ΔR can be correlated with the integrated mineral loss (volume % mineral × microns) called ΔZ [6,31].
Automated Calculation of Lesion Depth and Severity
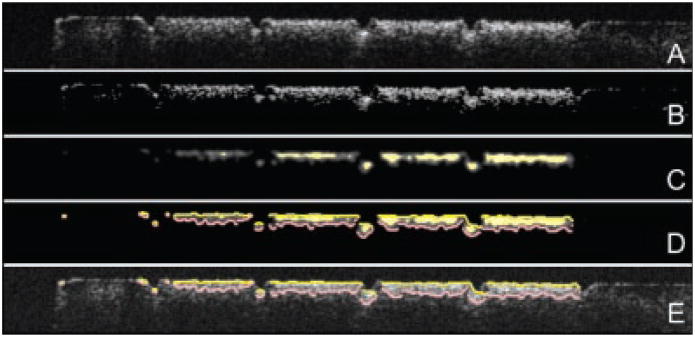
Each image was converted to an 8-bit grayscale format and four different processing steps were subsequently applied to each image. Then the detected edges of the lesion were overlaid over the original image. First background subtraction was carried out and then three filters were applied, a median filter, an anisotropic diffusion filter, and a threshold (Otsu) filter. The median filter is a classic filter to remove speckle, the anisotropic diffusion filter is designed to highlight boundaries and finally the threshold filter is used to identify the position of each edge.
Fifty line profiles (a-scans) were selected from the center of each treatment group between the laser-etched fiducial marks for each of the OCT b-scan images (orthogonal polarization). The integrated reflectivity (ΔR) from the lesion area representing the lesion severity was determined for each a-scan using two different approaches: fixed-depth, and edge-detected [32].
In the fixed-depth approach, the enamel surface boundary was determined by the intersection of the line profile (a-scan) and a manually established straight line that marks the enamel surface in a scan. The lesion boundary was set to an arbitrary depth of 200 μm from the established enamel line [5].
In the edge-detected approach, the enamel edge and the lesion boundary were detected in a three-step process. In the first step a 3 × 3 median filter was applied to remove speckle noise. An adapted iterative anisotropic diffusion filter [33,34] with (iterations = 30, K = 10,000, λ = 0.05) was subsequently used that increased lesion contrast. The iteration number is the number of times we applied the anisotropic filter. K represents a coefficient that controls how much of a large region “diffuses” through an edge. Lambda (λ) represents how much smoothing is desired. The values of K, λ, and the number of iterations were found empirically.
Finally, an edge locator was used to make two passes along each line—each pass starting from each end of the line—finding the first pixel whose color components all exceeded e−2 times the peak intensity. The distance between those positions represented the calculated depth of the lesion along that particular line.
Sample groups were compared using repeated measures analysis of variance (ANOVA) with a Tukey–Kramer post hoc multiple comparison test. Having all the study groups [5] for each series on each sample, untreated lesion (D), sound (S), fluoride treated (F) allowed us to decrease intersample variability. InStat™ from GraphPad software (San Diego, CA) was used for statistical calculations.
RESULTS
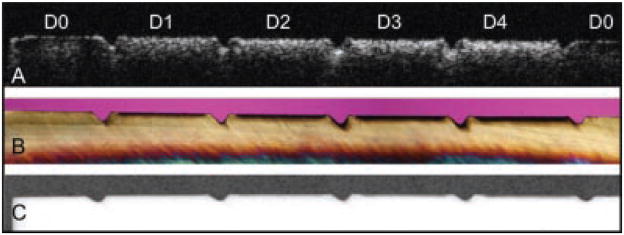
A PS-OCT b-scan (⊥-axis) of one of the samples is shown in Figure 1 and the increase in lesion severity after each day of demineralization is clearly evident as the lesion depth increases along with the reflectivity from the lesion area. The PS-OCT b-scan (⊥-axis) is shown in Figure 2 along with PLM and TMR images taken from the matched slice cut from the sample at a similar position to the OCT scan. The left and right sides of the sample are sound and the lesion severity increases from the left to the right, 0, 1, 2, 3, and 4 days of demineralization. Demineralization is inhibited in the incision areas due to heating by the CO2 laser. It is easiest to judge the increasing depth of the lesion after each day in the PLM image (Fig. 2b). Even though TMR is the gold standard it is not very sensitive and it is difficult to see lesions this small in the TMR image (Fig. 2c). It is easier to see differences in the lesion depth in the OCT images after each day of demineralization after application of the threshold filter and the edge detection algorithm (Fig. 3). Both fixed-depth and automatic edge-finding algorithms were able to detect significant differences (P <0.05) between each of the 4-day of demineralization and sound enamel. The edge detection approach worked for all the lesion groups including the lesions created after only 1-day of demineralization (mean depth ~40-μm) and it was able to differentiate between each lesion group even though the mean depth difference between groups was as small as 3 μm.
Fig. 2.
A: A gray scale PS-OCT b-scan of the reflectivity in the orthogonal polarization (⊥) to the incident linearly polarized light is shown taken along the long axis of the bovine enamel sample. The areas labeled (D0) are sound while (1–4) represent the 1-day periods in which that respective area was exposed to demineralization. B: Polarized light micrograph (PLM) of a thin section (200-μm) thick cut along the long axis of the same sample. C: Transverse microradiograph (TMR) of same thin section.
Fig. 3.
Sequential steps in the imaging processing of each PS-OCT b-scan. A: Raw grayscale image in the orthogonal polarization (⊥). B: Image adjusted with a threshold filter. C: Image after anisotropic diffusion, a filtration process designed to locate features. D: Edges located using an edge locator function. E: Found edges of D overlaid on A.
Figure 4 contains a PS-OCT b-scan (⊥-polarization) of one of the samples that was exposed to a lower pH (4.5) that resulted in rapid erosion and surface loss (cavitation). The edge detection algorithm was capable of detecting the edges of the lesion for these samples as well. The sites peripheral to each of the CO2 laser incisions resisted erosion due to the enhanced resistance to acid dissolution and they protrude from surface between each area.
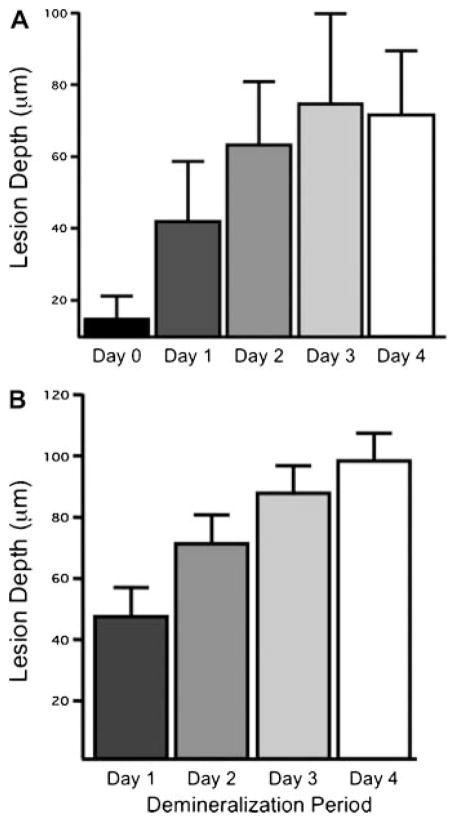
Since the edge detection algorithm calculates edges that represent the beginning and end of the lesion it provides a mechanism for calculation of the lesion depth. The mean ± standard deviation of the lesion depth determined from PS-OCT using the edge finding algorithm was compared with the lesion depth measured from PLM in Figure 5. The lesion depth is easier to calculate from PLM due to the sharper boundary caused by the loss of birefringence then from TMR where it is more difficult to demarcate the boundary between the lesion and the underlying sound enamel. Day 0 representing sound enamel is also included for the PS-OCT measurements since there is still some reflectivity from the sound enamel surface even in the orthogonal polarization state due to the finite extinction ratio (~20 dB). The edges calculated by the algorithm for the surface reflection was on the order of 20 μm, which is close to the axial resolution of the system. The correlation of the mean lesion depth was high (pr = 0.85) between the two methods with the exception of the Day 4 group that exhibited some erosion, the lesion depth for the PS-OCT group was slightly lower than for PLM ~75 μm versus 100 μm. There were significant differences in the mean lesion depth between all the groups for both PLM and PS-OCT.
Fig. 5.
The mean ± standard deviation of the lesion depth determined using: (A) PS-OCT with the edge finding algorithm and (B) from polarized light micrographs. All groups are significantly different P <0.05.
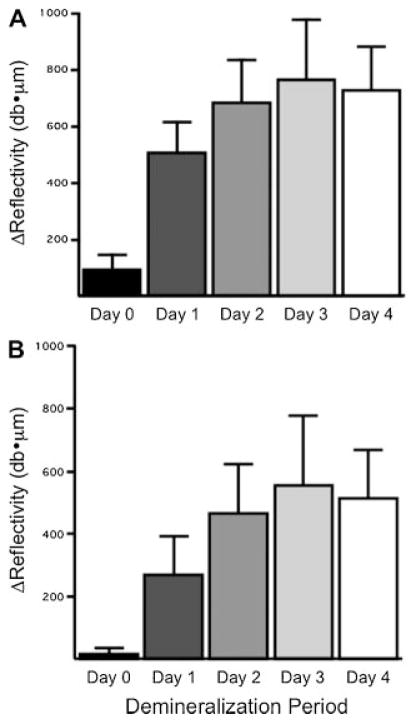
The mean integrated reflectivity (ΔR) calculated for all the samples using both the fixed depth and edge detection algorithms is plotted in Figure 6. Both approaches were able to detect significant differences between groups with the principal difference being the higher integrated reflectivity for the fixed depth algorithm for all the groups including the Day 0 group.
Fig. 6.
The mean 3standard deviation of the integrated reflectivity (ΔR) determined using PS-OCT using a fixed-depth algorithm (A) and the edge finding algorithm (B). All groups are significantly different P <0.05.
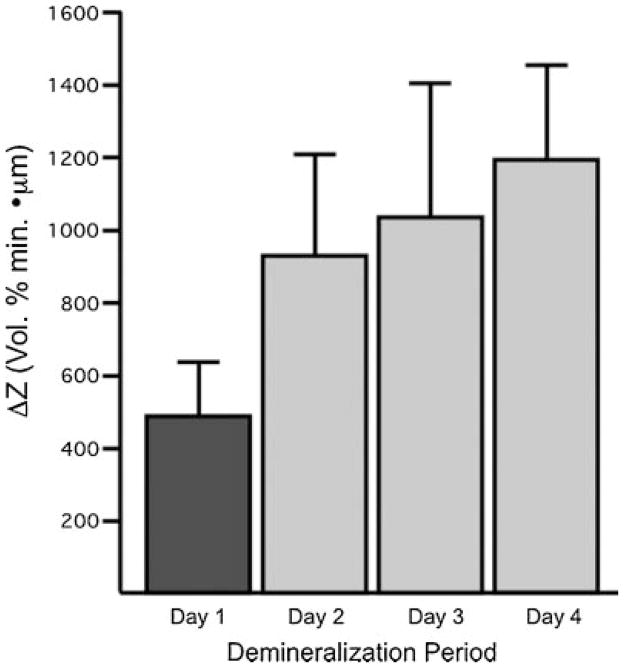
The values of the mean integrated mineral loss (ΔZ) determined from transverse microradiographs are shown in Figure 7. Although TMR was able to differentiate between Day 1 and Days 2–4, statistically similar values of ΔZ were measured for Day 2 through Day 4. All the methods OCT, PLM, and TMR indicated the greatest change in lesion severity occurred between Day 1 and Day 2.
Fig. 7.
The mean ± standard deviation of the integrated mineral loss (ΔZ) determined from transverse microradiographs. Groups with same color are statistically similar P >0.05.
DISCUSSION
This study demonstrates that automated calculation of the lesion depth and severity from PS-OCT scans is practical. Methods for calculation of the lesion depth and severity are important for the rapid processing of PS-OCT images for assessing changes in lesion severity over time and for testing the inhibition potential of anticaries agents. In previous PS-OCT studies, the severity of lesion areas was accessed by integration of single a-scans [5–11]. Better discrimination of lesion areas is possible if the entire lesion cross-section area or volume is integrated as opposed to a single a-scan since such lesions are seldom uniform. Since this approach involves large volumes of data it is only practical with the development of algorithms for automated processing. This becomes even more important for the efficient implementation of fast Fourier domain (FD) OCT systems that are capable of the acquisition of entire lesion volumes, for example, 2 × 2 × 3 mm3 volumes, at video rates.
In this study, two approaches were investigated to assess lesion severity. In the first approach the integration was carried out to a fixed depth that was chosen to be larger than all the lesions produced in the study. In the 2nd approach edge detection algorithms were used to find the depth of the lesion. Both approaches were able to discriminate between all five groups in the study.
Calculation of the lesion depth from OCT images has posed a particular challenge due to the high dynamic range of the images and it is difficult to choose a cut off point to serve as the endpoint of the lesion. The edge detection worked extremely well for calculation of the image depth. The lesion depth calculated by finding both edges of the lesion in the PS-OCT image was accomplished before sectioning of the bovine samples, therefore, the calculation was carried out blinded with respect to the depths calculated from the PLM. Even though our choice of algorithms was successful in achieving good agreement with histology, we did not explore all possible combinations of filters and methods of edge detection and have not determined if the approach applied here was optimal. Future studies will determine whether better performance can be achieved with different filtering and edge detection algorithms.
Acknowledgments
Contract grant sponsor: NIH; Contract grant numbers: R01-DE017869, R01-DE14698.
The authors acknowledge the support of NIH grants R01-DE017869 and R01-DE14698.
References
- 1.NIH. Diagnosis and Management of Dental Caries throughout Life: NIH Consensus Statement; 2001 March 26–28, 2001. Report #18. :1–24. [PubMed] [Google Scholar]
- 2.Amaechi BT, Higham SM, Podoleanu AG, Rodgers JA, Jackson DA. Use of optical coherence tomography for assessment of dental caries. J Oral Rehabil. 2001;28(12):1092–1093. doi: 10.1046/j.1365-2842.2001.00840.x. [DOI] [PubMed] [Google Scholar]
- 3.Amaechi BT, Podoleanu AG, Komarov G, Higham SM, Jackson DA. Quantification of root caries using optical coherence tomography and microradiography: A correlational study. Oral Health Prev Dent. 2004;2(4):377–382. [PubMed] [Google Scholar]
- 4.Amaechi BT, Podoleanu A, Higham SM, Jackson DA. Correlation of quantitative light-induced fluorescence and optical coherence tomography applied for detection and quantification of early dental caries. J Biomed Opt. 2003;8(4):642–647. doi: 10.1117/1.1606685. [DOI] [PubMed] [Google Scholar]
- 5.Fried D, Xie J, Shafi S, Featherstone JDB, Breunig T, Lee CQ. Early detection of dental caries and lesion progression with polarization sensitive optical coherence tomography. J Biomed Opt. 2002;7(4):618–627. doi: 10.1117/1.1509752. [DOI] [PubMed] [Google Scholar]
- 6.Jones RS, Darling CL, Featherstone JDB, Fried D. Imaging artificial caries on occlusal surfaces with polarization sensitive optical coherence tomography. Caries Res. 2004;40(2):81–89. doi: 10.1159/000091052. [DOI] [PubMed] [Google Scholar]
- 7.Jones RS, Darling CL, Featherstone JDB, Fried D. Remineralization of in vitro dental caries assessed with polarization sensitive optical coherence tomography. J Biomed Opt. 2006;11(1):014016(1–9). doi: 10.1117/1.2161192. [DOI] [PubMed] [Google Scholar]
- 8.Jones RS, Fried D. Remineralization of enamel caries can decrease optical reflectivity. J Dent Res. 2006;85(9):804–808. doi: 10.1177/154405910608500905. [DOI] [PMC free article] [PubMed] [Google Scholar]
- 9.Chong SL, Darling CL, Fried D. Nondestructive measurement of the inhibition of demineralization on smooth surfaces using polarization-sensitive optical coherence tomography. Lasers Surg Med. 2007;39(5):422–427. doi: 10.1002/lsm.20506. [DOI] [PubMed] [Google Scholar]
- 10.Hirasuna K, Fried D, Darling CL. Near-IR imaging of developmental defects in dental enamel. J Biomed Opt. 2008;13(4):044011(1–7). doi: 10.1117/1.2956374. [DOI] [PubMed] [Google Scholar]
- 11.Everett MJ, Colston BW, Sathyam US, Silva LBD, Fried D, Featherstone JDB. Non-invasive diagnosis of early caries with polarization sensitive optical coherence tomography (PS-OCT) In: Featherstone JDB, Rechmann P, Fried D, editors. Lasers in Dentistry V, SPIE. Vol. 3593. San Jose, CA: 1999. pp. 177–183. [Google Scholar]
- 12.Baumgartner A, Hitzenberger CK, Dicht S, Sattmann H, Moritz A, Sperr W, Fercher AF. Optical coherence tomography for dental structures. In: Featherstone JDB, Rechmann P, Fried D, editors. Lasers in Dentistry IV, SPIE. Vol. 3248. San Jose, CA: 1998. pp. 130–136. [Google Scholar]
- 13.Dicht S, Baumgartner A, Hitzenberger CK, Sattmann H, Robi B, Moritz A, Sperr W, Fercher AF. Polarization-sensitive optical optical coherence tomography of dental structures. In: Featherstone JDB, Rechmann P, Fried D, editors. Lasers in Dentistry V, SPIE. Vol. 3593. San Jose, CA: 1999. pp. 169–176. [Google Scholar]
- 14.Baumgartner A, Dicht S, Hitzenberger CK, Sattmann H, Robi B, Moritz A, Sperr W, Fercher AF. Polarization-sensitive optical optical coherence tomography of dental structures. Caries Res. 2000;34:59–69. doi: 10.1159/000016571. [DOI] [PubMed] [Google Scholar]
- 15.Wang XJ, Zhang JY, Milner TE, Boer JF, Zhang Y, Pashley DH, Nelson JS. Characterization of dentin and enamel by use of optical coherence tomography. Appl Opt. 1999;38(10):586–590. doi: 10.1364/ao.38.002092. [DOI] [PubMed] [Google Scholar]
- 16.Feldchtein FI, Gelikonov GV, Gelikonov VM, Iksanov RR, Kuranov RV, Sergeev AM, Gladkova ND, Ourutina MN, Warren JA, Reitze DH. In vivo OCT imaging of hard and soft tissue of the oral cavity. Opt Expr. 1998;3(3):239–251. doi: 10.1364/oe.3.000239. [DOI] [PubMed] [Google Scholar]
- 17.Gelikonov VM, Gelikonov GV. New approach to cross-polarized optical coherence tomography based on orthogonal arbitrarily polarized modes. Laser Phys Lett. 2006;3(9):445–451. [Google Scholar]
- 18.Gelikonov VM, Gelikonov GV. Fibre optic methods of cross-polarisation optical coherence tomography for endoscopic studies. Quantum Electron. 2008;38(7):634–640. [Google Scholar]
- 19.Darling CL, Huynh GD, Fried D. Light scattering properties of natural and artificially demineralized dental enamel at 1310-nm. J Biomed Opt. 2006;11(3):034023(1–11). doi: 10.1117/1.2204603. [DOI] [PubMed] [Google Scholar]
- 20.Can AM, Darling CL, Fried D. High-resolution PS-OCT of enamel remineralization. In: Rechmann P, Fried D, editors. Lasers in dentistry XIV, SPIE. Vol. 6843. San Jose, CA: 2008. pp. 68430T-1–7. [DOI] [PMC free article] [PubMed] [Google Scholar]
- 21.Ngaotheppitak P, Darling CL, Fried D. PS-OCT of natural pigmented and non-pigmented interproximal caries lesions. In: Rechmann P, Fried D, editors. Lasers in dentistry XI, SPIE. Vol. 5687. 2006. pp. 25–33. [Google Scholar]
- 22.Can AM, Darling CL, Ho CM, Fried D. Non-destructive assessment of inhibition of demineralization in dental enamel irradiated by a λ = 9.3-μm CO2 laser at ablative irradiation intensities with PS-OCT. Lasers Surg Med. 2008;40:342–349. doi: 10.1002/lsm.20633. [DOI] [PubMed] [Google Scholar]
- 23.Madjarova VD, Yasuno Y, Makita S, Hori Y, Voeffray JB, Itoh M, Yatagai T, Tamura M, Nanbu T. Investigations of soft and hard tissues in oral cavity by spectral domain optical coherence tomography. In: Tuchin VV, Izatt JA, Fujimoto JG, editors. Coherence domain optical methods and optical coherence tomography in biomedicine X, SPIE. Vol. 6079. 2006. pp. 60790N-1–7. [Google Scholar]
- 24.Seon YR, Jihoon N, Hae YC, Woo JC, Byeong HL, Gil-Ho Y. Realization of fiber-based OCT system with broadband photonic crystal fiber coupler. In: Tuchin VV, Izatt JA, Fujimoto JG, editors. Coherence domain optical methods and optical coherence tomography in biomedicine X, SPIE. Vol. 6079. 2006. pp. 60791N-1–7. [Google Scholar]
- 25.Yamanari M, Makita S, Violeta DM, Yatagai T, Yasuno Y. Fiber-based polarization-sensitive Fourier domain optical coherence tomography using B-scan-oriented polarization modulation method. Opt Expr. 2006;14(14) doi: 10.1364/oe.14.006502. [DOI] [PubMed] [Google Scholar]
- 26.Furukawa H, Hiro-Oka H, Amano T, DongHak C, Miyazawa T, Yoshimura R, Shimizu K, Ohbayashi K. Reconstruction of three-dimensional structure of an extracted tooth by OFDR-OCT. In: Tuchin VV, Izatt JA, Fujimoto JG, editors. Coherence domain optical methods and optical coherence tomography in biomedicine X, SPIE. Vol. 6079. San Jose, CA: 2006. pp. 60790T-1–7. [Google Scholar]
- 27.Bush J, Davis P, Marcus MA. All-fiber optic coherence domain interferometric techniques. In: Culshaw B, Harrington JA, Marcus MA, Saad M, editors. Fiber optic sensor technology II, SPIE. Vol. 4204. Boston, MA: 2000. pp. 71–80. [Google Scholar]
- 28.Bush J, Feldchtein F, Gelikonov G, Gelikonov V, Piyevsky S. Cost effective all-fiber autocorrelator for optical coherence tomography imaging. In: Voet M, Willsch R, Ecke W, Jones J, Culshaw B, editors. Coherence domain optical methods and optical coherence tomography in biomedicine IX, SPIE. Vol. 5855. Bruges, Belgium: 2005. pp. 254–257. [Google Scholar]
- 29.Ngaotheppitak P, Darling CL, Fried D, Bush J, Bell S. PS-OCT of occlusal and interproximal caries lesions viewed from occlusal surfaces. In: Rechmann P, Fried D, editors. Lasers in dentistry XII, SPIE. Vol. 6137. 2006. pp. 61370L-1–7. [Google Scholar]
- 30.Darling CL, Featherstone JDB, Le CQ, Fried D. An automated digital microradiography system for assessing tooth demineralization. In: Rechmann P, Fried D, editors. Lasers in Dentistry VX, SPIE. Vol. 7162. San Jose, CA: 2009. pp. 1–7. [DOI] [PMC free article] [PubMed] [Google Scholar]
- 31.Ngaotheppitak P, Darling CL, Fried D. Polarization optical coherence tomography for the measuring the severity of caries lesions. Lasers Surg Med. 2005;37(1):78–88. doi: 10.1002/lsm.20169. [DOI] [PubMed] [Google Scholar]
- 32.Nixon MS, Aguado AS. Feature extraction and image processing. Boston: Academic Press; 2004. [Google Scholar]
- 33.Perona P, Malik J. Scale-space, edge, detection using anisotropic diffusion. IEEE Trans PAMI. 1990;17(7):629–639. [Google Scholar]
- 34.Otsu N. A threshold selection method from gray-level histograms. A threshold selection method from gray-level histograms. IEEE Trans SMC. 1979;9(1):62–66. [Google Scholar]


