Abstract
Metabolomics is the most reliable analytical method for understanding metabolic diversity in single organelles derived from single cells. Although metabolites such as phosphate compounds are believed to be localized in different organelles in a highly specific manner, the process of metabolite compartmentalization in the cell is not thoroughly understood. The analysis of metabolites in single organelles has consequently presented a significant challenge. In this study, we used a metabolomic method to elucidate the localization and dynamics of 125 known metabolites isolated from the vacuole and cytoplasm of a single cell of the alga Chara australis. The amount of metabolites in the vacuole and the cytoplasm fluctuated asynchronously under various stress conditions, suggesting that metabolites are spatially regulated within the cell. Metabolite transport across the vacuolar membrane can be directly detected using the microinjection technique, which may reveal a previously unknown function of the vacuole.
Metabolites are believed to be highly compartmentalized within cellular organelles, because many enzymes involved in metabolite conversion show organelle-specific localization. Metabolite levels not only differ in individual organs, cells, and organelles but also fluctuate in response to developmental stages and environmental conditions. Metabolite levels are critical regulators of fundamental biological processes such as growth, differentiation, and defense responses. Therefore, the analysis of the temporal and spatial resolution of metabolites is important for elucidating their physiological functions within organisms (Ebert et al., 2010; Saito and Matsuda, 2010). However, analysis of the spatial resolution of metabolites at the single-cell/organelle level remains a technical challenge. Phosphate compounds such as sugar phosphates, nucleotides, and coenzymes are believed to be localized in the cytoplasmic region or the nucleus, because both biosynthetic and metabolic enzymes for phosphate compounds are annotated as cytoplasmic region or nuclear proteins. For example, glycolytic pathway enzymes are annotated as cytosol proteins. However, the intracellular distribution of phosphate compounds has not yet been confirmed.
Although subcellular metabolite distribution has been measured by various techniques, nonaqueous fractionation is one of the most promising approaches for studying metabolite compartmentalization (Wirtz et al., 1980; Gerhardt and Heldt, 1984; Farré et al., 2001; Willigen et al., 2004; Benkeblia et al., 2007; Krueger et al., 2009; Wienkoop et al., 2010). In the nonaqueous method, two nonaqueous solvents are used for extraction and separation of subcellular components by a density gradient, and fractionated samples and enzyme markers can be subsequently assayed to determine the subcellular distribution of metabolites. Although this technique is superior to and more versatile than many other such techniques, the purity of the target organelles in isolated fractions remains a problem. Moreover, multiple cells are required in the nonaqueous method. In contrast, metabolites derived from a single vacuole can be isolated from a single Chara australis cell. Subcellular isolation techniques using microscopy have also been developed for organelle metabolomic studies. For instance, Mizuno et al. (2008) used a nanoelectrospray ionization tip acting as a micropipette under a microscope to isolate the molecular content from the cytoplasm of a live single cell, which was then examined by mass spectrometry (MS). Although this technique may become an important method with future technical advances, it is presently impossible to apply this technique to all subcellular components, because we lack the spatial resolution of the laser microdissection method (Faulkner et al., 2005; Schad et al., 2005; Fiehn et al., 2007; Matsuda et al., 2009). An internodal cell of C. australis is currently the only source of a pure single vacuole from a single cell.
In this study, we determined the localization and dynamics of metabolites in the vacuole and cytoplasm of a single cell. In our isolation method, a single cell was separated into two fractions: a single vacuolar solution and what was referred to as the cytoplasm, which included plastids, mitochondria, nuclei, the endomembrane system, and the cell wall. We used a metabolomic approach based on combined capillary electrophoresis (CE)-MS to investigate the metabolomics of a single organelle using a giant internodal cell of C. australis. CE-MS is a useful analytical method for detecting ionic metabolites such as amino acids, organic acids, nucleotides, and sugar phosphates (Monton and Soga, 2007; Klampfl, 2009; Ramautar et al., 2009; Poinsot et al., 2010). The giant internodal cell of C. australis can grow to an approximate length of 20 cm and a volume of 50 μL. Because of their large size, internodal cells of the Characeae family have been widely used in studies on membrane physiology and cytoplasmic streaming (Shimmen and Tazawa, 1982; Tazawa et al., 1987). Compared to embryophyte vacuoles, the vacuole of C. australis has a simpler structure and a single cylindrical vacuole within a single cell. In this study, we used this unique cell to determine the metabolome of a single vacuole and the cytoplasm, thereby leading to the clarification of the metabolite distribution in a single cell.
RESULTS
Vacuoles and Cytoplasm Were Successfully Isolated from C. australis Cells
Single vacuoles and cytoplasm were isolated from internodal cells of C. australis, taking care to avoid contamination of the fractions. To confirm the purity of the isolated vacuolar and cytoplasmic solutions, the activities of two marker enzymes (α-mannosidase, a vacuolar enzyme, and malate dehydrogenase, a cytoplasmic enzyme; Lin and Wittenbach, 1981; Saunders and Gillespie, 1984) were determined for each fraction. α-Mannosidase and malate dehydrogenase activities were 14.5 (1.41)/1.07 (1.85) and 0.083 (0.079)/58.8 (15.6) (averages [sds] of three replicates of vacuole/cytoplasm) pmol·min−1·mL−1 of each fraction, respectively. These results indicate successful isolation of high-purity vacuolar and cytoplasmic content (99.9% and 93.1%, respectively), and these purification efficiencies were similar to those reported previously (Sakano and Tazawa, 1984). α-Mannosidase activity was recently found in the Golgi apparatus of Arabidopsis (Arabidopsis thaliana; Liebminger et al., 2009), suggesting that the low amount of α-mannosidase activity detected in the cytoplasm may be either from the leftover vacuole on the inner vacuole membrane or from the Golgi apparatus. The vacuolar solution isolated by a similar method reportedly did not include the activity of latent inosine diphosphatase (a marker enzyme of the Golgi apparatus; Takeshige et al., 1988), and Golgi apparatus contamination of the isolated vacuolar fraction in this study was minimal.
Cellular Metabolites Were Located Separately in the Vacuole and Cytoplasm
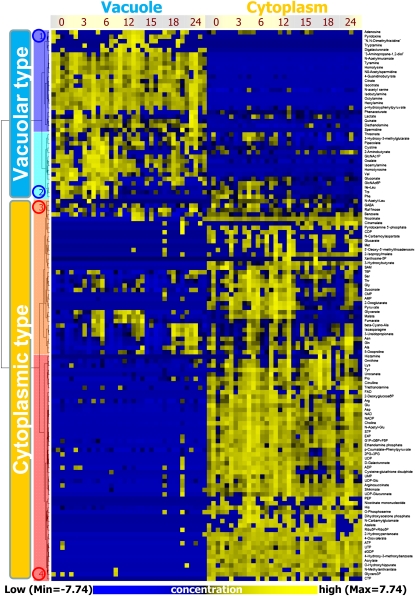
To examine fluctuations in metabolite levels in the vacuole and the cytoplasm of a C. australis internodal cell under different light conditions, fractions were collected from a single cell at seven time points during a 12-h light/12-h dark cycle (0, 3, 6, 12, 15, 18, and 24 h after lighting). We detected 125 metabolites within a single vacuole and cytoplasm from a C. australis internodal cell using a CE-MS-based metabolomic analysis system. Amounts of identified metabolites at each time point were standardized (z score) to relative amounts and classified by hierarchical cluster analysis (HCA; Fig. 1). HCA clearly indicated that the metabolites separated into two clusters according to their preferential localization properties: vacuole-type metabolites and cytoplasm-type metabolites (Fig. 1). The average ratio of metabolite compartmentalization in a cell is shown in Supplemental Figure S1. Overall, 11 and 26 different metabolites were found in the vacuolar and cytoplasmic fractions, respectively, whereas other metabolites were detected in both fractions at specific ratios. HCA also demonstrated vacuole-type and cytoplasm-type separation of metabolites corresponding to unidentified peaks detected using CE-MS analysis (data not shown). We also used liquid chromatography-MS metabolomic analysis (Matsuda et al., 2009) on a C. australis vacuole and cytoplasm. Although secondary metabolites were not identified, most peaks were classified into vacuolar or cytoplasmic type by HCA (data not shown), indicating that metabolites within an individual cell are compartmentalized at the organelle level. Although organelle-specific compartmentalization is often viewed as a common sense assumption, to our knowledge, this is the first study to confirm such compartmentalization of comprehensive metabolites in a single cell.
Figure 1.
HCA based on changes in metabolite amounts at different time points under changing light conditions. Metabolite levels were subjected to HCA after standardization (z score). HCA revealed that metabolites could be divided into two major clusters consisting of vacuole-type metabolites and cytoplasm-type metabolites. These clusters were again divided into two respective clusters: cluster 1 (blue), 2 (light blue), 3 (orange), and 4 (red). The yellow and blue colors correspond to high and low relative metabolite amounts, respectively.
Differences in the Hydrophobicity of Amino Acids Affected Their Spatial Distribution in a Cell
HCA showed that amino acids were classified into vacuolar and cytoplasmic clusters according to their hydrophobicity (Fig. 1): Hydrophobic amino acids (e.g. Ile, Leu, Val, Trp, and Phe) were found in the vacuolar cluster, whereas other amino acids were found in the cytoplasmic cluster. These results imply that spatial and temporal changes in the amount of amino acids with similar chemical properties are synchronized in cells depending on light conditions, suggesting that the substrate specificity of amino acid transporters on vacuolar membranes depends on the physicochemical properties of the metabolites.
Metabolites with Similar Chemical Properties Showed Similar Fluctuations in a Cell
Metabolites in cluster 1 (blue in Fig. 1) were found predominantly in the vacuole at all time points. Cluster 2 (light blue) included metabolites that were mainly localized in the vacuole but also found in the cytoplasm during certain light conditions. In contrast, metabolites that were classified into clusters 3 (orange) and 4 (red) were abundant in the cytoplasm. However, metabolites in cluster 3 were also detected in vacuolar fractions. The HCA showed side-by-side classification of metabolites with similar chemical properties: citrate and isocitrate (cluster 1), Asn and Gln (cluster 3), and Glu and Asp and NAD and NADP (cluster 4). In addition, aliphatic amines such as octylamine were clustered into vacuolar-type metabolites, and nucleotides and sugar phosphates were located nearby. These results demonstrate the synchronized fluctuations of several metabolites with similar chemical properties in a single cell.
Phosphate Metabolites Showed Intracellular Localization
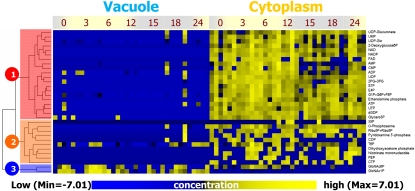
Most phosphate metabolites were localized in the cytoplasm (clusters 1 and 2 in Fig. 2). Coenzymes, UDP sugars, and sugar phosphates, whose levels could be regulated by cytoplasmic homeostasis, were classified in cluster 1 (red). Cluster 2 (orange) consisted of various metabolites that were detected in minute amounts. Although these metabolites did not show a set pattern in their fluctuations, they were definitely cytoplasm-type metabolites. In contrast, 2-GlcNAc phosphates were classified as vacuole-type metabolites (cluster 3 in Fig. 2). Sugar phosphates were detected in vacuoles, especially under dark conditions (Supplemental Fig. S2).
Figure 2.
HCA based on changes in phosphate metabolite amounts at different time points under changing light conditions. Metabolite levels were subjected to HCA after standardization (z score). Phosphate metabolites were divided into three major clusters consisting of cytoplasm-type metabolites (clusters 1 and 2) and vacuole-type metabolites (cluster 3). The yellow and blue colors correspond to high and low relative metabolite amounts, respectively.
Environmental Conditions Influenced the Spatial Fluctuations of Metabolites in a Cell
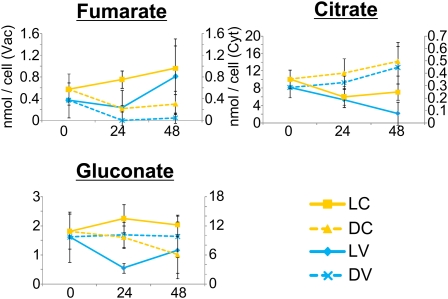
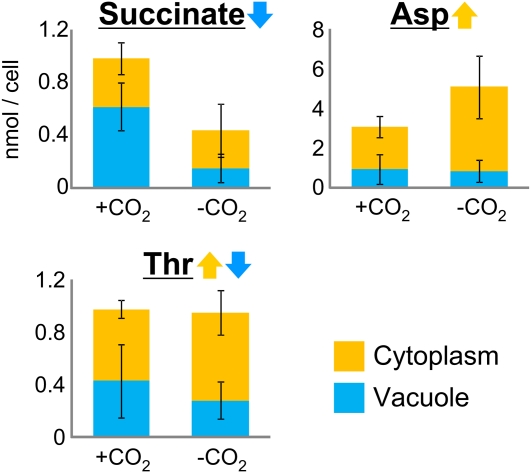
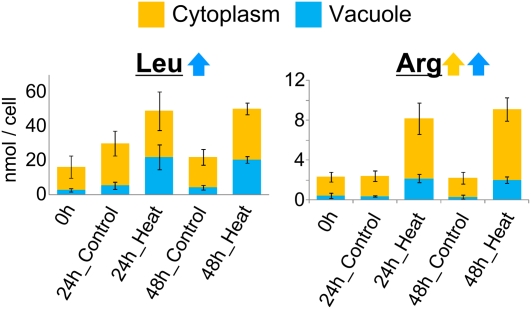
To assess the assumption that the localization and fluctuation of metabolites are differentially regulated depending on metabolite variety, metabolite levels were examined under various environmental conditions. Continuous light and dark conditions were found to affect cell metabolite levels (Supplemental Fig. S3). For example, fumarate levels in the vacuole and cytoplasm increased under continuous light conditions and decreased under continuous dark conditions (Fig. 3), whereas citrate levels decreased under continuous light conditions and increased under continuous dark conditions (Fig. 3). Cytoplasmic gluconate levels did not change under continuous light conditions but decreased under dark conditions, whereas vacuolar gluconate levels decreased under continuous light conditions and did not change under continuous dark conditions (Fig. 3). CO2 deficiency altered the concentration and localization of metabolites in single C. australis cells (Supplemental Fig. S4). Cellular succinate levels decreased in the absence of CO2, but cytoplasmic levels were unchanged (Fig. 4). Asn levels increased only in the cytoplasm (Fig. 4). The ratio of vacuolar and cytoplasmic Thr levels was altered, although cellular levels were not altered. Heat stress also influenced cellular metabolite levels (Supplemental Fig. S5) by increasing vacuolar Leu levels and increasing both cytoplasmic and vacuolar Arg levels (Fig. 5). These results suggest that metabolite levels are regulated separately in intracellular compartments.
Figure 3.
Metabolite fluctuations under continuous light or dark conditions. LC represents the cytoplasm under continuous light conditions; DC, cytoplasm under continuous dark conditions; LV, the vacuole under continuous light conditions; and DV, the vacuole under continuous dark conditions. Error bars represent the sd of the mean for five cells. Blue and yellow colors indicate data from the vacuole and cytoplasm, respectively.
Figure 4.
Metabolite fluctuations under CO2-deficient conditions. Error bars represent the sd of the mean for five cells. Blue and yellow colors represent data from the vacuole and cytoplasm, respectively.
Figure 5.
Metabolite fluctuations under heat-stress conditions. Error bars represent the sd of the mean for five cells. Blue and yellow colors represent data from the vacuole and cytoplasm, respectively.
The Microinjection Technique Enabled the Direct Detection of Metabolite Transport across the Vacuolar Membrane
Metabolite transport across the vacuolar membrane was directly detected in C. australis internodal cells using the microinjection technique. Pro labeled with stable isotopes was injected into a vacuole of a C. australis internodal cell under a microscope, and vacuolar and cytoplasmic levels of labeled Pro were quantified. Although Pro was largely localized in the vacuole immediately after injection, approximately 78% was detected in the cytoplasm 24 h after injection. This vacuole-cytoplasm ratio is similar to that of the C. australis internodal cell under normal conditions (Supplemental Table S1). Because the Pro-injected cell remained alive after injection, which was confirmed by the observation of cytoplasmic streaming, labeled Pro must have been transported from the vacuole to the cytoplasm without vacuolar membrane disruption. This result suggests the existence of a regulated transport system that maintains cytosolic Pro at desired levels.
DISCUSSION
Our method to isolate vacuoles has several advantages over other methods such as the perfusion method, which is also a superior method for isolating a pure, single vacuole from a single cell (Sakano and Tazawa, 1984). However, the perfusion method is more time consuming than our vacuolar isolation method, because perfusion must be conducted carefully to prevent metabolite movement across the vacuolar membrane during isolation, which would result in misleading metabolomic results. On the other hand, vacuolar solution can be isolated in approximately 10 s after loss of turgor pressure by our method. In addition, because metabolomics analysis of a single cell is necessary for understanding the physiological properties of neighboring cells at the metabolite level, our method requiring a single cell allows better high-resolution analysis compared to methods, such as nonaqueous extraction, requiring multiple cells. Therefore, our method is suitable for the isolation of a single vacuole from a single cell.
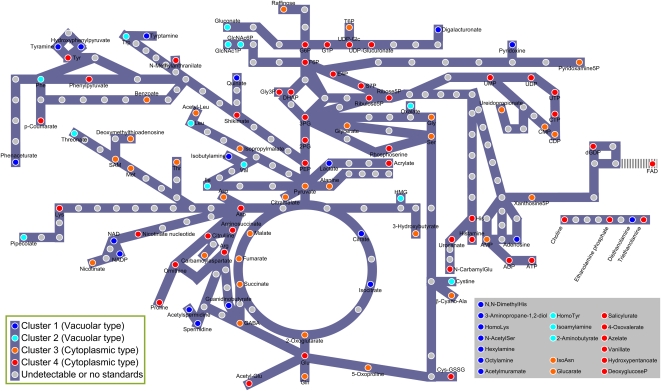
The cluster data in Figure 1 was projected onto a metabolite pathway map (Fig. 6). We found that metabolites in the glycolytic pathway, pentose phosphate pathway, and urea cycle were mainly localized in the cytoplasm. This suggests that the continuous reactions of these pathways occur in the cytoplasm and that there is no storage in the vacuole. On the other hand, most metabolites at the end of these pathways were detected in vacuolar-type clusters (Fig. 6), suggesting that the final biosynthesis products in cells are stored in the vacuole.
Figure 6.
Metabolic pathway map. Circles represent a single metabolite and circle colors correspond to those in Figure 1: cluster 1 (blue), 2 (light blue), 3 (orange), and 4 (red). Gray circles represent metabolites that were not detected in this study or are not annotated because of lack of standard compounds. Metabolites shown in the bottom right frame could not be projected onto known metabolic pathways.
To understand the effect of metabolite fluctuations on central metabolism, the time-course results of metabolites were projected onto the glycolytic pathway, pentose phosphate pathway, and tricarboxylic acid cycle (Supplemental Fig. S2). Metabolite levels in these pathways generally increased under light conditions (0–12 h) and decreased under dark conditions (12–24 h), which presumably results from the supply of Glc from photosynthetic activity under lighting conditions. However, the fluctuation range and subcellular localization of metabolite levels under changing light conditions differed among metabolites. Metabolite levels in the upstream pathways (Glc 6-P + Fru 6-P + Glc 1-P, dihydroxyacetonephosphate, erythrose 4-P, sedoheptulose 7-P, and ribulose 5-P + Rib 5-P) were relatively stable throughout the day, suggesting that these metabolites are replenished after their levels decrease under dark conditions and are maintained under cytoplasmic homeostasis. Additionally, we identified the time transition of the maximum levels of 2-phosphoglycerate + 3-phosphoglycerate (3–6 h), phosphoenolpyruvate (6 h), and pyruvate (12 h). Because 3-phosphoglycerate, phosphoenolpyruvate, and pyruvate are sources of various metabolites such as amino acids, they are competitively scrambled by enzymes, presumably leading to the time lag in the fluctuations of these metabolites. Organic acids in the tricarboxylic acid cycle play a role in the osmotic adjustment of vacuoles in addition to energy production by turning over the cycle. Therefore, a large amount of organic acids, especially citrates and isocitrates, were found in the vacuole. Pyruvate and 2-oxoglutarate, which were mainly localized in cytoplasm, did not contribute to osmotic adjustment of the vacuole. The ratio of fumarate levels between the vacuole and cytoplasm fluctuated with that of malate, suggesting that fumarate and malate play complementary roles in vacuolar functions, including the regulation of osmotic pressure of vacuoles. Fluctuations of the two main organic acids, namely, malate and citrate, differed under changing light conditions (Supplemental Fig. S2). Previous studies have shown that malate and citrate are regulated by different transporters on the vacuolar membrane (Mimura et al., 1990; Faulkner et al., 2005; Fiehn et al., 2007). Our results suggest the existence of different control systems for malate and citrate levels in a C. australis cell. The complex fluctuation of isocitrate and succinate levels may correlate with the activity of isocitrate lyase, which converts isocitrate into glyoxylate and succinate during the first step of the glyoxylate bypass.
Vacuoles presumably contain abundant degradation enzymes, including phosphatases, suggesting that phosphate metabolites are rapidly degraded within vacuoles. Since cytoplasmic contamination of the vacuole fraction, which includes chlorophyll, during isolation was negligible, our findings show that phosphate metabolites exist within the vacuole. These findings may be explained by differential compartmentalization of degradation enzymes and their substrate metabolites within vacuoles through unknown mechanisms. Takeshige and Tazawa (1989) reported the subcellular distribution of inorganic pyrophosphate and phosphate in Chara corallina. They found that inorganic pyrophosphate was predominantly localized in the cytosol, while inorganic phosphate was distributed equally in the cytosol, chloroplast, and vacuole. Inorganic pyrophosphate and phosphate levels, which might be regulated by the activity of H+-translocating inorganic pyrophosphatase in the vacuolar membrane, possibly affect the intracellular compartmentalization of organic phosphates.
Genomic or proteomic studies of species belonging to family Characeae may provide novel insights into vacuolar functions. For instance, Faulkner et al. (2005) performed proteomic analysis of C. corallina. However, because the genomes of species belonging to family Characeae have not yet been sequenced, proteomic data are of limited use. Proteomic analyses of C. australis vacuole and cytoplasm, including membrane proteins such as transporter molecules, complement the metabolomic data presented in this study. Internodal cells of species belonging to family Characeae have been used frequently for studying membrane physiology such as a cellular potential (Tazawa et al., 1987). Because Characeae algae are closely related to higher plants (Turmel et al., 2003), the C. australis cell used in this study is an inviting possibility for plant biologists. Moreover, our method for subcellular isolation using C. australis cells is superior to pure vacuole preparation from a single cell. Further analyses of C. australis internodal cells could clarify vacuolar functions and characterize membrane transporters to establish C. australis as a model organism for modern biological studies at the single-cell level.
MATERIALS AND METHODS
Metabolomic Methods
On the basis of the suggestion of the Metabolomics Standards Initiative (Fiehn et al., 2007), we described metadata acquired for this study in Supplemental Information S1. Briefly, single internodal cells of Chara australis cultured under various conditions were isolated from neighboring cells and exposed to air on a paraffin wax board. Both ends of the cells were cut after loss of turgor pressure. By inclining the board, the vacuolar solution was collected and used as the vacuolar fraction. After removing the vacuolar solution completely, the remaining biomaterial of the cell was used as the cytoplasmic fraction. Although loss of turgor pressure could cause metabolic changes in a C. australis cell, this procedure was necessary to isolate a single vacuole from a single cell. Vacuole solution (200 μL) was collected and diluted with water for liquid-liquid distribution. The frozen cytoplasm was homogenized with zirconia beads using a mixer mill (Retsch, http://www.retsch.com) at 27 Hz for 2 min. The solution was suspended in 200 μL of water and used as the cytoplasmic solution. To exclude proteins and hydrophobic compounds such as lipids, which can have a negative effect on the reproducibility of the results of electrophoresis, extracts were separated by adding methanol and chloroform to samples. Chloroform (200 μL) and methanol (500 μL), including 8 μm of internal standards such as Met sulfone for cation analysis and camphor-10-sulfonic acid for anion analysis, were used for compensation of the peak area after CE-MS analysis. The solution was added to 200-μL samples, the mixture was homogenized at 27 Hz for 1 min, and the sample solution was centrifuged at 20,400g for 3 min at 4°C. The upper layer was evaporated for 30 min at 45°C with a centrifugal concentrator and then separated into two layers to further purify the solution and reduce the volume. Because high-Mr compounds such as oligo-sugars may reduce CE performance, the upper layer was centrifugally filtered through a Millipore 5-kD cutoff filter at 9,100g for 120 min, and the filtrate was dried for 120 min with a centrifugal concentrator. The residue was dissolved in 20 μL water containing 200 μm of internal standards (3-aminopyrrolidine for cation analysis and trimesic acid for anion analysis) to compensate for migration time in the peak annotation step. This solution was used for CE-MS analyses. A detailed description of the CE-MS analysis conditions, including data processing, is described in Supplemental Information S1.
Enzyme Assay
α-Mannosidase and malate dehydrogenase activities were assayed as marker enzymes for the vacuole and cytoplasm fractions, respectively (Beers et al., 1992; Funk et al., 2002). p-Nitrophenol (PNP)-α-Man was used as a synthetic substrate for the α-mannosidase assay. Vacuolar and cytoplasmic solutions (30 μL) were individually added to 50 μL of 5 mm PNP-α-Man solution and 295 μL of 100 mm citrate buffer (pH 5.6). After incubation at 37°C for 1 h, the reaction was stopped by adding 750 μL of 200 mm NaCO3 solution. The absorbance of the released PNP was measured at a wavelength of 405 nm. Malate dehydrogenase assays for vacuolar and cytoplasmic fractions were performed using final concentrations of 50 mm HEPES (pH 7.5), 350 μm NADH, and 1 mm oxaloacetate. Enzymatic activities were determined from the absorbance changes at 340 nm following the addition of sample fractions.
Microinjection
Stable isotope-labeled Pro (l-Pro U-13C5, 98%; 15N, 98%; Cambridge Isotope Laboratories Inc., http://www.isotope.com) was injected into the vacuoles of C. australis internodal cells under an inverted microscope using a braking micropipette (Hiramoto, 1974). The vacuoles and cytoplasm were isolated, extracted, and analyzed as described above. Labeled Pro (mass-to-charge ratio = 122.0838, [M+H]+) was quantified by CE-MS.
Supplemental Data
The following materials are available in the online version of this article.
Supplemental Figure S1. The metabolite ratio of vacuole and cytoplasm of a Chara internodal cell.
Supplemental Figure S2. Fluctuations of levels of metabolites on the glycolytic pathway, pentose phosphate pathway, and tricarboxylic acid cycle under changing lighting conditions.
Supplemental Figure S3. HCA based on changes in peak intensities under continuous light or dark conditions.
Supplemental Figure S4. HCA based on changes in peak intensities under CO2 deficiency.
Supplemental Figure S5. HCA based on changes in peak intensities under heat stress.
Supplemental Table S1. Metabolite data set.
Supplemental Information S1. Figure legends for the supplemental figures and the supporting experimental procedures.
References
- Beers EP, Moreno TN, Callis J. (1992) Subcellular localization of ubiquitin and ubiquitinated proteins in Arabidopsis thaliana. J Biol Chem 267: 15432–15439 [PubMed] [Google Scholar]
- Benkeblia N, Shinano T, Osaki M. (2007) Metabolite profiling and assessment of metabolome compartmentation of soybean leaves using non-aqueous fractionation and GC-MS analysis. Metabolomics 3: 297–305 [Google Scholar]
- Ebert B, Zöller D, Erban A, Fehrle I, Hartmann J, Niehl A, Kopka J, Fisahn J. (2010) Metabolic profiling of Arabidopsis thaliana epidermal cells. J Exp Bot 61: 1321–1335 [DOI] [PMC free article] [PubMed] [Google Scholar]
- Farré EM, Tiessen A, Roessner U, Geigenberger P, Trethewey RN, Willmitzer L. (2001) Analysis of the compartmentation of glycolytic intermediates, nucleotides, sugars, organic acids, amino acids, and sugar alcohols in potato tubers using a nonaqueous fractionation method. Plant Physiol 127: 685–700 [DOI] [PMC free article] [PubMed] [Google Scholar]
- Faulkner CR, Blackman LM, Cordwell SJ, Overall RL. (2005) Proteomic identification of putative plasmodesmatal proteins from Chara corallina. Proteomics 5: 2866–2875 [DOI] [PubMed] [Google Scholar]
- Fiehn O, Robertson D, Griffin J, van der Werf M, Nikolau B, Morrison N, Sumner LW, Goodacre R, Hardy NW, Taylor C, et al. (2007) The metabolomics standards initiative (MSI). Metabolomics 3: 175–178 [Google Scholar]
- Funk V, Kositsup B, Zhao C, Beers EP. (2002) The Arabidopsis xylem peptidase XCP1 is a tracheary element vacuolar protein that may be a papain ortholog. Plant Physiol 128: 84–94 [PMC free article] [PubMed] [Google Scholar]
- Gerhardt R, Heldt HW. (1984) Measurement of subcellular metabolite levels in leaves by fractionation of freeze-stopped material in nonaqueous media. Plant Physiol 75: 542–547 [DOI] [PMC free article] [PubMed] [Google Scholar]
- Hiramoto Y. (1974) A method of microinjection. Exp Cell Res 87: 403–406 [DOI] [PubMed] [Google Scholar]
- Klampfl CW. (2009) CE with MS detection: a rapidly developing hyphenated technique. Electrophoresis 30: S83–S91 [DOI] [PubMed] [Google Scholar]
- Krueger S, Niehl A, Martin MCL, Steinhauser D, Donath A, Hildebrandt T, Romero LC, Hoefgen R, Gotor C, Hesse H. (2009) Analysis of cytosolic and plastidic serine acetyltransferase mutants and subcellular metabolite distributions suggests interplay of the cellular compartments for cysteine biosynthesis in Arabidopsis. Plant Cell Environ 32: 349–367 [DOI] [PubMed] [Google Scholar]
- Liebminger E, Hüttner S, Vavra U, Fischl R, Schoberer J, Grass J, Blaukopf C, Seifert GJ, Altmann F, Mach L, et al. (2009) Class I α-mannosidases are required for N-glycan processing and root development in Arabidopsis thaliana. Plant Cell 21: 3850–3867 [DOI] [PMC free article] [PubMed] [Google Scholar]
- Lin W, Wittenbach VA. (1981) Subcellular localization of protease in wheat and corn mesophyll protoplasts. Plant Physiol 67: 969–972 [DOI] [PMC free article] [PubMed] [Google Scholar]
- Matsuda F, Yonekura-Sakakibara K, Niida R, Kuromori T, Shinozaki K, Saito K. (2009) MS/MS spectral tag-based annotation of non-target profile of plant secondary metabolites. Plant J 57: 555–577 [DOI] [PMC free article] [PubMed] [Google Scholar]
- Mimura T, Sakano K, Tazawa M. (1990) Changes in the subcellular distribution of free amino acids in relation to light conditions in cells of Chara corallina. Bot Acta 103: 42–47 [Google Scholar]
- Mizuno H, Tsuyama N, Harada T, Masujima T. (2008) Live single-cell video-mass spectrometry for cellular and subcellular molecular detection and cell classification. J Mass Spectrom 43: 1692–1700 [DOI] [PubMed] [Google Scholar]
- Monton MR, Soga T. (2007) Metabolome analysis by capillary electrophoresis-mass spectrometry. J Chromatogr A 1168: 237–246 [DOI] [PubMed] [Google Scholar]
- Poinsot V, Gavard P, Feurer B, Couderc F. (2010) Recent advances in amino acid analysis by CE. Electrophoresis 31: 105–121 [DOI] [PubMed] [Google Scholar]
- Ramautar R, Somsen GW, de Jong GJ. (2009) CE-MS in metabolomics. Electrophoresis 30: 276–291 [DOI] [PubMed] [Google Scholar]
- Saito K, Matsuda F. (2010) Metabolomics for functional genomics, systems biology, and biotechnology. Annu Rev Plant Biol 61: 463–489 [DOI] [PubMed] [Google Scholar]
- Sakano K, Tazawa M. (1984) Intracellular distribution of free amino acids between the vacuolar and extravacuolar compartments in internodal cells of Chara australis. Plant Cell Physiol 25: 1477–1486 [Google Scholar]
- Saunders JA, Gillespie JM. (1984) Localization and substrate specificity of glycosidases in vacuoles of Nicotiana rustica. Plant Physiol 76: 885–888 [DOI] [PMC free article] [PubMed] [Google Scholar]
- Schad M, Mungur R, Fiehn O, Kehr J. (2005) Metabolic profiling of laser microdissected vascular bundles of Arabidopsis thaliana. Plant Methods 1: 2. [DOI] [PMC free article] [PubMed] [Google Scholar]
- Shimmen T, Tazawa M. (1982) Cytoplasmic streaming in the cell model of Nitella. Protoplasma 112: 101–106 [Google Scholar]
- Takeshige K, Tazawa M. (1989) Determination of the inorganic pyrophosphate level and its subcellular localization in Chara corallina. J Biol Chem 264: 3262–3266 [PubMed] [Google Scholar]
- Takeshige K, Tazawa M, Hager A. (1988) Characterization of the H+ translocating adenosine triphosphatase and pyrophosphatase of vacuolar membranes isolated by means of a perfusion technique from Chara corallina. Plant Physiol 86: 1168–1173 [DOI] [PMC free article] [PubMed] [Google Scholar]
- Tazawa M, Shimmen T, Mimura T. (1987) Membrane control in the characeae. Annu Rev Plant Physiol 38: 95–117 [Google Scholar]
- Turmel M, Otis C, Lemieux C. (2003) The mitochondrial genome of Chara vulgaris: insights into the mitochondrial DNA architecture of the last common ancestor of green algae and land plants. Plant Cell 15: 1888–1903 [DOI] [PMC free article] [PubMed] [Google Scholar]
- Wienkoop S, Weiß J, May P, Kempa S, Irgang S, Recuenco-Munoz L, Pietzke M, Schwemmer T, Rupprecht J, Egelhofer V, et al. (2010) Targeted proteomics for Chlamydomonas reinhardtii combined with rapid subcellular protein fractionation, metabolomics and metabolic flux analysis. Mol Biosyst 6: 1018–1031 [DOI] [PubMed] [Google Scholar]
- Willigen CV, Pammenter NW, Mundree SG, Farrant JM. (2004) Mechanical stabilization of desiccated vegetative tissues of the resurrection grass Eragrostis nindensis: does a TIP 3;1 and/or compartmentalization of subcellular components and metabolites play a role? J Exp Bot 55: 651–661 [DOI] [PubMed] [Google Scholar]
- Wirtz W, Stitt M, Heldt HW. (1980) Enzymic determination of metabolites in the subcellular compartments of spinach protoplasts. Plant Physiol 66: 187–193 [DOI] [PMC free article] [PubMed] [Google Scholar]


