Abstract
Insertional mutagenesis of legume genomes such as soybean (Glycine max) should aid in identifying genes responsible for key traits such as nitrogen fixation and seed quality. The relatively low throughput of soybean transformation necessitates the use of a transposon-tagging strategy where a single transformation event will produce many mutations over a number of generations. However, existing transposon-tagging tools being used in legumes are of limited utility because of restricted transposition (Ac/Ds: soybean) or the requirement for tissue culture activation (Tnt1: Medicago truncatula). A recently discovered transposable element from rice (Oryza sativa), mPing, and the genes required for its mobilization, were transferred to soybean to determine if it will be an improvement over the other available transposon-tagging tools. Stable transformation events in soybean were tested for mPing transposition. Analysis of mPing excision at early and late embryo developmental stages revealed increased excision during late development in most transgenic lines, suggesting that transposition is developmentally regulated. Transgenic lines that produced heritable mPing insertions were identified, with the plants from the highest activity line producing at least one new insertion per generation. Analysis of the mPing insertion sites in the soybean genome revealed that features displayed in rice were retained including transposition to unlinked sites and a preference for insertion within 2.5 kb of a gene. Taken together these findings indicate that mPing has the characteristics necessary for an effective transposon-tagging resource.
Soybean (Glycine max) is a key component of modern agriculture due to the high protein and oil content of its seed and the lower fertilizer inputs required because of its nitrogen-fixing capacity (Singh and Shivakumar, 2010). The desire to understand the underlying genetics of these traits has prompted the recent sequencing of the soybean genome (Schmutz et al., 2010). Sequence annotation predicted at least 46,430 genes (Schmutz et al., 2010), with another study identifying up to 55,616 (Libault et al., 2010). While homology to characterized proteins can be used to predict gene function for a few genes, the vast majority of the genes are uncharacterized. Determining gene function using gene silencing or overexpression strategies is feasible, however the lack of high-throughput transformation in soybean limits the scope of these approaches. Therefore, alternative tools for identifying soybean genes are needed.
Insertional mutagenesis using T-DNA can be a powerful tool to connect genotype to phenotype, when coupled with high-throughput transformation as was done with Arabidopsis (Arabidopsis thaliana). The absence of a comparable transformation system for soybean makes T-DNA tagging impractical. However, insertional mutagenesis by an active transposable element would facilitate soybean gene discovery. The only transposon-tagging tool that has been characterized for soybean is the Ac/Ds system (Mathieu et al., 2009). The Ds element primarily produces linked insertions in maize (Zea mays), tobacco (Nicotiana tabacum), and Arabidopsis (Dooner and Belachew, 1989; Jones et al., 1990; Bancroft and Dean, 1993). For Ds to be an effective mutagen in soybean, many Ds elements would have to be inserted throughout the genome by transformation. While this was possible in Arabidopsis where transformation is very efficient (Muskett et al., 2003; Nishal et al., 2005), it is not a viable strategy in soybean. In another legume species, Medicago truncatula, the Tnt1 retroelement is an effective mutagen (d’Erfurth et al., 2003). However activation of Tnt1 usually requires tissue culture (d’Erfurth et al., 2003), which limits throughput and has the potential to induce other genomic or epigenetic changes (Kaeppler and Phillips, 1993).
A transposon that exhibits many of the desired traits for transposon tagging is the mPing element from rice (Oryza sativa; Jiang et al., 2003; Kikuchi et al., 2003; Nakazaki et al., 2003). mPing is a 430-bp miniature inverted repeat transposable element that transposes at a high frequency and has reached high copy number in some rice cultivars (Naito et al., 2006). It is a nonautonomous deletion derivative of the Ping element, which lacks the two open reading frames (ORF1 and Transposase [TPase]) required for transposition. In Arabidopsis, mPing was mobilized by expressing the ORF1 and TPase proteins from either Ping or the closely related Pong element (Yang et al., 2007). Most of the resulting insertions were located near genes (68.6% < 1 kb from a gene) and were shown to be unlinked to the original transgene. Unlike most DNA transposons that often cause indels (called footprints) at the site of excision, mPing excision sites are repaired precisely at a high frequency (99% and 82%) in both yeast (Saccharomyces cerevisiae; Hancock et al., 2010) and Arabidopsis (Yang et al., 2007), respectively. These transposition characteristics indicated that mPing could be suitable for transposon tagging, with the caveat that heritable insertions had not been shown in hosts other than rice.
The objective of this work was to evaluate the suitability of mPing as a mutagenesis tool in soybean. The analysis included identifying heritable mutations and their frequency, characterizing the insertion site preference, and determining the extent to which precise excision of mPing occurs.
RESULTS
mPing Excision and Transformation
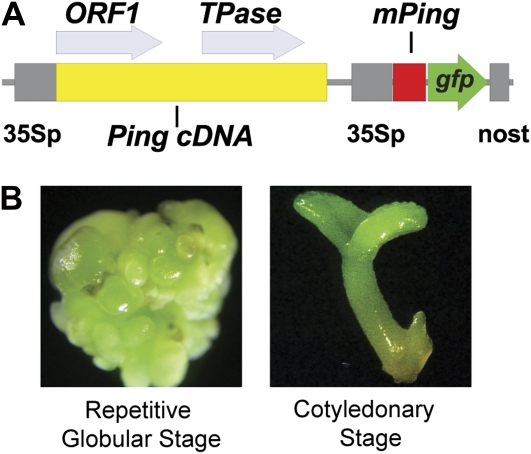
The pICDS-mP plasmid developed by Yang et al. (2007) was adapted for soybean transformation by changing the selectable marker from kanamycin to hygromycin resistance. The resulting plasmid, named pPing (Supplemental Fig. S1), contains an mPing gfp reporter construct (Fig. 1A), which only expresses gfp upon excision of the mPing element (Yang et al., 2007). The Ping proteins are expressed from a Ping cDNA containing the ORF1 and TPase coding regions (Yang et al., 2007). After transformation of soybean embryogenic tissue, hygromycin-resistant clusters were selected and assigned event numbers. PCR analysis was used to identify 10 events that were PCR positive for ORF1, TPase, and mPing.
Figure 1.
pPing construct and embryo developmental stages. A, Diagram of the Ping- and mPing-containing regions of the pPing plasmid used for soybean transformation (35Sp, cauliflower mosaic virus 35S promoter; nost, nopaline synthase terminator; gfp, green florescent protein). B, Representative images of the two sequential and distinct developmental stages of soybean embryo tissue culture that were harvested to test for mPing transposition.
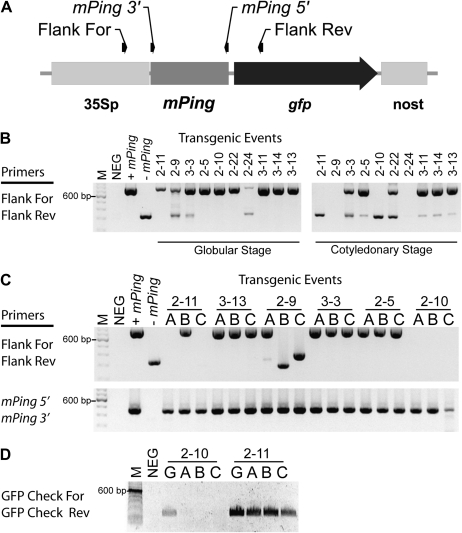
PCR based on primers that flank the mPing element was used to detect transposition, as a smaller amplicon is produced after element excision (Fig. 2A). Two developmental stages of somatic embryo development (globular and cotyledonary [Fig. 1B]) were collected during plant regeneration and tested for mPing excision. Figure 2B shows that at the globular stage, seven out of 10 lines have a single 778-bp band, indicating that mPing is still in its original position. However, three transgenic events (2-9, 3-3, and 2-24) produced additional 345-bp bands that reflect mPing transposition from the pPing construct. At the later cotyledonary stage, eight of the 10 lines have the 345-bp band, indicating an increased capacity for mPing excision later in embryo development (Fig. 2B). In addition, cotyledonary-stage somatic embryos from two transgenic events show no PCR products with these primers (Fig. 2B, events 2-9, 2-24). This could be due to, among other possibilities, the loss of one or both primer binding sites following mPing excision.
Figure 2.
PCR analysis of pPing-containing soybean lines. A, Diagram showing the position of the primers used to detect mPing excision (Flank For and Rev) and the presence of mPing (mPing 5′ and 3′). B, PCR products from two embryo development stages and leaf tissue from germinated plants (C). D, PCR results with primers to part of the gfp gene for globular-stage embryos (G) and leaf tissue for selected events. Controls with (+) and without (−) mPing show the expected band sizes (778 and 345 bp). NEG, Untransformed control; M, 100-bp DNA ladder.
At least three plants were regenerated from tissue culture for each event and assigned a letter (e.g. event 3-3 plant A). Most regenerated plants tested for mPing excision by PCR had a single 778-bp product (Fig. 2C). However, two out of three plants produced from event 2-9 lacked the 778-bp band, but had a smaller band (295 and 399 bp). The absence of the larger band indicates that mPing excised from the reporter in all of the embryogenic cells from which the plant was derived. Five other plants (two from event 2-11 and three from event 2-10) produced a PCR product with terminal mPing primers but no product with mPing flanking primers (Fig. 2C). Follow-up PCR using primers to gfp shows that event 2-10 initially had this region, but it was lost during generation of plants (Fig. 2D). These data suggest that a mutation occurred in the mPing reporter, probably due to excision events that removed flanking sequences. These results also show that in all cases where mPing excised from the reporter, it was not lost from the genome, but instead, had inserted in a new location.
Sequencing the lower bands resulting from PCR with primers flanking the mPing element allowed for analysis of excision sites. Precise excision was detected from both repetitive globular and cotyledonary-stage somatic embryos (Supplemental Fig. S2). However, 30% (7/23) of the excision events resulted in small deletions (7–32 bp). The excision sites analyzed in plants 2-9 B and 2-9 C showed a deletion and an insertion, respectively (Supplemental Fig. S2). The prevalence of deletions at the excision site, leading to the loss of sequences flanking the mPing excision site, is consistent with the lack of PCR products for some events in Figure 2, B and C.
GFP Expression
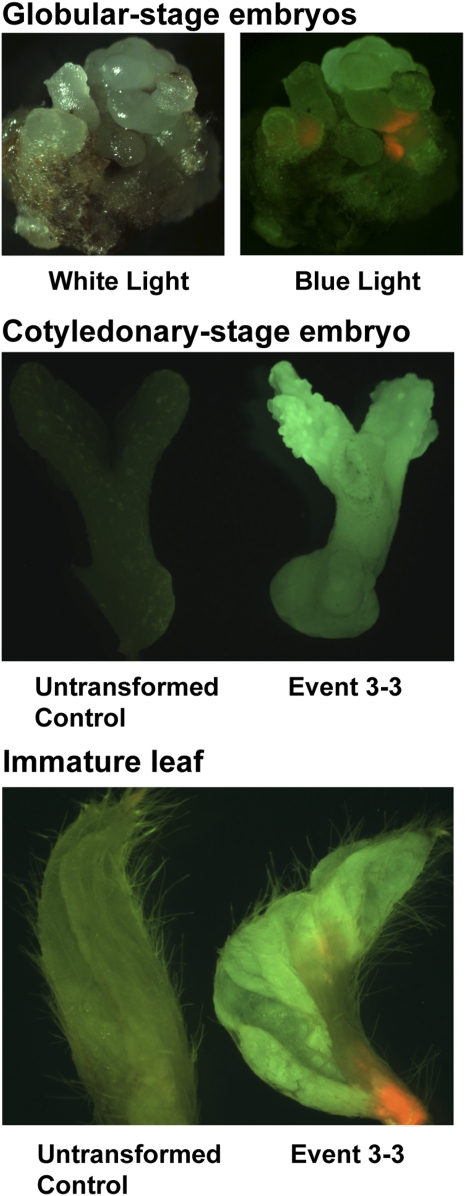
The pPing construct is designed to express gfp upon excision of mPing. Screening the transgenic soybean lines at both the globular and cotyledonary stage for GFP fluorescence identified a single event (3-3) with detectable levels of gfp expression (Fig. 3). The lack of detectable fluorescence in the other lines shown to have mPing excision could result from a number of factors including transposition in a limited number of cells, disruption of the construct during biolistic transformation, and disruption of the construct after mPing excision. The use of PCR to test if the entire mPing reporter was present at the globular stage indicated that only four of the events had the complete reporter, including the promoter and terminator (Supplemental Fig. S3). Of these four, event 3-3 was the only one to show GFP fluorescence (Fig. 3). Consistent with the PCR results, event 3-3 showed fluorescence in both the globular- and cotyledonary-stage embryo. In fact, when an event 3-3-derived plant was tested for gfp expression, one out of five meristems showed fluorescence, indicating that transposition occurred in one branch of this plant during its growth (Fig. 3, gfp expressing leaf shown).
Figure 3.
Images of GFP expression detected in event 3-3 herbicide-bleached tissue. The globular-stage example contains both normal and GFP-expressing tissue, while the cotyledonary stage and immature leaf have untransformed controls for comparison.
mPing Insertion
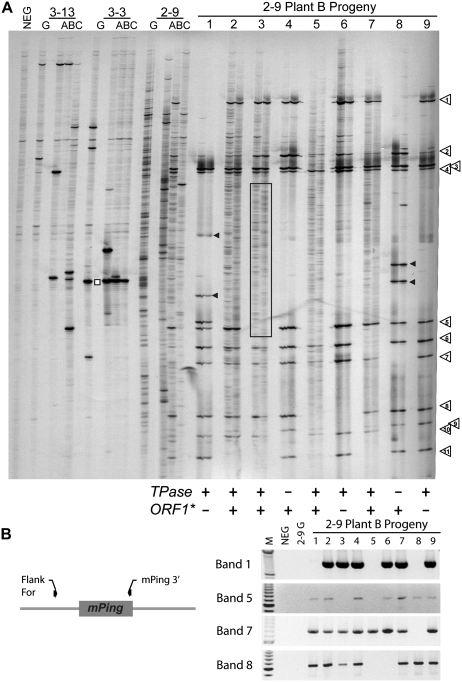
Insertions of mPing in the genome can be detected by transposon display, a variation of the amplified fragment length polymorphism technique (Van den Broeck et al., 1998) whereby each insertion results in a band on a polyacrylamide gel (Jiang et al., 2003). Plants produced from nine independently derived pPing events were tested for mPing transposition (Fig. 4A, data for three events shown). Eight of the nine events showed few if any strong unique bands that would indicate transposition. For example, tissue obtained from globular-stage embryos and plants derived from event 3-13 and 3-3 show one to three strong bands per sample. In contrast, event 2-9 shows a continuum of bands at the globular stage, and a unique pattern for all three plants tested (Fig. 4A). Because these plants were derived from a single cell line, this pattern indicates that mPing was active during embryo development or subsequent growth of the plants.
Figure 4.
T0 and T1 progeny analysis. A, Transposon display results for the repetitive globular-stage (G) and three plants (A, B, C) regenerated from the 3-13, 3-3, and 2-9 transgenic events. Samples 1 thorough 9 are the T1 progeny produced by selfing plant 2-9 B (the two lanes for each plant are from DNA isolated from two leaves). Numbered arrows indicate insertions that were present in the 2-9 B plant and inherited by subsequent progeny. The white square indicates a band that results from a nonmobilized mPing-containing transgene fragment. Black arrowheads indicate plant-specific insertions. Boxed region indicates examples of somatic insertion patterns that are specific to one or the other leaf. The presence of the TPase and ORF1* transgenes in each plant are shown below the transposon display gel (see Supplemental Fig. S5). B, PCR analysis of 2-9 B progeny plants using primers that detect the presence of the mPing insertions identified by transposon display. Band numbers correspond to the numbered arrows above. M, 100-bp ladder; NEG, untransformed control.
Figure 4A (right side) also shows the transposon display results for the 2-9 B T1 progeny, with two separate leaves tested from each plant (first and third trifoliolate leaves in adjacent lanes) to allow for differentiation between localized and widespread insertions. Eleven of the darker bands present in the 2-9 B parent were inherited by the progeny in Mendelian fashion (numbered arrows). In addition, 2-9 B T1 plants 1 and 8 show strong additional bands (black arrowheads) that were not observed in the 2-9 B parent. These unique insertions are present in the two leaves tested from each plant, indicating the mPing insertions occurred before the initiation of both leaves. These insertions must have occurred in the parental tissues that gave rise to the gametes, because these plants did not inherit both ORF1 and TPase. In contrast, progeny numbers 2, 3, 5, and 7 have both ORF1 and TPase, and show a large number of relatively weak bands that in most cases are specific to just one leaf (Fig. 4A, boxed region highlights an example). The characteristics of these bands are consistent with localized sectors derived from somatic mPing transposition in the leaves. A similar transposon display was performed for the progeny of plant 3-3 A, showing a single heritable insertion was produced by this plant (Supplemental Fig. S4).
Cloning and sequencing 79 transposon display bands verified that most are the expected mPing terminal and adjacent soybean sequence (Supplemental Table S1). Only one was found to result from mispriming to the soybean genome, and two were composed of concatamers of primers. Six of the nine soybean events did not have a transposon display band resulting from pPing because there are no MseI sites close enough to the mPing element in the construct. However, because the pPing vector disintegrated into several sections during transformation, three events showed strong ubiquitous bands that correspond to an untransposed mPing element adjacent to MseI sites in the soybean genome (see white square in Fig. 4A event 3-3). These are easily distinguished from true transposition events by the presence of vector DNA flanking mPing. Sequencing of three faint background bands present in the negative control indicated that they result from primer concatenation during the amplification steps (i.e. fusion of the mPing-specific primer to the adapter primer or genomic fragment).
To provide additional evidence for reliability of the transposon display, five mPing insertions identified in Figure 4A were verified by PCR with primers designed to flank the genomic location of the insertion (Fig. 4B; Supplemental Table S2). For example, the sequence of band 1 was used to determine the genomic location of the mPing insertion, allowing for a primer to be designed that is specific to a region beyond the sequence obtained by transposon display. As expected, PCR with this primer and an mPing-specific primer shows the same pattern as observed for transposon display (Fig. 4, A and B). Similarly, primers flanking both sides of the heritable mPing insertion site from plant 3-3 A produced a larger (with mPing) and smaller band (without mPing) that segregated in the 3-3 A progeny (Supplemental Fig. S4B), confirming the reliability of transposon display and indicating whether the insertion was present in one or both copies of the chromosome.
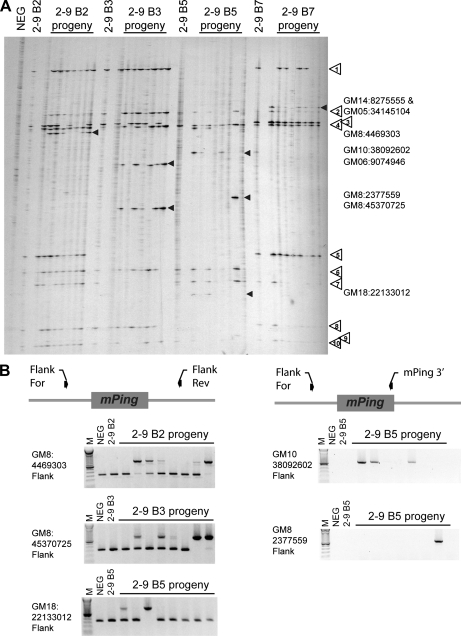
To determine if mPing activity continues in the next generation, transposon display was performed on 2-9 B T2 plants that contained both the Ping ORF1 and TPase genes (Fig. 5A). The progeny from each of the four parents show novel bands that are shared between multiple siblings, indicating mPing insertions that occurred in the T1 parent plants after our sampling of the initial leaves. In addition, there is a strong band present in one of the 2-9 B5 progeny, suggesting that an insertion occurred either relatively late in the T1 parent or early in the development of the T2 plant. A subset of the insertions novel to the T2 generation was tested by PCR and shown to be consistent with the transposon display pattern (Fig. 5B). Overall, the observed insertions show that mPing transposition activity continues during plant growth and produces at least one new germinal insertion per generation.
Figure 5.
T2 progeny analysis. A, Transposon display of T2 progeny from 2-9 B T1 plants with both the ORF1 and TPase transgenes. Numbered arrows correspond to the bands present in the previous generation (Fig. 4). Black arrowheads denote novel insertions and their genomic locations are indicated on the right. B, PCR verification of a subset of the novel mPing insertions. M, 100-bp ladder; NEG, untransformed control.
Transgene Analysis
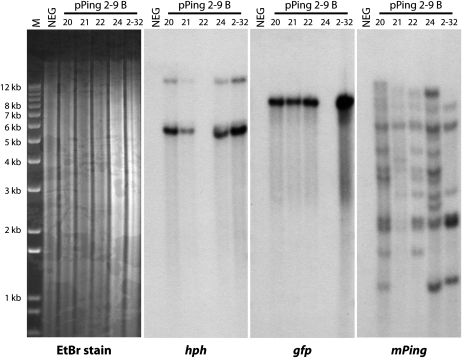
The two lines with verified heritable insertions (2-9 and 3-3) were characterized further to determine the number of copies of the original transgene. PCR analysis of plant 3-3 A T1 progeny (Supplemental Fig. S6 and additional samples) showed that the ORF1 and TPase genes show different segregation patterns. However, the inheritance of these genes is not consistent with two unlinked loci (n = 28, χ2 = 11.6, 3 degrees of freedom [d.f.], P = 0.009), suggesting that there are multiple copies of at least one of the transgenes. In contrast, the segregation of the ORF1 and TPase genes in the 2-9 B T1 progeny is consistent with two unlinked loci (n = 24, χ2 = 2.1, 3 d.f., P = 0.55; Supplemental Fig. S5 and additional samples). Southern-blot analysis of 2-9 B progeny (Fig. 6) shows that the hph probe hybridizes with two genomic fragments (approximately 6,000 and 14,000 bp) and the gfp probe hybridizes with a single approximately 8,000-bp band with a different segregation pattern than that of hph. Together these data show that for event 2-9, pPing broke into at least two pieces, which inserted as separate loci (one with the mPing donor site and TPase gene, the other harboring the hph and ORF1 genes). In contrast to the single-copy transgene, hybridization with an mPing probe produced seven to 12 bands for each plant, implying both transposition and increase in copy number.
Figure 6.
Southern-blot analysis of event 2-9 B progeny. Three identical sets of DNA (20-22, 24 are T1 generation, 2-32 is a T2 plant that is homozygous for both hph and Ping TPase) were probed with DNA from three separate regions of the pPing plasmid. NEG, Untransformed control; M, 1Kb+ DNA ladder.
Insertion Site Analysis
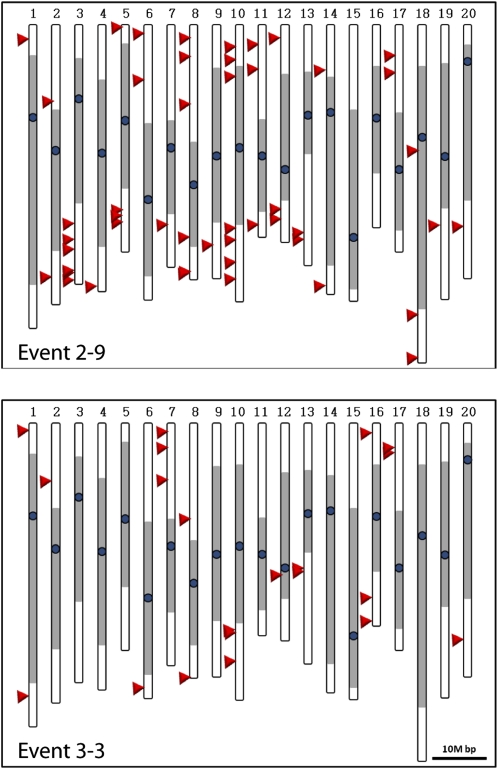
To determine the insertion pattern of mPing in soybean, the location of the mPing insertions were determined based on the flanking sequences obtained from transposon display. Four transposon display bands could not be definitively placed on the published soybean sequence, suggesting they were located in unsequenced or repetitive regions. The remaining 72 mPing insertions from embryo and plants (both germinal and somatic events) were located at unique sites in the soybean genome (Supplemental Table S1). Forty eight of these sites were from the T0, T1, and T2 plants generated from event 2-9. These insertions are on 18 of the 20 soybean chromosomes, with only three in the annotated pericentromeric region (Fig. 7). Similarly, 21 insertion sites from plant 3-3 A were mapped to 10 chromosomes with only one pericentromeric insertion.
Figure 7.
mPing insertion sites: Location of mPing insertion sites (arrowheads) in the soybean genome identified from both globular-stage embryos and leaf tissue for two transgenic lines (event 2-9 and 3-3). Gray = pericentromeric regions, dark circle = centromere. [See online article for color version of this figure.]
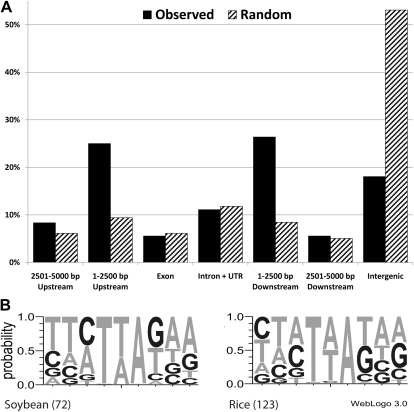
The sequences flanking the mPing insertions were used to create a pictogram indicating frequency of each base at the insertion site (Fig. 8B). To further characterize the insertion preference, the observed insertion locations were categorized according to their insertion site (i.e. exon, intron, untranslated region [UTR], intergenic; Fig. 8A). These results were compared to a representation of the actual genome composition, created by producing 100,000 simulated random insertions into the soybean genome. Eighty-four percent of the mPing insertions are within 5 kb of a predicted gene transcript, compared to an expected frequency of 47% if insertion sites were random. There is also a corresponding reduction in intergenic insertions (>5 kb from a gene) compared to the control (16.4% versus 53.1%). The distribution of the observed insertions is significantly different from the random insertion pattern (G test; G = 52.934, 6 d.f., P < 0.0001). The majority of this deviation is due to an overrepresentation of insertions within 2.5 kb up- or downstream of predicted transcripts (55.2% versus 17.9%).
Figure 8.
Insertion site analysis. A, Histogram comparing the observed mPing insertion frequency to randomly generated insertions in the soybean genome. B, Pictogram representing the frequency of each nucleotide at the mPing insertion sites in soybean and rice (Naito et al., 2006).
As indicated by our insertion preference, a number of insertions in genes were identified (Supplemental Table S1). The insertions that were identified in viable plant lines include exon insertions that may disrupt function of a 60S ribosomal gene and a gene of unknown function. In addition, intron and UTR insertions were identified in calmodulin binding, atpob1 homolog, homeobox, peroxidase, and unknown function genes. Insertions into regions that may contain promoter sequences (<1,000 bp upstream) were found for an additional seven genes (Supplemental Table S1).
DISCUSSION
The development of soybean into a model for legume-specific processes will require the development of improved gene discovery tools, such as transposon tagging. As mentioned, the transposon-tagging systems currently available for legumes, Ac/Ds and Tnt1, have characteristics that limit their widespread use for gene discovery. In contrast, mPing transposition in soybean does not exhibit these features. Transposition of mPing occurred under normal plant growth conditions over at least two generations (Figs. 4 and 5). Also, the mPing insertions emanating from the mPing reporter construct were not limited to linked sites (Fig. 7), consistent with the observation of unlinked transposition for somatic events in Arabidopsis (Yang et al., 2007). These features make it possible to saturate the genome with insertions by simply growing a population of plants with mPing activity, a relatively easy process compared to the tissue culture required for Tnt1 transposition or the transformation and crossing used for Ac/Ds mutagenesis. The relative ease with which mutants can be generated allows the efforts to be focused on mutant analysis.
The ability to produce germinal transposition events is required for tagging because it allows for subsequent genetic analysis of mutants. To our knowledge, this study is the first to verify that mPing produces heritable insertions in a species other than rice (Figs. 4 and 5). When different embryo developmental stages (Fig. 2) were characterized for transposition, more activity was observed in the cotyledonary stage (8/10 versus 3/10 at globular stage), suggesting that transposition may occur preferentially in some developmental stages. If so, understanding the developmental regulation may indicate ways to control transposition. In the mean time, this study showed that there is no transposition in progeny where the genes encoding Ping proteins are removed by segregation. This is evident in Figure 4 for the progeny of 2-9 B that lack either of the Ping proteins. The ability to effectively freeze mPing insertions in the genome will simplify the genetic analysis of mPing insertion mutants.
The locations of mPing insertions in soybean (Fig. 8) have similarities with the insertions observed in rice (Naito et al., 2009). These include a reduced preference for intergenic regions and a preference for insertion into gene-rich regions. The mechanisms underlying these patterns are unknown; however one possibility is that mPing preferentially inserts into open chromatin as has been hypothesized for other elements (Kuromori et al., 2004; Liu et al., 2009). Chromatin compactness is directly related to the frequency of nucleosomes, the basic unit of DNA packing around histone proteins. Exons show higher nucleosome density than introns (i.e. Arabidopsis [Chodavarapu et al., 2010)], Caenorhabditis elegans [Valouev et al., 2008], and humans [Schones et al., 2008]). In rice, mPing exhibits an exon avoidance mechanism, reducing the exon insertion rate to 14% of that expected for random insertion, while insertion into introns is 51% of expected (Naito et al., 2009). This insertion pattern is consistent with the hypothesis that chromatin structure affects mPing insertion. However, another key difference between rice introns and exons is the average G/C content of only 37% for introns compared to 51% for exons (Yu et al., 2002). Accordingly, analysis of the mPing flanking sequences shows a preference for insertion into T/A-rich regions (Fig. 8B; Naito et al., 2006; Yang et al., 2007; Hancock et al., 2010). If the preference for insertion into T/A-rich sequences is involved in exon avoidance, a greater number of insertions into exons is expected in genomes like soybean that have exons with lower G/C content than rice (43% versus 51%, respectively; Yu et al., 2002; Tian et al., 2004). In fact, comparing our sampling of soybean insertions to the expected number under the random insertion model shows no significant exon avoidance (χ2 = 0.002, d.f. = 1, P > 0.9), unlike in rice where the exon avoidance is highly significant (χ2 = 81.2, d.f. = 1, P < 0.0001; Naito et al., 2009).
The observed rate of mPing insertions into genes normalized to gene density is comparable to the normalized genic insertion rates of other commonly used transposon-tagging tools (Supplemental Table S3; Tissier et al., 1999; Courtial et al., 2001; d’Erfurth et al., 2003; Kuromori et al., 2004; Tadege et al., 2008). However, the characteristic that gives mPing an advantage is its preference for insertion near genes (51.4% of insertions are within 2.5 kb; Fig. 8A). This preference is ideal for activation tagging, which up-regulates expression by placing enhancer sequences in close proximity. An mPing-based activation tag should be particularly advantageous for determining the gene function in species like soybean, which has a high degree of genome duplication. While its ability to be modified to serve as an activation tag still remains to be investigated, there is no a priori reason why it should not work, as has been achieved with the Ds element (Qu et al., 2008). If successfully developed into an activation tag, then mPing will be an incomparable resource for transposon mutagenesis for crop genomics.
CONCLUSION
The mPing miniature inverted repeat transposable element produces heritable insertions in soybean over multiple generations. It retains the transposition characteristics that are favorable for transposon tagging. These advantages include the ability to produce unlinked insertions without tissue culture and the strong preference for insertion in and near genes. Thus, mPing appears to overcome most of the limitations that impede other transposon-tagging systems in place today and will facilitate gene identification in soybean.
MATERIALS AND METHODS
Vector Construction and Transformation
The pPing vector was constructed by subcloning the HindIII-SacI fragment from the pICDS-mP plasmid (Yang et al., 2007) into a SacI site that precedes a nos terminator in the pUHN4 vector (includes a StUbi3 promoter: hph gene: nos terminator selectable marker; Joshi et al., 2005). Somatic embryos from soybean (Glycine max) cultivar Jack (Nickell et al., 1990) were prepared and transformed as described by Trick et al. (1997), with modifications. Three plates of repetitive globular-stage embryos were bombarded at 7,584 kPa (1,100 ψ) with 42 ng of plasmid DNA precipitated on 0.55 mg of 0.6-μm diameter Au. Transgenic lines were selected using FNL medium (Samoylov et al., 1998) supplemented with 20 μg mL−1 hygromycin-B. Selected lines were given an event number (shot number-event number) and their transgenic status verified by PCR before plant regeneration. Cotyledonary-stage embryos were produced in SHaM medium (Schmidt et al., 2005), desiccated for 1 week, and germinated on MSO medium as described by Parrott et al. (1988).
PCR Analysis
Genomic DNA was purified using the C-TAB method (Murray and Thompson, 1980), quantitated with the fluorescent DNA quantitation kit (Bio-Rad), and diluted to 5 ng μL−1. GO Taq polymerase (Promega) was used for PCR genotyping (10 ng genomic DNA per reaction). The DNA of all samples was tested for quality by ensuring it was possible to amplify the soybean lectin gene (Le1; Goldberg et al., 1983). See Supplemental Table S2 for primer sequences. The 100-bp DNA ladder was from Invitrogen. Excision site analysis was performed by gel purifying the excision site amplicon and cloning into the pGEM t-Easy vector (Promega) for sequencing.
Southern-Blot Analysis
Ten micrograms of RNase-A-treated genomic DNA were digested with HindIII (cuts once in the pPing plasmid) and separated on a 0.8% agarose TAE gel together with a 1Kb+ DNA ladder (Invitrogen). DNA was transferred by capillary action to a ζ-Probe GT nylon membrane (Bio-Rad) according to the manufacturer’s instructions and UV cross-linked. Probes were made using the following primers: mPing: mPing 5′ and mPing 3′, gfp: GFP Check For and Nost Rev, hph: UbiqF and Hyg938R (Supplemental Table S2). After 5 h of prehybridization (1 mm EDTA, pH 8.0; 0.5 m Na2HPO4; 7% SDS; 1% bovine serum albumin) at 65°C, hybridization with approximately 25 ng of 32P-labeled probe made with the RediPrime II random prime labeling system (GE Healthcare) and purified using Micro Bio-Spin 6 chromatography columns (Bio-Rad) was performed overnight. The membranes were washed with 5% and 1% SDS in 40 mm Na2HPO4 at 65°C prior to autoradiography.
GFP Microscopy
Cotyledonary and repetitive globular-stage embryos were bleached using 10 mg L−1 isoxaflutol (Sigma cat. no. 46437) as described by Wu et al. (2008) to eliminate autofluoresence from chlorophyll. Images were acquired using a HQ 470/40 excitation filter and 515 LP emission filters.
Transposon Display
Transposon display was performed as described by Van den Broeck et al. (1998). Two-hundred nanograms of genomic DNA were digested in a 50-μL reaction with MseI or BfaI and ligated to an adapter oligo (TD AdapterF: GACGATGAGTCCTGAG, TD AdapterR: TACTCAGGACTCAT). In most cases, MseI was used for digestion because it does not allow amplification of the original transgene due to the lack of a restriction site near the 5′ end of mPing in the pPing construct. After a 1:4 dilution with water, 1.5 μL of the reaction were used for a 20-μL PCR reaction (Amplitaq, Applied Biosystems) using mPing P5: AAATGTGCATGACACACCAG and adapter primer: GACGATGAGTCCTGAGTA. Then 1.5 μL (diluted 1:100 or 1:1,000 with water) were used for a second round of PCR with the adapter primer and 33P-radiolabeled mPing P6 primer: GTGAAACCCCCATTGTGACTGG. The reaction was analyzed by electrophoresis on a 6% polyacrylamide gel and autoradiography. To reduce the background for the figures, the primary amplification was performed with a 5′ biotinylated mPing P5 primer and the resulting PCR products were purified using Dynabeads M-270 Streptavidin (Invitrogen) according to the manufacturer’s recommendations. Bands of interest were rehydrated, excised from the gel, reamplified using the mPing P6 and adapter primers, and cloned in to the pGEM t-Easy vector (Promega) for sequencing.
Mapping/Computational Analysis
Insertions were mapped by using BLAST to align the flanking sequence with the Glyma 1 chromosome-scale assembly of the soybean genome (http://www.phytozome.net/soybean). The target site preference was generated using WebLogo 3 at http://weblogo.threeplusone.com/ (Crooks et al., 2004). The random insertion set was produced by randomly generating 100,000 coordinates across the 20 chromosomes. Information on the surrounding sequence was parsed using the Glyma1_highConfidence.gff2.gz (5/27/09) file downloaded from the Phytozome Web site (http://www.phytozome.net/soybean). If the coordinate was within an annotated gene (feature type mRNA), it was further categorized as being in the 5′ or 3′ UTR, or an exon (CDS). If it fell within an mRNA region, but not UTR or exon, the insertion was scored as an intron. If the coordinate was not within a gene, the distance to the nearest mRNA was recorded. Coordinates >5 kb from a gene were recorded as intergenic. Statistical comparison between the observed number and expected was conducted with a G test (Skola and Rohlf, 1995), using the following categories: intergenic 1 to 2,500 bp upstream, 2,501 to 5,000 bp upstream, 1 to 2,500 downstream, 2,501 to 5,000 bp downstream, exon, and intron + UTR. The G score was compared to the χ2 distribution with 6 d.f.
Sequence data from this article can be found in the GenBank/EMBL data libraries under accession numbers ▪▪▪.
Supplemental Data
The following materials are available in the online version of this article.
Supplemental Figure S1. Diagram of the pPing plasmid.
Supplemental Figure S2. Excision site analysis.
Supplemental Figure S3. PCR detection of the mPing gfp reporter.
Supplemental Figure S4. Insertion analysis of event 3-3 A progeny.
Supplemental Figure S5. PCR analysis of the event 2-9 B progeny.
Supplemental Figure S6. PCR analysis of the event 3-3 A progeny.
Supplemental Table S1. mPing insertion sites.
Supplemental Table S2. Primer sequences.
Supplemental Table S3. Genic insertion rates for various transposons.
Acknowledgments
We appreciate Ken Naito’s (National Institute of Agrobiological Sciences, Japan) advice on transposon display. We would like to thank University of Georgia undergraduates Sarah Lipkin, Justin Brown, and Charles Allen for assistance with DNA purification and routine PCR. John Finer from The Ohio State University gave advice for herbicide bleaching the soybean tissue. We also appreciate the feedback from the other members of the National Science Foundation soybean mutagenesis project.
References
- Bancroft I, Dean C. (1993) Transposition pattern of the maize element Ds in Arabidopsis thaliana. Genetics 134: 1221–1229 [DOI] [PMC free article] [PubMed] [Google Scholar]
- Chodavarapu RK, Feng SH, Bernatavichute YV, Chen PY, Stroud H, Yu YC, Hetzel JA, Kuo F, Kim J, Cokus SJ, et al. (2010) Relationship between nucleosome positioning and DNA methylation. Nature 466: 388–392 [DOI] [PMC free article] [PubMed] [Google Scholar]
- Courtial B, Feuerbach F, Eberhard S, Rohmer L, Chiapello H, Camilleri C, Lucas H. (2001) Tnt1 transposition events are induced by in vitro transformation of Arabidopsis thaliana, and transposed copies integrate into genes. Mol Genet Genomics 265: 32–42 [DOI] [PubMed] [Google Scholar]
- Crooks GE, Hon G, Chandonia JM, Brenner SE. (2004) WebLogo: a sequence logo generator. Genome Res 14: 1188–1190 [DOI] [PMC free article] [PubMed] [Google Scholar]
- d’Erfurth I, Cosson V, Eschstruth A, Lucas H, Kondorosi A, Ratet P. (2003) Efficient transposition of the Tnt1 tobacco retrotransposon in the model legume Medicago truncatula. Plant J 34: 95–106 [DOI] [PubMed] [Google Scholar]
- Dooner HK, Belachew A. (1989) Transposition pattern of the maize element Ac from the Bz-M2(Ac) allele. Genetics 122: 447–457 [DOI] [PMC free article] [PubMed] [Google Scholar]
- Goldberg RB, Hoschek G, Vodkin LO. (1983) An insertion sequence blocks the expression of a soybean lectin gene. Cell 33: 465–475 [DOI] [PubMed] [Google Scholar]
- Hancock CN, Zhang F, Wessler SR. (2010) Transposition of the Tourist-MITE mPing in yeast: an assay that retains key features of catalysis by the class 2 PIF/Harbinger superfamily. Mob DNA 1: 5. [DOI] [PMC free article] [PubMed] [Google Scholar]
- Jiang N, Bao ZR, Zhang XY, Hirochika H, Eddy SR, McCouch SR, Wessler SR. (2003) An active DNA transposon family in rice. Nature 421: 163–167 [DOI] [PubMed] [Google Scholar]
- Jones JDG, Carland F, Lim E, Ralston E, Dooner HK. (1990) Preferential transposition of the maize element Activator to linked chromosomal locations in tobacco. Plant Cell 2: 701–707 [DOI] [PMC free article] [PubMed] [Google Scholar]
- Joshi M, Niu C, Fleming G, Hazra S, Chu Y, Nairn CJ, Yang HY, Ozias-Akins P. (2005) Use of green fluorescent protein as a non-destructive marker for peanut genetic transformation. In Vitro Cell Dev Biol Plant 41: 437–445 [Google Scholar]
- Kaeppler SM, Phillips RL. (1993) DNA methylation and tissue culture-induced variation in plants. In Vitro Cell Dev Biol Plant 29P: 125–130 [Google Scholar]
- Kikuchi K, Terauchi K, Wada M, Hirano HY. (2003) The plant MITE mPing is mobilized in anther culture. Nature 421: 167–170 [DOI] [PubMed] [Google Scholar]
- Kuromori T, Hirayama T, Kiyosue Y, Takabe H, Mizukado S, Sakurai T, Akiyama K, Kamiya A, Ito T, Shinozaki K. (2004) A collection of 11 800 single-copy Ds transposon insertion lines in Arabidopsis. Plant J 37: 897–905 [DOI] [PubMed] [Google Scholar]
- Libault M, Farmer A, Joshi T, Takahashi K, Langley RJ, Franklin LD, He J, Xu D, May G, Stacey G. (2010) An integrated transcriptome atlas of the crop model Glycine max, and its use in comparative analyses in plants. Plant J 63: 86–99 [DOI] [PubMed] [Google Scholar]
- Liu SZ, Yeh CT, Ji TM, Ying K, Wu HY, Tang HM, Fu Y, Nettleton D, Schnable PS. (2009) Mu transposon insertion sites and meiotic recombination events co-localize with epigenetic marks for open chromatin across the maize genome. PLoS Genet 5: e1000733. [DOI] [PMC free article] [PubMed] [Google Scholar]
- Mathieu M, Winters EK, Kong FM, Wan JR, Wang SX, Eckert H, Luth D, Paz M, Donovan C, Zhang ZY, et al. (2009) Establishment of a soybean (Glycine max Merr. L) transposon-based mutagenesis repository. Planta 229: 279–289 [DOI] [PubMed] [Google Scholar]
- Murray MG, Thompson WF. (1980) Rapid isolation of high molecular weight plant DNA. Nucleic Acids Res 8: 4321–4325 [DOI] [PMC free article] [PubMed] [Google Scholar]
- Muskett PR, Clissold L, Marocco A, Springer PS, Martienssen R, Dean C. (2003) A resource of mapped dissociation launch pads for targeted insertional mutagenesis in the Arabidopsis genome. Plant Physiol 132: 506–516 [DOI] [PMC free article] [PubMed] [Google Scholar]
- Naito K, Cho E, Yang GJ, Campbell MA, Yano K, Okumoto Y, Tanisaka T, Wessler SR. (2006) Dramatic amplification of a rice transposable element during recent domestication. Proc Natl Acad Sci USA 103: 17620–17625 [DOI] [PMC free article] [PubMed] [Google Scholar]
- Naito K, Zhang F, Tsukiyama T, Saito H, Hancock CN, Richardson AO, Okumoto Y, Tanisaka T, Wessler SR. (2009) Unexpected consequences of a sudden and massive transposon amplification on rice gene expression. Nature 461: 1130–1134 [DOI] [PubMed] [Google Scholar]
- Nakazaki T, Okumoto Y, Horibata A, Yamahira S, Teraishi M, Nishida H, Inoue H, Tanisaka T. (2003) Mobilization of a transposon in the rice genome. Nature 421: 170–172 [DOI] [PubMed] [Google Scholar]
- Nickell CD, Noel GR, Thomas DJ, Waller R. (1990) Registration of ‘Jack’ soybean. Crop Sci 30: 1365 [Google Scholar]
- Nishal B, Tantikanjana T, Sundaresan V. (2005) An inducible targeted tagging system for localized saturation mutagenesis in Arabidopsis. Plant Physiol 137: 3–12 [DOI] [PMC free article] [PubMed] [Google Scholar]
- Parrott WA, Dryden G, Vogt S, Hildebrand DF, Collins GB, Williams EG. (1988) Optimization of somatic embryogenesis and embryo germination in soybean. In Vitro Cell Dev Biol 24: 817–820 [Google Scholar]
- Qu S, Desai A, Wing R, Sundaresan V. (2008) A versatile transposon-based activation tag vector system for functional genomics in cereals and other monocot plants. Plant Physiol 146: 189–199 [DOI] [PMC free article] [PubMed] [Google Scholar]
- Samoylov VM, Tucker DM, Parrott WA. (1998) Soybean [Glycine max (L). Merrill] embryogenic cultures: the role of sucrose and total nitrogen content on proliferation. In Vitro Cell Dev Biol Plant 34: 8–13 [Google Scholar]
- Schmidt MA, Tucker DM, Cahoon EB, Parrott WA. (2005) Towards normalization of soybean somatic embryo maturation. Plant Cell Rep 24: 383–391 [DOI] [PubMed] [Google Scholar]
- Schmutz J, Cannon SB, Schlueter J, Ma JX, Mitros T, Nelson W, Hyten DL, Song QJ, Thelen JJ, Cheng JL, et al. (2010) Genome sequence of the palaeopolyploid soybean. Nature 463: 178–183 [DOI] [PubMed] [Google Scholar]
- Schones DE, Cui KR, Cuddapah S, Roh TY, Barski A, Wang ZB, Wei G, Zhao KJ. (2008) Dynamic regulation of nucleosome positioning in the human genome. Cell 132: 887–898 [DOI] [PMC free article] [PubMed] [Google Scholar]
- Singh G, Shivakumar BG. (2010) The role of soybean in agriculture. Singh B, , The Soybean: Botany, Production and Uses. CAB International, Oxfordshire, UK, pp 24–47 [Google Scholar]
- Skola RR, Rohlf FJ. (1995) Biometry: The Principles and Practice of Statistics in Biological Research, Ed 3. W.H. Freeman and Co, New York [Google Scholar]
- Tadege M, Wen JQ, He J, Tu HD, Kwak Y, Eschstruth A, Cayrel A, Endre G, Zhao PX, Chabaud M, et al. (2008) Large-scale insertional mutagenesis using the Tnt1 retrotransposon in the model legume Medicago truncatula. Plant J 54: 335–347 [DOI] [PubMed] [Google Scholar]
- Tian AG, Wang J, Cui P, Han YJ, Xu H, Cong LJ, Huang XG, Wang XL, Jiao YZ, Wang BJ, et al. (2004) Characterization of soybean genomic features by analysis of its expressed sequence tags. Theor Appl Genet 108: 903–913 [DOI] [PubMed] [Google Scholar]
- Tissier AF, Marillonnet S, Klimyuk V, Patel K, Torres MA, Murphy G, Jones JDG. (1999) Multiple independent defective suppressor-mutator transposon insertions in Arabidopsis: a tool for functional genomics. Plant Cell 11: 1841–1852 [DOI] [PMC free article] [PubMed] [Google Scholar]
- Trick HN, Dinkins RD, Santarem ER, Di R, Samoylov V, Meurer C, Walker D, Parrott WA, Finer JJ, Collins GB. (1997) Recent advances in soybean transformation. Plant Tissue Culture and Biotechnology 3: 9–26 [Google Scholar]
- Valouev A, Ichikawa J, Tonthat T, Stuart J, Ranade S, Peckham H, Zeng K, Malek JA, Costa G, McKernan K, et al. (2008) A high-resolution, nucleosome position map of C. elegans reveals a lack of universal sequence-dictated positioning. Genome Res 18: 1051–1063 [DOI] [PMC free article] [PubMed] [Google Scholar]
- Van den Broeck D, Maes T, Sauer M, Zethof J, De Keukeleire P, D’hauw M, Van Montagu M, Gerats T. (1998) Transposon display identifies individual transposable elements in high copy number lines. Plant J 13: 121–129 [DOI] [PubMed] [Google Scholar]
- Wu CL, Chiera JM, Ling PP, Finer JJ. (2008) Isoxaflutole treatment leads to reversible tissue bleaching and allows for more effective detection of GFP in transgenic soybean tissues. In Vitro Cell Dev Biol Plant 44: 540–547 [Google Scholar]
- Yang GJ, Zhang F, Hancock CN, Wessler SR. (2007) Transposition of the rice miniature inverted repeat transposable element mPing in Arabidopsis thaliana. Proc Natl Acad Sci USA 104: 10962–10967 [DOI] [PMC free article] [PubMed] [Google Scholar]
- Yu J, Hu SN, Wang J, Wong GKS, Li SG, Liu B, Deng YJ, Dai L, Zhou Y, Zhang XQ, et al. (2002) A draft sequence of the rice genome (Oryza sativa L. ssp. indica). Science 296: 79–92 [DOI] [PubMed] [Google Scholar]


