Abstract
Background:
Episodes of hyperglycemia are considered to be a secondary insult in traumatically brain-injured patients and have been shown to be associated with impaired outcome. Intensive insulin therapy to maintain a strict glucose level has been suggested to decrease morbidity and mortality in critically ill patients but this aggressive insulin treatment has been challenged. One aspect of strict glucose control is the risk of developing hypoglycemia. Extracellular intracerebral hypoglycemia monitored by intracerebral microdialysis has been shown to correlate with poor outcome. Monitoring of blood glucose during neurointensive care is important because adequate glucose supply from the systemic circulation is crucial to maintain the brain's glucose demand after brain injury. This study investigates the correlation of glucose levels in peripheral blood, subcutaneous (SC) fat, and extracellular intracerebral tissue in patients with severe traumatic brain injury during neurointensive care.
Methods:
In this study, we included 12 patients with severe traumatic brain injury. All patients received one microdialysis catheter each, with a membrane length of 10 mm (CMA 70, CMA Microdialysis AB) in the injured hemisphere of the brain and in the noninjured hemisphere of the brain. An additional microdialysis catheter with a membrane length of 30 mm (CMA 60, CMA Microdialysis AB) was placed in the periumbilical subcutaneous adipose tissue. We studied the correlation among levels of glucose measured in peripheral blood, adipose tissue, and the noninjured hemisphere of the brain during the first 12 hours and during 3 consecutive days in neurointensive care.
Results:
We found a significant positive correlation between levels of glucose in peripheral blood, SC fat, and the noninjured brain during the initial 12 hours but not in injured brain. However, the result varied between the patients during the 3-day measurements. In 7 patients, there was a significant positive correlation between glucose in blood and noninjured brain, while in 4 patients this correlation was poor. In 4 patients, there was a significant positive correlation in injured brain and blood. Furthermore, there was a significant correlation between brain and adipose tissue glucose during the 3-day measurements in 11 out of 12 patients.
Conclusion:
This study indicates that there is a good correlation between blood glucose and adipose tissue during initial and later time points in the neurointensive care unit whereas the correlation between blood and brain seems to be more individualized among patients. This emphasizes the importance of using intracerebral microdialysis to ensure adequate intracerebral levels of glucose in patients suffering from severe traumatic brain injury and to detect hypoglycemia in the brain despite normal levels of blood glucose.
Keywords: human, hypoglycemia, microdialysis, traumatic brain injury
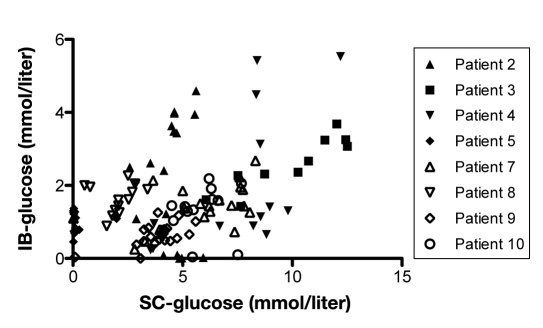
Background
The metabolic needs of the brain are almost entirely dependent on the oxidative metabolism of glucose, and the brain requires a constant supply of glucose and oxygen to be delivered through circulation. Glucose had been thought to be the only fuel for oxidative metabolism in active neurons, however, astrocyte-neuron lactate shuttle hypothesis (ANLSH) has challenged this view. According to the ANLSH, activity-induced uptake of glucose takes place predominantly in astrocytes, which produce lactate by anaerobic glycolysis. Lactate is then released from astrocytes and provides the primary fuel for neurons.1 This hypothesis is under debate and further investigation is needed.2,3 The microdialysis method also makes it possible to monitor lactate in vivo. Increased glucose demand, disturbed brain glucose metabolism, and energy failure are metabolic characteristics of severe traumatic brain injury (TBI).4–6 Episodes of hyperglycemia as well as hypoglyemia are considered to be secondary insults in patients with TBI and have been shown to be associated with impaired outcome following TBI as well as following multitrauma.7–12 Thus, monitoring of blood glucose during neurointensive care is of importance. Two landmark studies13,14 showed that tight glucose control in critically ill surgical patients, aiming for blood glucose in the range 4.4–6.1 mmol/liter, reduced mortality and morbidity, but the use of a tight glucose control has been challenged.15,16 Two studies suggested arterial glucose of 6–9 mmol/liter in patients with TBI for optimal brain metabolism but no relation to outcome was presented.17,18 In a further study, low intracerebral glucose measured by microdialysis was shown to correlate with poor outcome in patients with TBI.19 Thus, monitoring of the peripheral blood and brain glucose levels should be of great value and help to avoid or prevent episodes of hypo- or hyperglycemia. However, the optimal blood glucose range for maintaining the brain glucose requirement after TBI remains elusive.20
Microdialysis is used to monitor the metabolic state of almost any tissue and is a widely used technique for monitoring brain energy metabolism during neuro-intensive care.21–23 The most common metabolites measured are glucose, lactate, pyruvate, glycerol, and glutamate. The lactate/pyruvate (L/P) ratio is a known marker of the cellular redox state and represents alterations of mitochondrial function, where values above 25 are a good indicator of anaerobic metabolism and ischemia in the brain.4,19,24 Despite extensive use of microdialysis in neurointensive care and the importance of glucose levels in the blood and brain, little is known about the correlation of brain glucose values obtained by microdialysis and peripheral glucose during long periods of neurointensive care.
In this study, we used intracerebral microdialysis to investigate correlations among levels of glucose in peripheral blood, subcutaneous (SC) fat tissue, and intracerebral tissue in patients with severe TBI during neurointensive care.
Methods
This study included 12 patients (11 males and 1 female) with severe TBI. Values for noninjured brain (NIB) could be included for only 8 patients because of missing values that were related to human error and technical issues. Mean Glascow Coma Scale (GCS) at admission was 6 (minimum 3, maximum 9). The patients were admitted to the Department of Neurosurgery, Karolinska University Hospital Solna. Intracerebral microdialysis is performed as a routine monitoring in patients suffering from severe TBI and is approved by the local ethics committee of the Karolinska Hospital. All patients received intracranial pressure (ICP) monitoring and intracerebral microdialysis. The microdialysis probes were inserted in the border zones of injuries and in NIB tissue that was defined by the result obtained from computed tomography (CT) scan. Ten patients were subjected to hematoma evacuation while 2 patients only received monitor devices.
Excluded from the study were patients presenting bilateral, wide, nonreacting pupils and GCS 3 judged by the neurosurgeon on call to be beyond salvage, patients unconscious mainly due to drug or alcohol intoxication, and patients presenting terminal illness or for some other reason judged not to be possible for follow-up.
The temple was the zero-point for ICP and mean arterial blood pressure (MAP). All patients were treated in a 30° sitting position. Following surgery, the patients were treated at the neurointensive care unit (NICU). All patients were suffering from isolated TBI. None of the patients had a history of diabetes.
During ventilator treatment, all patients were sedated using midazolam and/or propofol together with infusion or intermittent administration of morphine. Intracranial hypertension was treated using intermittent cerebrospinal drainage, moderate hyperventilation, hyperosmolar solutions, and/or barbiturate coma aiming at an ICP <20 mm Hg. All patients completed at least one initial CT and a subsequent follow-up within the first 24 hours posttrauma. All patients were monitored on-line using a computerized system, ICUpilot™, (CMA Microdialysis AB, Stockholm, Sweden). Blood samples were obtained every 4–6 hours from an arterial line and analyzed for glucose in a Radiometer ABL 725 Blood Gas Analyzer (Radiometer, Copenhagen, Denmark). For the analysis of 12 hours, we could include only 11 patients because of missing values from the initial hours of one patient.
Microdialysis Technique
The principle of the microdialysis technique has been described in detail.23 It is a technique for sampling the chemistry of the interstitial fluid of tissues and organs in animal and man. A semipermeable membrane with a double-lumen concentric cannula, mimicking a blood capillary, is attached to the microdialysis catheter. The catheter has an inlet and an outlet tube. A sterile fluid is perfused through the inlet tube, and chemical substances from the interstitial fluid diffuse across the membrane into the perfusion fluid in the inner cannula. The inner cannula connects to the outlet tube that ends in a vial holder where the fluid, now referred to as dialysate, is collected. The recovery of a substance is defined as the concentration of the substance in the dialysate expressed as a percentage of the concentration in the interstitial fluid, which is usually assumed to be similar to blood. If the semipermeable membrane is long enough and the perfusion flow slow enough, the concentration in the dialysate membrane will approach the concentration in the interstitial fluid, i.e., recovery will be close to 100%. The concentration in the dialysate also depends on the supply of substances from blood capillaries as well as uptake and release from cells. In the case of brain catheters, we used CMA 70 microdialysis brain catheters with gold tips (CMA Microdialysis AB) with a membrane length of 10 mm. The catheter was perfused with Perfusion Fluid CNS (CMA Microdialysis AB), which is an isotonic sterile perfusion fluid specially developed for microdialysis use in the central nervous system. We used perfusion pumps (CMA 107 MD Pump, CMA Microdialysis AB) available for clinical use with the standard perfusion flow of 0.3 μl/min. With the membrane length of 10 mm and perfusion flow of 0.3 μl/min, the mean recovery of glucose, lactate, pyruvate, and glutamate has been estimated to be approximately 70%.25 In SC adipose tissue, we used CMA 60 catheters with a membrane length of 30 mm (CMA Microdialysis AB). The peripheral catheter was perfused with the recommended perfusion fluid T1 (CMA Microdialysis AB) using the CMA 107 MD Pump. It has been shown that this membrane length with a flow rate of 0.3 ml/min gives a glucose recovery of 80–93%.26–28 During these circumstances, the recovery is not affected by small changes in blood flow around the catheter, which may happen with higher perfusion flows. With a perfusion flow rate of 0.3 ml/min, there is a delay or a lag-time of 20–30 minutes occurring when the dialysate flows from the tissue to the microvial. During neurointensive care, chemical changes usually take place over several hours and a 20–30-minute delay is of minimal consequence. However, we analyzed our results both with and without a correction for lag-time and obtained similar results. The results presented are calculated with a correction time of 30 minutes. Microdialysis samples were taken every hour from all three catheters. The samples were analyzed in a CMA 600 microdialysis analyzer bedside system (CMA Microdialysis AB) for glucose, lactate, pyruvate, and glycerol. The CMA 600 Analyzer is a clinical chemistry analyzer that uses enzymatic reagents and colorimetric measurements. The reagents enzymatically oxidize the substrates and hydrogen peroxide is formed. Peroxidase then catalyzes the reaction between hydrogen peroxide and 4-amino-antipyrine to form colorimetric indicators. The rate of formation of the colored substance is proportional to the substrate concentration and is measured photometrically as change of absorbance at 546 nm wave- lengths. Blood glucose sampling during the first 12 hours was performed every hour and thereafter every 4–6 hours and analyzed by Karolinska University Hospital, Department of Clinical Chemistry. The time of blood sampling and microdialysis sampling were synchronized.
Statistics
All physiological parameters were collected on-line with ICUpilot software (CMA Microdialysis AB). Routine biochemical data and biochemical data obtained from the microdialysis monitor were measured at-line with ICUpilot software. The relations between levels of glucose in peripheral blood, SC fat tissue, and NIB tissue were analyzed using linear regression analysis. For the analysis of the first 12 hours, two time points were chosen in each patient, a total cluster of 22 time points, where corresponding serum values were obtained and correlated using linear regression analysis. Prior to this, the homoscedasticity of the data was tested by performing Shapiro-Wilk normality test with an alpha level of 0.05. For the consecutive 3 days, all intracerebral glucose levels with corresponding serum levels were analyzed within each patient using linear regression analysis. The statistical analyses were performed using Excel (Microsoft, Mac v.2008) and GraphPad Prism (GraphPad Software, Inc., Mac 5.0c). A p value of <.05 was considered as a significant correlation.
Results
A summary of glucose values during the first 12 hours and 3 days in NICU are presented as mean ± standard deviation (SD) in Table 1. Mean blood glucose values during the initial 12 hours were higher than during the 3 days. This was also the case for glucose in the brain, however, in SC fat tissue it was the opposite. This was also the case during the 3 days in the NICU: injured brain (IB) 1.6 ± 1.1 mmol/liter versus NIB 3.1 ± 1.9 mmol/liter. The L/P ratio was in the normal range and although it tended to be higher in the IB, it was not significantly different than in NIB.
Table 1.
Glucose and L/P Ratio as Mean ± SD
| Blood glucose (mmol/liter) | SC-glucose (mmol/liter)a | NIB area (mmol/liter) | IB area (mmol/liter) | L/P ratio NIB area | L/P ratio IB area | |
|---|---|---|---|---|---|---|
| Initial 12 hours | 7.8 ± 2.1 (n = 12) | 4.5 ± 2.6 (n = 12) | 2.8 ± 1.7 (n = 11) | 1.9 ± 1.2 (n = 8) | 23.1 ± 12.2 (n = 11) | 22.1 ± 8.8 (n = 8) |
| 3 days in NICU | 5.7 ± 2.3 (n = 12) | 7.4 ± 1.6 (n = 12) | 3.1 ± 1.9 (n = 12) | 1.6 ± 1.1 (n = 8) | 19.9 ± 8.1 (n = 12) | 24.7 ± 7.4 (n = 8) |
| Normal values | 4.0–6.0b | 4–5c | 1.7 ± 0.9d | 23 ± 4d |
SC-glucose, SC glucose levels.
Karolinska University Hospital Solna, Department of Clinical Chemistry.
Microdialysis values with a perfusion rate of 0.3 ml/min obtained from subcutaneous adipose tissue in healthy subjects.24
Microdialysis values with a perfusion rate of 0.3 ml/min obtained from normal human brain29
First 12 Hours after Start of Microdialysis
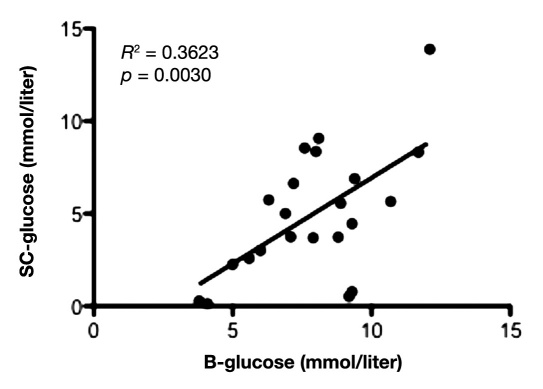
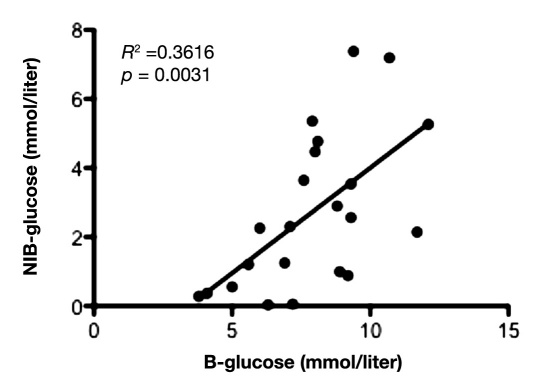
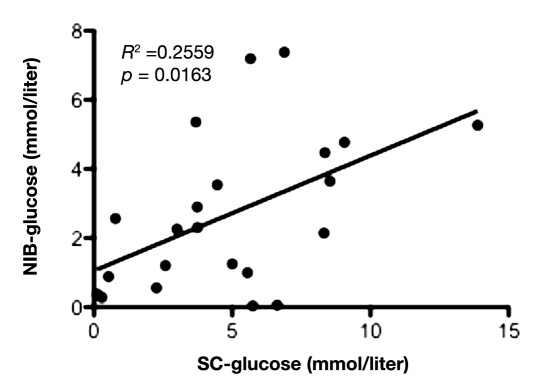
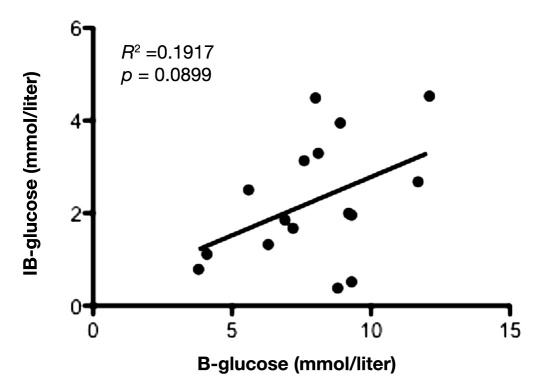
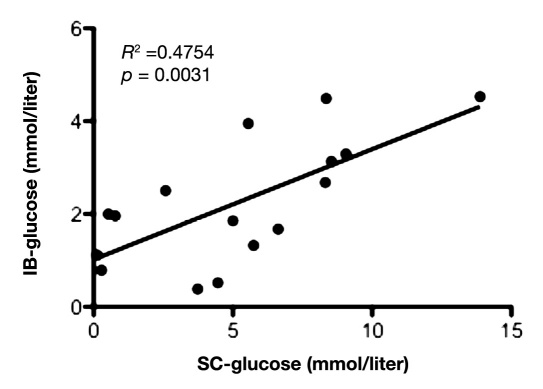
Mean value of glucose during the first 12 hours in IB was 1.9 ± 1.2 mmol/liter and 2.8 ± 1.7 mmol/liter in NIB area. During the first 12 hours of microdialysis monitoring, there was a positive and significant correlation between the glucose levels in peripheral blood and SC fat tissue (slope = 0.93 ± 0.28; y-intercept = -2.34 ± 2.24; p = .0030; Figure 1), as well as between peripheral blood and NIB tissue (slope = 0.61 ± 0.18; y-intercept = -2.09 ± 1.48; p = .0031; Figure 2). Correlation between the glucose levels in SC fat and NIB tissue was also significant (slope = 0.33 ± 0.13; y-intercept = 1.05 ± 0.76; p = .0163; Figure 3). However, there was no significant correlation between blood glucose and IB area (slope = 0.25 ± 0.14; y-intercept = 0.26 ± 1.14; p = .0899; Figure 4). Interestingly, the glucose in the IB correlated significantly with SC glucose (slope = 0.24 ± 0.07; y-intercept = 1.02 ± 0.43; p = .0031; Figure 5).
Figure 1.
Illustrates the correlation between blood glucose and subcutaneous adipose tissue during the first 12 hours in NICU (n = 11) with two time points for each patient. p < .05 was considered as a significant correlation.
Figure 2.
Illustrates correlation between blood glucose and NIB area during the first 12 hours in the NICU (n = 11) with two time points for each patient. p < .05 was considered as a significant correlation.
Figure 3.
Illustrates correlation between the glucose in SC fat tissue and NIB tissue during the first 12 hours in the NICU (n = 11) with two time points for each patient. p < .05 was considered as a significant correlation.
Figure 4.
Illustrates correlation between the glucose in blood and IB tissue during the first 12 hours in the NICU (n = 8) with two time points for each patient. p < .05 was considered as a significant correlation.
Figure 5.
Illustrates correlation between the glucose in subcutaneous fat tissue (SC) and IB tissue during the first 12 hours in the NICU (n = 8), with two time points for each patient. p < .05 was considered as a significant correlation.
3 Days in NICU
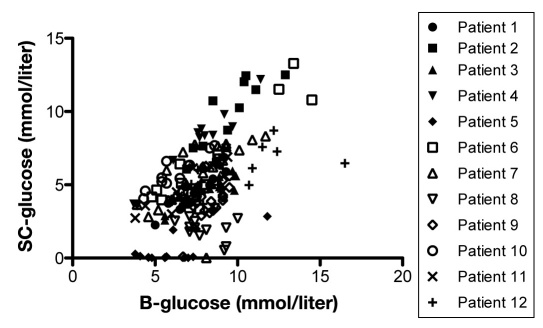
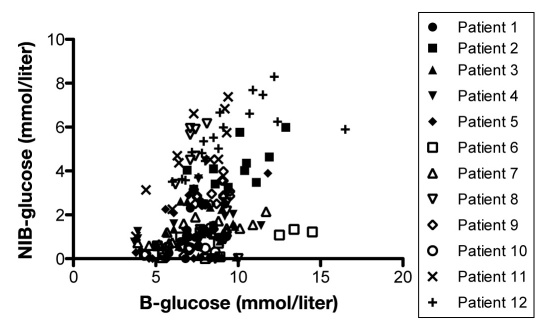
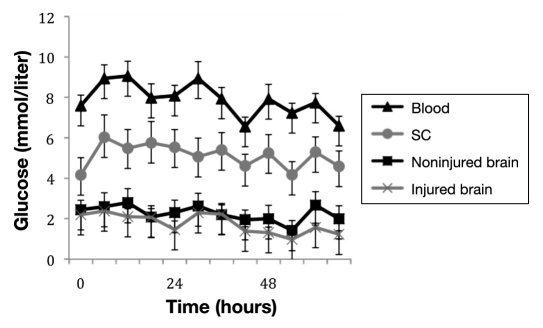
Mean value of glucose during the 3 consecutive days was lower in IB than in NIB, 1.6 ± 1.1 mmol/liter and 3.1 ± 1.9 mmol/liter, respectively. For each patient, 3 consecutive days with complete datasets of glucose levels in peripheral blood, SC fat, and NIB tissue were analyzed using regression analysis. The correlation between peripheral blood glucose and SC fat tissue showed a significant positive correlation in 11 out of 12 patients during this period (Figure 6). Eight of 12 patients presented a significant positive correlation between levels of glucose in peripheral blood and in NIB tissue, while one presented a significant negative correlation (Figure 7). In 5 out of 11 patients, there was a significant correlation between SC glucose and NIB (Figure 8).
Figure 6.
Shows correlation between blood glucose and glucose in subcutaneous adipose tissue in each patient during any 3 consecutive days in the NICU (n = 12). p < .05 was considered as a significant correlation and was seen in patients 1–7 and 9–12.
Figure 7.
Shows correlation between blood glucose and glucose in NIB area in each patient during any 3 consecutive days in the NICU (n = 12). p < .05 was considered as a significant correlation and was seen in patients 2, 5, and 7–12.
Figure 8.
Shows correlation between glucose in subcutaneous tissue and glucose in NIB area (NIB-glucose) in each patient during any 3 consecutive days in the NICU (n = 8). p < .05 was considered as a significant correlation and was seen in patients 5, 7, 9, 11, and 12.
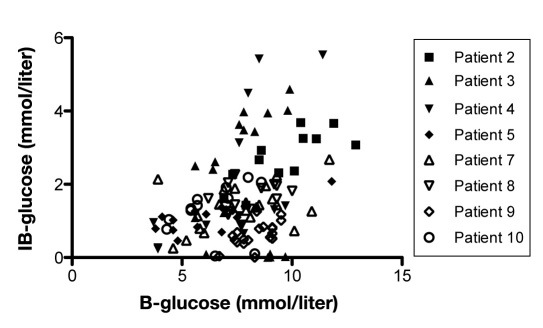
A significant positive correlation between blood glucose and IB area was obtained in 4 out of 8 patients (Figure 9). Furthermore, a positive significant correlation between SC fat tissue and IB area could be seen in 5 out of 8 patients (Figure 10).
Figure 9.
Shows correlation between blood glucose and glucose in IB area (IB-glucose) in each patient during any 3 consecutive days in the NICU (n = 8). p < .05 was considered as a significant correlation and was seen in patients 4–6 and 9.
Figure 10.
Shows correlation between glucose in subcutaneous fat tissue (SC-glucose) and glucose in IB area (IB-glucose) in each patient during any 3 consecutive days in the NICU (n = 8). p < .05 was considered as a significant correlation and was seen in patients 2, 4, 5, 7, and 9.
A summary of glucose values in different tissues measured over 3 days is illustrated in Figure 11. No alterations in recovery of glucose could be seen over time.
Figure 11.
Shows glucose levels in blood (triangle), subcutaneous tissue (circle), NIB (square), and IB (cross) during any 3 consecutive days in the NICU. The values are given as mean ± standard error of the mean. For blood, subcutaneous tissue, and NIB area, n = 12. For IB area, n = 8.
Microdialysis L/P Ratio
The mean values for microdialysis L/P ratio for NIB and IB for the first 12 hours and the 3 consecutive days are shown in Table 1.
Discussion
During normal neuronal activation, glucose transporter proteins (GLUT1 and GLUT3) are augmented to increase glucose transport.30 These are regulated to meet the metabolic demand of the brain, and in experimental models, both have been shown to increase after ischemic brain injury31,32 and GLUT1 after TBI.33 The correlation of levels of glucose in the peripheral blood and brain is difficult to examine with microdialysis in humans during physiological conditions for obvious reasons, but microdialysis values obtained from normal brain tissue in patients undergoing surgery for benign lesions in the posterior fossa have been reported.29 A linear relationship between plasma and brain glucose concentrations in the range of plasma glucose levels 4–30 mM has been presented in a study using magnetic resonance spectros-copy.34 The interstitial glucose concentration, monitored by microdialysis, is affected by local metabolic rate, local blood flow, and blood glucose levels. Frykholm and colleagues showed in a study using microdialysis in nonhuman primates that glucose in the brain correlated significantly with cerebral blood flow and cerebral metabolic oxygen consumption.35 During physiological conditions, the glucose levels in peripheral blood correlates with the adipose tissue,36,37 however, the cerebral glucose concentration has been suggested to be 40% of blood glucose concentration.38 Recovery of glucose in SC adipose tissue with a perfusion flow rate of 0.3 ml/min and membrane length of 30 mm has been shown to be 90%,39 however, using a membrane length of 10 mm in brain, it has been estimated to be 70%.25 Our results obtained from NIB and SC fat tissue with a perfusion rate of 0.3 ml/min is slightly higher but in the range of reported results and in the same range of recovery.25,29,40 However, the values in IB were lower than in NIB. There can be several reasons behind this such as vasogenic or cellular edemas, that are main components of pathophysiology in traumatic brain injury.41 An edema is a result of mithocondrial dysfunction and energy crises that lead to ionic dysregulation and cellular swelling. The edema could also change the tortuosity of the brain tissue and thereby the recovery circumstances. In the IB area, there can also be a low regional cerebral blood flow or high glucose metabolism. However, the levels of glucose and mean L/P ratio were within normal range.
We did observe short episodes of zero values of glucose in brain and SC fat tissue despite normal blood glucose values, but did not observe clinical events that could be related to these dips. Also, the L/P ratio remained unchanged. Although it is hard to explain these events, it is more likely that the zero values do not represent a biological process, since no other changes such as increase in lactate could be observed, but indicate more technical issues in the analysis.
The positive and significant correlation between the glucose levels in peripheral blood and NIB tissue during the first 12 hours was less prominent when analyzed during the 3 consecutive days, when only 8 out of 12 patients presented a positive significant correlation between the glucose levels in peripheral blood and NIB tissue. These results indicate the presence of periods of mismatch between peripheral and brain glucose that are not possible to detect by blood sampling only. This was more evident in the NIB in which half the patients showed no significant correlation. This discrepancy might be explained by different specific changes in the metabolic state of the brain after injury,5 such as hyperglycolysis,6 local hypermetabolism,42 and episodes of low cerebral blood flow.43 In a study using artificial neural networks, it was shown that microdialysis in patients with TBI show a highly individualistic pattern,44 which is in line with the results from the present study.
We found a significant positive correlation between glucose in adipose tissue and brain during the first 12 hours. This is in contrast to findings in a study evaluating the first 6 hours.45 The authors suggested an initial stress reaction with catecholamine release and local vasoconstriction as explanation, despite the use of antistress/antihypertensive treatment using B1 antagonist in the referred study, which differs from the clinical routine in our department.
While investigating the glucose levels in blood, SC fat tissue, and brain, we could not see any alterations in the recovery of glucose over time, which could be explained by the low perfusion flow used.
To the best of our knowledge, this is the first study investigating the correlation of glucose in brain, adipose tissue, and blood. This study is in line with other micro-dialysis studies, indicating the importance of cerebral brain microdialysis for glucose measurement and for detection of veiled metabolic cerebral events that cannot be detected by blood glucose alone.
Conclusion
Even though glucose levels in peripheral blood correlates well with the extracellular intracerebral space in the noninjured hemisphere within the first 12 hours, this study indicates the importance of using microdialysis monitoring of the cerebral tissue in patients with severe TBI to detect changes in tissue metabolism that might be devastating to the brain. It also shows a poorer correlation between blood glucose and IB area, and necessitates a catheter in the IB area. Further analysis needs to be performed in order to correlate the levels of intracerebral glucose versus tissue damage, e.g., using tissue damage markers in microdialysis.
Acknowledgments
The study was approved by the local ethics committee (01-297; 03-540). The NICU staff at Karolinska University Hospital Solna are gratefully acknowledged for their everlasting enthusiasm and help concerning the present project.
Abbreviations
- (ANLSH)
astrocyte-neuron lactate shuttle hypothesis
- (CT)
computed tomography
- (GCS)
Glasgow Coma Scale
- (GLUT)
glucose transporter
- (IB)
injured brain
- (ICP)
intracranial pressure
- (L/P)
lactate/pyruvate
- (MAP)
mean arterial blood pressure
- (NIB)
noninjured brain
- (NICU)
neurointensive care unit
- (SC)
subcutaneous
- (SD)
standard deviation
- (TBI)
traumatic brain injury
Funding:
This study was funded by the Stockholm County Council.
References:
- 1.Pellerin L, Magistretti PJ. Glutamate uptake into astrocytes stimulates aerobic glycolysis: a mechanism coupling neuronal activity to glucose utilization. Proc Natl Acad Sci U S A. 1994;91(22):10625–10629. doi: 10.1073/pnas.91.22.10625. [DOI] [PMC free article] [PubMed] [Google Scholar]
- 2.Fillenz M. The role of lactate in brain metabolism. Neurochem Int. 2005;47(6):413–417. doi: 10.1016/j.neuint.2005.05.011. [DOI] [PubMed] [Google Scholar]
- 3.Mangia S, Simpson IA, Vannucci SJ, Carruthers A. The in vivo neuron-to-astrocyte lactate shuttle in human braevidence from modeling of measured lactate levels during visual stimulation. J Neurochem. 2009;109(Suppl 1):55–62. doi: 10.1111/j.1471-4159.2009.06003.x. [DOI] [PMC free article] [PubMed] [Google Scholar]
- 4.Vespa P, Bergsneider M, Hattori N, Wu HM, Huang SC, Martin NA, Glenn TC, McArthur DL, Hovda DA. Metabolic crisis without brain ischemia is common after traumatic brain injury: a combined microdialysis and positron emission tomography study. J Cereb Blood Flow Metab. 2005;l25(6):763–774. doi: 10.1038/sj.jcbfm.9600073. [DOI] [PMC free article] [PubMed] [Google Scholar]
- 5.Hayes RL, Katayama Y, Jenkins LW, Lyeth BG, Clifton GL, Gunter J, Povlishock JT, Young HF. Regional rates of glucose utilization in the cat following concussive head injury. J Neurotrauma. 1988;5(2):121–137. doi: 10.1089/neu.1988.5.121. [DOI] [PubMed] [Google Scholar]
- 6.Bergsneider M, Hovda DA, Shalmon E, Kelly DF, Vespa PM, Martin NA, Phelps ME, McArthur DL, Caron MJ, Kraus JF, Becker DP. Cerebral hyperglycolysis following severe traumatic brain injury in humans: a positron emission tomography study. J Neurosurg. 1997;86(2):241–251. doi: 10.3171/jns.1997.86.2.0241. [DOI] [PubMed] [Google Scholar]
- 7.Van Beek JG, Mushkudiani NA, Steyerberg EW, Butcher I, McHugh GS, Lu J, Marmarou A, Murray GD, Maas AI. Prognostic value of admission laboratory parameters in traumatic brain injury: results from the IMPACT study. J Neurotrauma. 2007;24(2):315–328. doi: 10.1089/neu.2006.0034. [DOI] [PubMed] [Google Scholar]
- 8.Kreutziger J, Wenzel V, Kurz A, Constantinescu MA. Admission blood glucose is an independent predictive factor for hospital mortality in polytraumatised patients. Intensive Care Med. 2009;35(7):1234–1239. doi: 10.1007/s00134-009-1446-z. [DOI] [PubMed] [Google Scholar]
- 9.Rovlias A, Kotsou S. The influence of hyperglycemia on neurological outcome in patients with severe head injury. Neurosurgery. 2000;46(2):335–343. doi: 10.1097/00006123-200002000-00015. [DOI] [PubMed] [Google Scholar]
- 10.Pentelényi T, Kammerer L. Changes in blood glucose after head injury and its prognostic significance. Injury. 1977;8(4):264–268. doi: 10.1016/0020-1383(77)90099-7. [DOI] [PubMed] [Google Scholar]
- 11.Auer RN, Olsson Y, Siesjö BK. Hypoglycemic brain injury in the rat. Correlation of density of brain damage with the EEG isoelectric time: a quantitative study. Diabetes. 1984;33(11):1090–1098. doi: 10.2337/diab.33.11.1090. [DOI] [PubMed] [Google Scholar]
- 12.Lam AM, Winn HR, Cullen BF, Sundling N. Hyperglycemia and neurological outcome in patients with head injury. J Neurosurg. 1991;75(4):545–551. doi: 10.3171/jns.1991.75.4.0545. [DOI] [PubMed] [Google Scholar]
- 13.Van den Berghe G, Wilmer A, Hermans G, Meersseman W, Wouters PJ, Milants I, Van Wijngaerden E, Bobbaers H, Bouillon R. Intensive insulin therapy in the medical ICU. N Engl J Med. 2006;354(5):449–461. doi: 10.1056/NEJMoa052521. [DOI] [PubMed] [Google Scholar]
- 14.Van den Berghe G, Wouters P, Weekers F, Verwaest C, Bruyninckx F, Schetz M, Vlasselaers D, Ferdinande P, Lauwers P, Bouillon R. Intensive insulin therapy in the critically ill patients. N Engl J Med. 2001;345(19):1359–1367. doi: 10.1056/NEJMoa011300. [DOI] [PubMed] [Google Scholar]
- 15.Strong AJ, Boutelle MG, Vespa PM, Bullock MR, Bhatia R, Hashemi P. Treatment of critical care patients with substantial acute ischemic or traumatic brain injury. Crit Care Med. 2005;33(9):2147–2149. doi: 10.1097/01.ccm.0000179029.95415.51. author reply 2149. [DOI] [PubMed] [Google Scholar]
- 16.Finfer S, Chittock DR, Su SY, Blair D, Foster D, Dhingra V, Bellomo R, Cook D, Dodek P, Henderson WR, Hébert PC, Heritier S, Heyland DK, McArthur C, McDonald E, Mitchell I, Myburgh JA, Norton R, Potter J, Robinson BG, Ronco JJ. Intensive versus conventional glucose control in critically ill patients. N Engl J Med. 2009;360(13):1283–1297. doi: 10.1056/NEJMoa0810625. [DOI] [PubMed] [Google Scholar]
- 17.Meierhans R, Béchir M, Ludwig S, Sommerfeld J, Brandi G, Haberthür C, Stocker R, Stover JF. Brain metabolism is significantly impaired at blood glucose below 6 mM and brain glucose below 1 mM in patients with severe traumatic brain injury. Crit Care. 2010;14(1):R13. doi: 10.1186/cc8869. [DOI] [PMC free article] [PubMed] [Google Scholar]
- 18.Holbein M, Béchir M, Ludwig S, Sommerfeld J, Cottini SR, Keel M, Stocker R, Stover JF. Differential influence of arterial blood glucose on cerebral metabolism following severe traumatic brain injury. Crit Care. 2009;13(1):R13. doi: 10.1186/cc7711. [DOI] [PMC free article] [PubMed] [Google Scholar]
- 19.Vespa PM, McArthur D, O'Phelan K, Glenn T, Etchepare M, Kelly D, Bergsneider M, Martin NA, Hovda DA. Persistently low extra-cellular glucose correlates with poor outcome 6 months after human traumatic brain injury despite a lack of increased lactate: a microdialysis study. J Cereb Blood Flow Metab. 2003;23(7):865–877. doi: 10.1097/01.WCB.0000076701.45782.EF. [DOI] [PubMed] [Google Scholar]
- 20.Godoy DA, Di Napoli M, Rabinstein AA. Treating hyperglycemia in neurocritical patients: benefits and perils. Neurocrit Care. 2010;13(3):425–438. doi: 10.1007/s12028-010-9404-8. [DOI] [PubMed] [Google Scholar]
- 21.Ungerstedt U, Rostami E. Microdialysis in neurointensive care. Curr Pharm Des. 2004;10(18):2145–2152. doi: 10.2174/1381612043384105. [DOI] [PubMed] [Google Scholar]
- 22.Bellander BM, Cantais E, Enblad P, Hutchinson P, Nordström CH, Robertson C, Sahuquillo J, Smith M, Stocchetti N, Ungerstedt U, Unterberg A, Olsen NV. Consensus meeting on microdialysis in neurointensive care. Intensive Care Med. 2004;30(12):2166–2169. doi: 10.1007/s00134-004-2461-8. [DOI] [PubMed] [Google Scholar]
- 23.Ungerstedt U. Microdialysis'principles and applications for studies in animals and man. J Intern Med. 1991;230(4):365–373. doi: 10.1111/j.1365-2796.1991.tb00459.x. [DOI] [PubMed] [Google Scholar]
- 24.Ekberg NR, Wisniewski N, Brismar K, Ungerstedt U. Measurement of glucose and metabolites in subcutaneous adipose tissue during hyperglycemia with microdialysis at various perfusion flow rates. Clin Chim Acta. 2005;359(1-2):53–64. doi: 10.1016/j.cccn.2005.03.033. [DOI] [PubMed] [Google Scholar]
- 25.Hutchinson PJ, O'Connell MT, Al-Rawi PG, Maskell LB, Kett-White R, Gupta AK, Richards HK, Hutchinson DB, Kirkpatrick PJ, Pickard JD. Clinical cerebral microdialysis: a methodological study. J Neurosurg. 2000;93(1):37–43. doi: 10.3171/jns.2000.93.1.0037. [DOI] [PubMed] [Google Scholar]
- 26.Bolinder J, Ungerstedt U, Arner P. Long-term continuous glucose monitoring with microdialysis in ambulatory insulin-dependent diabetic patients. Lancet. 1993;342(8879):1080–1085. doi: 10.1016/0140-6736(93)92063-y. [DOI] [PubMed] [Google Scholar]
- 27.Rosdahl H, Hamrin K, Ungerstedt U, Henriksson J. Metabolite levels in human skeletal muscle and adipose tissue studied with microdialysis at low perfusion flow. Am J Physiol. 1998;274(5 Pt 1):E936–E945. doi: 10.1152/ajpendo.1998.274.5.E936. [DOI] [PubMed] [Google Scholar]
- 28.Rajamand N, Ungerstedt U, Brismar K. Subcutaneous microdialysis before and after an oral glucose tolerance test: a method to determine insulin resistance in the subcutaneous adipose tissue in diabetes mellitus. Diabetes Obes Metab. 2005;7(5):525–535. doi: 10.1111/j.1463-1326.2004.00424.x. [DOI] [PubMed] [Google Scholar]
- 29.Reinstrup P, Stähl N, Mellergärd P, Uski T, Ungerstedt U, Nordström CH. Intracerebral microdialysis in clinical practice: baseline values for chemical markers during wakefulness, anesthesia, and neurosurgery. Neurosurgery. 2000;47(3):701–709. doi: 10.1097/00006123-200009000-00035. discussion 709-10. [DOI] [PubMed] [Google Scholar]
- 30.Simpson IA, Carruthers A, Vannucci SJ. Supply and demand in cerebral energy metabolism: the role of nutrient transporters. J Cereb Blood Flow Metab. 2007;27(11):1766–1791. doi: 10.1038/sj.jcbfm.9600521. [DOI] [PMC free article] [PubMed] [Google Scholar]
- 31.Lee WH, Bondy CA. Ischemic injury induces brain glucose transporter gene expression. Endocrinology. 1993;133(6):2540–2544. doi: 10.1210/endo.133.6.8243275. [DOI] [PubMed] [Google Scholar]
- 32.Gerhart DZ, Leino RL, Taylor WE, Borson ND, Drewes LR. GLUT1 and GLUT3 gene expression in gerbil brain following brief ischemia: an in situ hybridization study. Brain Res Mol Brain Res. 1994;25(3-4):313–322. doi: 10.1016/0169-328x(94)90167-8. [DOI] [PubMed] [Google Scholar]
- 33.Cornford EM, Hyman S, Cornford ME, Caron MJ. GLUT1 glucose transporter activity in human brain injury. J Neurotrauma. 1996;13(9):523–536. doi: 10.1089/neu.1996.13.523. [DOI] [PubMed] [Google Scholar]
- 34.Gruetter R, Ugurbil K, Seaquist ER. Steady-state cerebral glucose concentrations and transport in the human brain. J Neurochem. 1998;70(1):397–408. doi: 10.1046/j.1471-4159.1998.70010397.x. [DOI] [PubMed] [Google Scholar]
- 35.Frykholm P, Hillered L, Långström B, Persson L, Valtysson J, Enblad P. Relationship between cerebral blood flow and oxygen metabolism, and extracellular glucose and lactate concentrations during middle cerebral artery occlusion and reperfusion: a micro-dialysis and positron emission tomography study in nonhuman primates. J Neurosurg. 2005;102(6):1076–1084. doi: 10.3171/jns.2005.102.6.1076. [DOI] [PubMed] [Google Scholar]
- 36.Bolinder J, Hagström E, Ungerstedt U, Arner P. Microdialysis of subcutaneous adipose tissue in vivo for continuous glucose monitoring in man. Scand J Clin Lab Invest. 1989;49(5):465–474. doi: 10.1080/00365518909089123. [DOI] [PubMed] [Google Scholar]
- 37.Jansson PA, Fowelin J, Smith U, Lönnroth P. Characterization by microdialysis of intracellular glucose level in subcutaneous tissue in humans. Am J Physiol. 1988;255(2 Pt 1):E218–E220. doi: 10.1152/ajpendo.1988.255.2.E218. [DOI] [PubMed] [Google Scholar]
- 38.Siesjo BK. New York: John Wiley & Sons; 1978. Brain energy metabolism. [Google Scholar]
- 39.Moberg E, Hagström-Toft E, Arner P, Bolinder J. Protracted glucose fall in subcutaneous adipose tissue and skeletal muscle compared with blood during insulin-induced hypoglycaemia. Diabetologia. 1997;40(11):1320–1326. doi: 10.1007/s001250050827. [DOI] [PubMed] [Google Scholar]
- 40.Hillered L, Persson L. Neurochemical monitoring of the acutely injured human brain. Scand J Clin Lab Invest Suppl. 1999;229:9–18. doi: 10.1080/00365519950185904. [DOI] [PubMed] [Google Scholar]
- 41.Marmarou A. Pathophysiology of traumatic brain edema: current concepts. Acta Neurochir Suppl. 2003;86:7–10. doi: 10.1007/978-3-7091-0651-8_2. [DOI] [PubMed] [Google Scholar]
- 42.Yoshino A, Hovda DA, Kawamata T, Katayama Y, Becker DP. Dynamic changes in local cerebral glucose utilization following cerebral conclusion in rats: evidence of a hyper- and subsequent hypometabolic state. Brain Res. 1991;561(1):106–119. doi: 10.1016/0006-8993(91)90755-k. [DOI] [PubMed] [Google Scholar]
- 43.Hlatky R, Contant CF, Diaz-Marchan P, Valadka AB, Robertson CS. Significance of a reduced cerebral blood flow during the first 12 hours after traumatic brain injury. Neurocrit Care. 2004;1(1):69–83. doi: 10.1385/NCC:1:1:69. [DOI] [PubMed] [Google Scholar]
- 44.Nelson DW, Bellander BM, Maccallum RM, Axelsson J, Alm M, Wallin M, Weitzberg E, Rudehill A. Cerebral microdialysis of patients with severe traumatic brain injury exhibits highly individualistic patterns as visualized by cluster analysis with self-organizing maps. Crit Care Med. 2004;32(12):2428–2436. doi: 10.1097/01.ccm.0000147688.08813.9c. [DOI] [PubMed] [Google Scholar]
- 45.Lourido J, Ederoth P, Sundvall N, Ungerstedt U, Nordström CH. Correlation between blood glucose concentration and glucose concentration in subcutaneous adipose tissue evaluated with microdialysis during intensive care. Scand J Clin Lab Invest. 2002;62(4):285–292. doi: 10.1080/003655102760145843. [DOI] [PubMed] [Google Scholar]


