Abstract
Background:
It has become established that a diabetic vasculature promotes cardiovascular disease progression via changes to endothelial cells, platelets, and the interactions of these cells. It is believed that the majority of these changes are induced by the presence of advanced glycation end products (AGEs), which permanently alter various functions. Studies have shown that platelets perpetuate endothelial cell responses under these conditions. However, the role of changes in endothelial cell thrombogenicity and inflammatory responses, after subjected to AGEs, has not been characterized. Our objective was to evaluate the effects of AGEs on these functions.
Methods:
To accomplish this, albumin was chemically modified by exposure to glucose for up to 8 weeks, and endothelial cells were subjected to glycated albumin for up to 5 days in a cell culture system. A time course for changes in endothelial cell viability, density, morphology, and metabolic activity were investigated, along with the surface expression of intercellular adhesion molecule-1, thrombomodulin, tissue factor, connexin-43, and caveolin-1.
Results:
Endothelial cells exposed to irreversibly glycated albumin were less viable, proliferated slower, and had a lower metabolic activity as compared to cells exposed to nonglycated albumin. Endothelial cells that were exposed to any glycated albumin were procoagulant and proinflammatory as compared with all other conditions. There were no overall trends in the expression of connexin-43 or caveolin-1.
Conclusions:
Our data suggest that the presence of irreversible glycated albumin is deleterious to endothelial cells, makes endothelial cells more procoagulant, and promotes inflammatory responses. It is therefore possible that endothelial cell activation may precede and promote platelet activation during diabetic conditions.
Keywords: advanced glycation end products, cardiovascular diseases, diabetes mellitus, endothelial cells, thrombogenicity
Introduction
It has been shown that the diabetic vasculature is vastly different from the normal vasculature and that these differences mimic cardiovascular pathologies.1–3 Most agree that this is predominantly due to the presence of advanced glycation end products (AGEs) within the vascular system.4 Advanced glycation end products are proteins that become glycated after exposure to abnormally high sugar concentrations. A debate exists as to when glycation becomes irreversible. Some claim that a Schiff base is irreversible (glycation time of 1–2 weeks), whereas others claim that the products must pass to the Amadori rearrangement to be fully glycated (6–8 weeks of glycation).5,6 Regardless, AGEs perpetuate many deleterious effects associated with cardiovascular complications during diabetes.
It has become apparent that platelets play an important role in cardiovascular diseases.7–9 We have shown that glycated albumin enhances platelet susceptibility to shear induced activation and aggregation.10 There have been a few reports on the effects of AGEs on platelets, showing that platelets are more susceptible to aggregation and that platelet calcium concentrations are elevated.11–13 Increased calcium induces many of the processes associated with hemostasis, such as activation, shape change, aggregation, and adhesion. Furthermore, enhanced aggregation is a hallmark of many cardiovascular diseases.
Only a few studies have focused on the effects of AGEs on endothelial cell thrombotic and inflammatory responses. For instance, AGEs induce the activation of nuclear factor kappa of activated B cells,14 which transforms the cell membrane from anticoagulant to procoagulant. Furthermore, the migration of inflammatory mediators is enhanced in the presence of AGEs.15 The majority of other studies that investigated the relationship between the presence of AGEs and changes to endothelial cells were only marginally related to thrombosis. Our objective here is to fill this gap by relating the changes to endo-thelial cell culture conditions with changes to endothelial cell thrombotic and inflammatory markers. In this way, the relationship between endothelial cell activation and platelet activation, during diabetic cardiovascular diseases, might be elucidated.
Here, we examined the thrombogenic potential, inflam-matory potential, and culture conditions of endothelial cells that were subjected to glycated albumin. We hypothesized that endothelial cells would be more pro-coagulant and have higher inflammatory responses and diminished culture conditions in the presence of glycated albumin. These responses would also be a function of the extent of glycation and culture duration; with a longer time or duration, the conditions would worsen.
Methods
Advanced Glycation End Product Formation
Bovine serum albumin (BSA) was glycated as previously reported.7,10 Briefly, 50 mg/ml albumin (≥98% pure, Sigma-Aldrich, St. Louis, MO; all materials purchased from Sigma-Aldrich unless otherwise noted) was incubated with 250 mM D-(+)-glucose, 5 mM phenylmethyl-sulfonyl fluoride (Pierce, Rockford, IL), 2 mg/ml aprotinin, 0.5 mg/ml leupeptin, 100 μg/ml penicillin, and 100 U/ml streptomycin in phosphate-buffered saline (PBS; pH 7.4) at 37 °C for 8 weeks. Some albumin samples were incubated without the addition of glucose as a glycation control. Timed samples were removed and dialyzed against PBS. The glycated albumin in this study is the same lot as previously reported, which had 31 glucose molecules associated with albumin after 8 weeks of glycation, 26 glucose molecules after 6 weeks, and 5 glucose molecules after 2 weeks.10 This association was quantified from the protein absorbance patterns at 280 nm.10
Endothelial Cell Culture
Human umbilical vein endothelial cells (HUVECs) were purchased from ScienCell Research Laboratories (Carlsbad, CA) as passage-one cells and were used between passages two and six. Cells were maintained in endothelial cell growth media with the addition of 5% fetal bovine serum, 1X growth supplement, 10 U/ml penicillin, and 10 μg/ml streptomycin (all from ScienCell). Cells were cultured on 1% gelatin-coated flasks. Human umbilical vein endothelial cells were passaged with trypsin, at which time, either nonglycated albumin or glycated albumin was added at a final concentration of 2 mg/ml.7 Some samples had no added albumin, as a control. Human umbilical vein endothelial cells were maintained under these conditions for up to 5 days. Fresh culture media (with the appropriate additions) was exchanged on days 1 and 3. Human umbilical vein endothelial cell seeding density was documented for statistical analysis (and was ~1000 cells/cm2 for each experiment).
Imaging with the Live/Dead Cell Viability Assay
Cell viability and density were quantified with a cell cytotoxicity assay consisting of 2 μM calcein and 4 μM ethidium (in PBS) as described previously.7,16 Warmed reagents were exchanged with the culture media 15 min prior to imaging. Images were taken for 15–20 min at approximately five locations per well and documented with a Nikon TE-2000U inverted microscope interfacing with a Coolsnap fast-cooled (ES2) digital camera at 10× (Nikon, Plan Fluor DL, NA 0.3) or 20× (Nikon, Plan Fluor ELWD, NA 0.45) objectives. Morphological data can also be obtained from this assay.16 The total number of live cells (calcein positive), and the total number of dead cells (ethidium positive) were counted and averaged per independent experiment. Cell viability is the total number of live cells divided by the total number of cells within one imaging area. Cell density is the total number of live cells divided by the imaging area. This was normalized by the seeding density. Cell morphology was quantified from calcein-positive images from a customized MATLAB program.16,17
Scanning Electron Microscopy of Endothelial Cells
Scanning electron microscopy was used to perform a more detailed morphological analysis. Endothelial cells were washed twice in PBS. Cells were then fixed with 0.5% glutaraldehyde for 15 min at 37 °C, which was followed by two PBS washes. Cells were then incubated in osmium tetroxide (Electron Microscopy Sciences, Hatfield, PA) for 60 min, followed by two washes. Prior to imaging, cells were dried with absolute ethanol for 15 min (three exchanges). Cells were then dried in hexamethyldisilazane (Electron Microscopy Sciences) for 10 min (two exchanges).18 Finally, cells were coated with gold (BalzersåUnion MED 010 Au/Pt Sputter Coater) for 30 s and then imaged.
Metabolic Activity Quantification
A standard 3-[4,5-dimethylthiazol-2-yl]-2,5-diphenyl tetrazolium bromide (MTT) assay was conducted by incubating HUVECs with reconstituted MTT reagent for 3 h. This assay measures the metabolic activity of living cells through the actions of mitochondrial dehydrogenase. Formazan crystals were dissolved in 10% Triton-X and 0.1 M HCl in anhydrous isopropanol. The resulting solution was gently mixed, and absorbance at 630 nm was quantified using a microplate reader (Beckman Coulter, DTX 880).17 For statistical analysis, metabolic activity was normalized by the metabolic activity for cells exposed to no added albumin after three days in culture (each experiment was paired).
Enzyme-Linked Immunosorbent Assay/Immunofluorescence Microscopy
Enzyme-linked immunosorbent assay (ELISA) was used to quantify the surface expression of intracellular adhesion molecule-1 (ICAM-1), thrombomodulin, and tissue factor. HUVECs were washed twice with PBS and fixed in 0.5% glutaraldehyde for 15 min. Glutaraldehyde was removed with two PBS washes, after which 100 mM glycine+1% BSA (30 min, room temperature) was used for blocking/neutralizing. Cells were washed and then incubated with 5 μg/ml of the specific primary antibody (Ancell Corporation, Bayport, MN) for 60 min. Cells were washed and then incubated with 10 μg/ml of a streptavidin conjugated secondary antibody for 60 min. Binding was detected with tetramethylbenzidine treatment. Color development was read at 450 nm in a microplate reader after the reaction was stopped with 0.5M H2SO4.
Immunofluorescence microscopy was used to quantify the surface expression and localization of connexin-43 and caveolin-1. HUVECs were washed twice in PBS and then fixed in 1.5% glutaraldehyde for 15 min. Neutralization and blocking was conducted with PBS+1% BSA for 30 min. Cells were then washed and incubated with 0.6 μg/ml antihuman connexin-43 (Abcam, Cambridge, MA) and 2 μg/ml antihuman caveolin-1 (Invitrogen, Carlsbad, CA) for 60 min. Cells were then washed and incubated with two fluorescent secondary antibodies at a concentration of 5 μg/ml for 60 min. Cells were washed and stored in PBS+1% BSA for imaging.
All ELISA and immunofluorescent microscopy images were normalized by the paired samples not exposed to albumin. Connexin-43 and caveolin-1 expression was quantified with two customized methods. The first was to split images into the red-blue-green channels. The intensity of individual channels was quantified and normalized (reported as intensity). The second was to merge paired connexin-43 and caveolin-1 images. The expression of discrete clusters was manually counted and normalized (reported as expression).
Statistics
Means and standard deviations of normalized data from individual experiments were pooled. Pooled data from all experiments was tested for significance using a two-way analysis of variance (ANOVA) approach (with replication). Differences in treatment groups and durations are reported on figures for applicable comparisons. Data were analyzed with the statistical software package SAS (v 9.2).
Results
Endothelial Cell Viability and Density
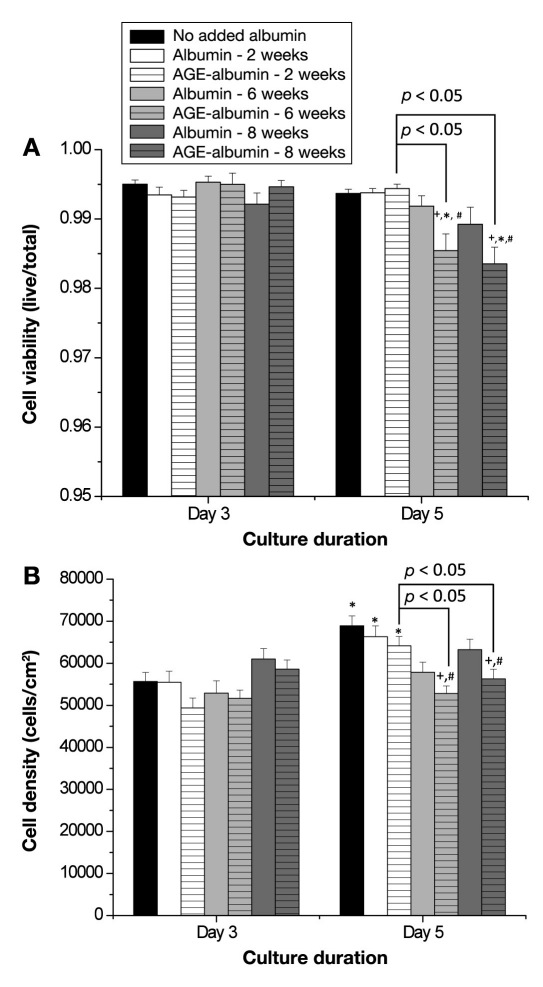
HUVECs were used to determine the effects of glycation, glycation extent, and culture duration on various functions that are associated with the inflammatory and the thrombogenic response. First, we determined the changes in viability and density after incubation with glycated albumin. Viability was high for all conditions (>98%), and there were no significant differences at the early growth duration (Figure 1A, n = 4–5 per condition). With a longer growth duration, the viability for cells that were incubated with albumin exposed to glucose for 6 or 8 weeks was significantly reduced as compared to no added albumin, paired nonglycated albumin, the early duration, and albumin that was exposed to glucose for 2 weeks (the viability was still high). Human umbilical vein endothelial cell density was also compared, and we observed a significant improvement in cell density with longer culture durations (Figure 1B, n = 4–5 per condition). With a longer exposure to albumin exposed to glucose for 6 or 8 weeks, there was a significant reduction in cell density as compared with the no added albumin, the paired nonglycated samples, and albumin exposed to glucose for 2 weeks. Furthermore, there was no increase in density for these cells over time. Thus Figure 1 illustrates that, with a longer incubation with albumin exposed to glucose for a longer duration, the culture conditions deteriorate.
Figure 1.
Endothelial cell (HUVEC) (A) viability and (B) density as a function of culture duration and extent of albumin glycation. Viability and density were calculated from 3–4 images from 4–5 independent experiments. Each bar represents the mean + standard error of the mean of the pooled data from each experiment. +, significantly different from no added albumin (paired by culture duration, two-way ANOVA, p < .05); *, significantly different from day 3 (paired by treatment, two-way ANOVA, p < .05); #, significantly different from nonglycated albumin (paired by culture duration, two-way ANOVA, p < .05).
Endothelial Cell Morphology
The area of HUVECs in culture was determined from the perimeter area of individual cells. Although there were some differences, there was no overall trend (Table 1, n = 4–5 per condition). However, there were significant differences in the percentage of elongated cells for different glycation conditions. With a longer growth duration, we typically see an increase in the percentage of elongated cells. With albumin that was exposed to glucose for 2 or 6 weeks, there was an increased number of elongated cells as compared to the no added albumin conditions. However, with albumin that was exposed to glucose for 8 weeks, the number of elongated cells did not improve. Thus Table 1 suggests that the presence of glycated albumin alters the preference for cells to grow with an elongated morphology but does not alter the cell area.
Table 1.
Endothelial Cell Area and Morphology
| Condition | Growth duration | Elongated cell area (n) | Circular cell area (n) | Fraction of elongated cellsa |
|---|---|---|---|---|
| No added albumin | Day 3 | 3.61 ± 0.06b (1242) | 3.57 ± 0.11 (306) | 80.2% |
| Day 5 | 3.61 ± 0.05 (1174) | 3.73 ± 0.13 (244) | 87.8% | |
| Nonglycated albumin at 2 weeks duration | Day 3 | 2.99 ± 0.08 (405)c | 2.69 ± 0.14 (72)c | 84.9% |
| Day 5 | 3.67 ± 0.12 (328) | 3.80 ±0.54 (13) | 96.1%c,d | |
| Glycated albumin at 2 weeks duration | Day 3 | 3.28 ± 0.13 (281)c | 3.03 ± 0.26 (57)c | 83.1% |
| Day 5 | 3.78 ± 0.10 (324) | 3.67 ± 0.24 (42) | 88.5%c,d | |
| Nonglycated albumin at 6 weeks duration | Day 3 | 3.24 ± 0.09 (349)c | 2.90 ± 0.17 (63)c | 84.7% |
| Day 5 | 3.28 ± 0.12 (240)c | 2.62 ± 0.21 (24)c,e | 91.5%c,d | |
| Glycated albumin at 6 weeks duration | Day 3 | 3.31 ± 0.08 (646)c | 3.35 ± 0.18 (122)c | 84.1% |
| Day 5 | 3.63 ± 0.11 (274) | 3.87 ± 0.35 (31) | 91.8%c | |
| Nonglycated albumin at 8 weeks duration | Day 3 | 3.91 ± 0.07 (736)c | 3.84 ± 0.11 (217)c | 77.2% |
| Day 5 | 3.84 ± 0.06 (1023)c | 4.11 ± 0.12 (236)c | 81.3% | |
| Glycated albumin at 8 weeks duration | Day 3 | 4.08 ± 0.07 (675)c | 4.22 ± 0.15 (148)c | 82.0% |
| Day 5 | 4.34 ± 0.06 (1036)c | 4.58 ± 0.13 (257)c | 80.1%c |
These are shown as directly calculated from n; for statistics, the independent experiments were averaged.
Data are the mean ± standard error of the mean of the cell area (×1000) μm2.
Significantly different from no added albumin (paired by culture duration, two-way ANOVA, p < .05).
Significantly different from day 3 (paired by treatment, two-way ANOVA, p < .05).
Significantly different from elongated (paired by culture duration, two-way ANOVA, p < .05).
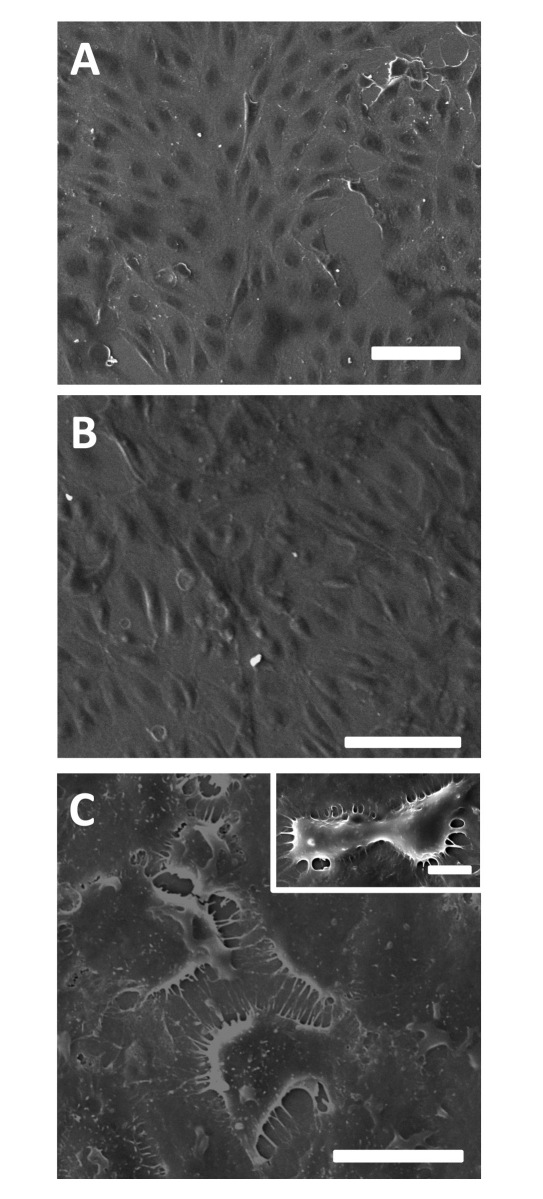
Scanning electron microscopy was used to verify and visualize the morphology of cells. Interestingly, images suggest that there is a strong deterioration in the culture conditions after exposure to albumin exposed to glucose for 8 weeks (Figure 2). The normal “cobblestone” appearance of HUVECs disappears, there are multiple unstable thin connections between neighboring cells, and the cells do not reach confluence (as compared with the culture conditions with no added albumin). After exposure to nonglycated albumin, there appear to be no changes in morphology.
Figure 2.
Endothelial cell (HUVEC) morphology as imaged with scanning electron microscopy after 5 days of (A) culture under conditions without added albumin, (B) exposure to nonglycated albumin at 8 weeks duration, or (C) glycated albumin at 8 weeks duration. A distinctly different morphology can be seen after exposure to glycated albumin at this long culture duration. Scale bars are (A, B, C) 100 μm or (C) 10 μm.
Endothelial Cell Metabolic Activity
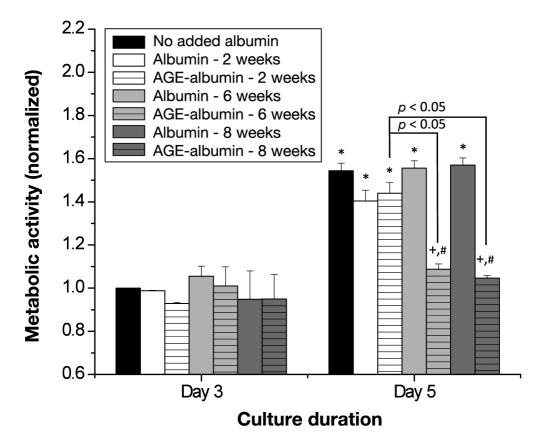
The metabolic activity of HUVECs in response to glycated albumin was measured. After 3 days, there were no differences in metabolic activity between any groups (Figure 3, n = 4–5 per condition). On day 5, there was an overall improvement in metabolic activity (as compared with day 3) for no added albumin conditions, any non-glycated sample, and 2-week glycated albumin. However, with the longer duration, there was no improvement in the metabolic activity for cells incubated with albumin exposed to glucose for 6 or 8 weeks, and this was significantly reduced as compared with all other conditions. Thus Figure 3 illustrates that the presence of albumin exposed to glucose for 6 or 8 weeks significantly impairs metabolic activity.
Figure 3.
Endothelial cell (HUVEC) metabolic activity as a function of culture duration and extent of albumin glycation. Metabolic activity was calculated from 2–3 samples from 4–5 independent experiments. Each bar represents the mean + standard error of the mean of the pooled data from each experiment. +, significantly different from no added albumin (paired by culture duration, two-way ANOVA, p < .05); *, significantly different from day 3 (paired by treatment, two-way ANOVA, p < .05); #, significantly different from nonglycated albumin (paired by culture duration, two-way ANOVA, p < .05).
Expression of Inflammatory and Thrombotic Mediators
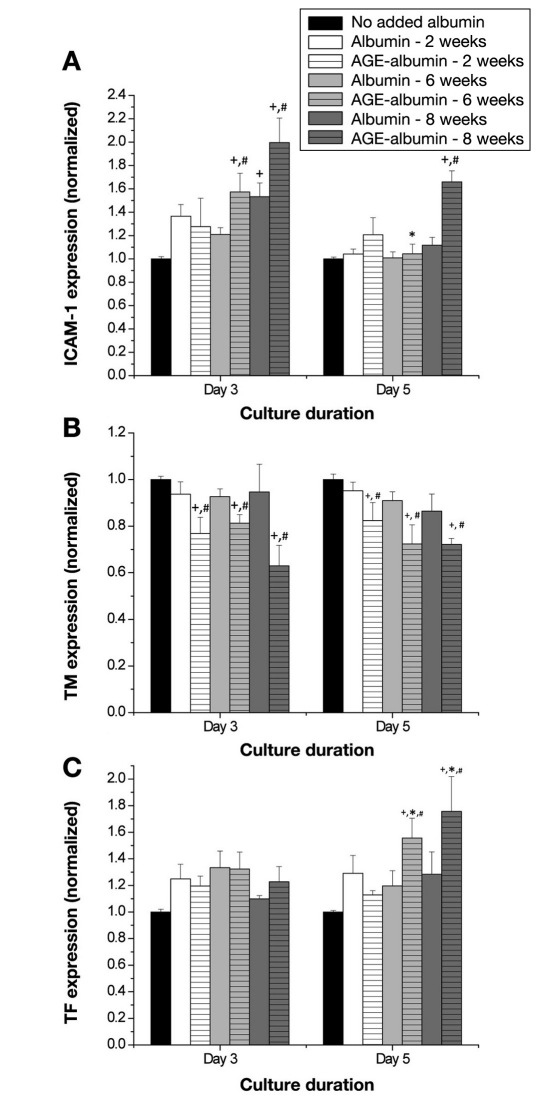
The surface expression of ICAM-1, thrombomodulin, and tissue factor was measured after exposure to glycated albumin. In the presence of albumin exposed to glucose for 8 weeks, the expression of ICAM-1 was significantly enhanced, independent of the culture duration (Figure 4A, n = 6 per condition for all panels), as compared to the no added albumin conditions. In the presence of albumin exposed to glucose to any extent, the expression of thrombomodulin was significantly decreased as compared to no added albumin conditions or the paired nonglycated albumin (Figure 4B). Similarly, there was an overall increase in the expression of tissue factor when HUVECs were exposed to albumin exposed to glucose for 6 or 8 weeks (Figure 4C). This increase was significant as compared with the no added albumin conditions, the paired nonglycated albumin samples, and the paired day 3 conditions. Thus Figure 4 illustrates that, in the presence of glycated albumin, there is an overall enhancement of inflammatory responses and thrombotic responses, and this was more prevalent in response to albumin exposed to glucose for longer durations.
Figure 4.
Endothelial cell (HUVEC) surface expression of (A) ICAM-1, (B) thrombomodulin, or (C) tissue factor as a function of culture duration and extent of albumin glycation. The surface expression of these molecules was calculated from duplicate wells for six independent experiments. Each bar represents the mean + standard error of the mean of the pooled data from each experiment. +, significantly different from no added albumin (paired by culture duration, two-way ANOVA, p < .05); *, significantly different from day 3 (paired by treatment, two-way ANOVA, p < .05); #, significantly different from nonglycated albumin (paired by culture duration, two-way ANOVA, p < .05); TM, thrombomodulin; TF, tissue factor.
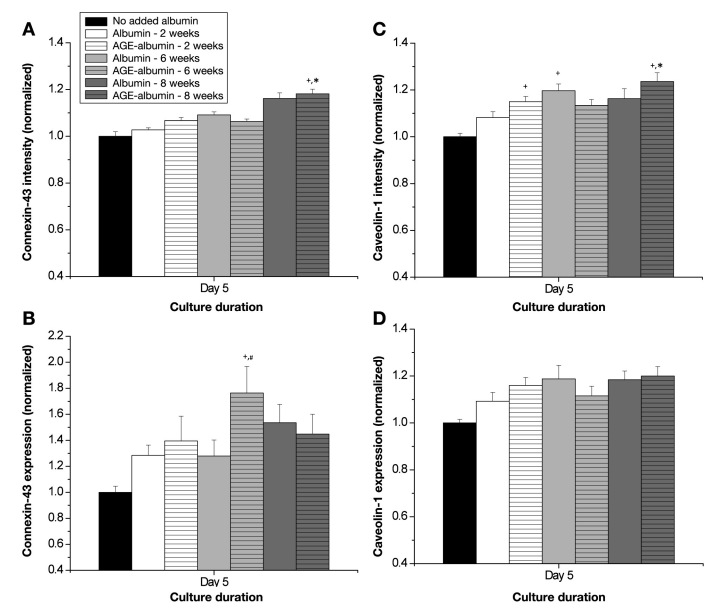
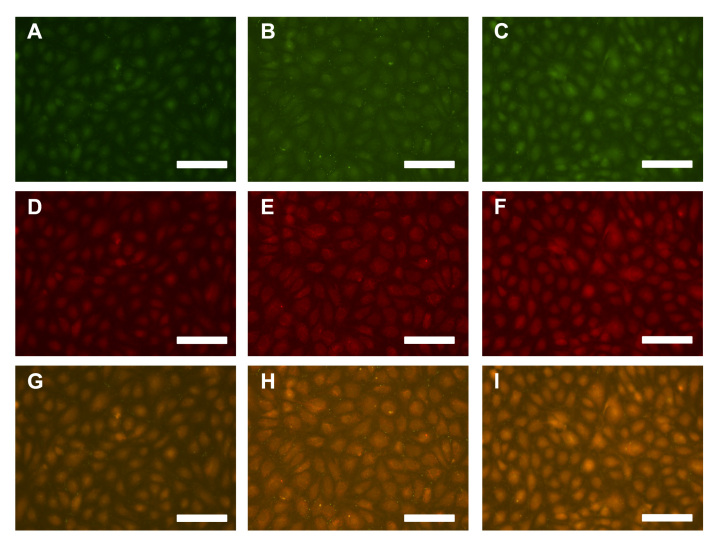
The expression of connexin-43 and caveolin-1 was also quantified. Overall, there were no trends in the expression of either marker, except for HUVECs incubated with albumin exposed to glucose for 8 weeks (Figure 5, n = 4–5 per condition). In general, there was a heightened intensity for both markers (Figures 5A and 5B), suggesting more of these markers are expressed, and there was a higher proportion of the localized expression of these markers (Figures 5C and 5D), suggesting that either active gap junctions or caveolae were forming. These data can be verified from merged digital images of connexin-43 expression and caveolin-1 expression (Figure 6). These images suggest that there is an overall increase in the localization of these markers after endothelial cells are incubated with albumin that was exposed to glucose for 8 weeks. Thus Figures 5 and 6 illustrate that there is a heightened potential for actively forming networks and angiogenesis (mediated by connexin-43 and caveolin-1) after the incubation with glycated albumin.
Figure 5.
Endothelial cell (HUVEC) surface expression of (A, B) connexin-43 or (C, D) caveolin-1 as a function of extent of albumin glycation. The surface expression of these molecules was calculated from 3–4 images for 4–5 independent experiments. Each bar represents the mean + standard error of the mean of the pooled data from each experiment. Intensity is a measure of the expression of these molecules, whereas expression is a measure of the localization of individual molecules to particular regions within the cell. +, significantly different from no added albumin (paired by culture duration, two-way ANOVA, p < .05); *, significantly different from day 3 (paired by treatment, two-way ANOVA, p < .05); #, significantly different from nonglycated albumin (paired by culture duration, two-way ANOVA, p < .05).
Figure 6.
Digital images of endothelial cells exposed to (A, D, G) no added albumin, (B, E, H) albumin glycated for 8 weeks, (C, F, I) or nonglycated albumin at 8 weeks for 5 days. The expression of (A, B, C) connexin-43 and (D, E, F) caveolin-1 were quantified as a means to determine changes in angiogenesis potential and gap junction formation (these images generated the data plotted in Figures 5A and 5B). (G, H, I) Merged images show where these markers were localized under these conditions and suggest that these were nature channels (these images were generated the data plotted in Figures 5C and 5D). All scale bars are 100μm.
Discussion
Viability and Density
The viability and density of endothelial cells that were exposed to glycated albumin for various durations was investigated (Figure 1). We showed that, with longer culture durations, there was a general decrease in viability and density for cells that were exposed to albumin exposed to glucose for 6 or 8 weeks, but not 2 weeks. In fact, there was no increase in cell density from 3 to 5 days in culture for cells that were exposed to later glycation. This is in agreement with previous studies that show an overall decrease in viability associated functions for endothelial cells exposed to glycated albumin.7,19,20 With a reduction in viability, we would anticipate a heightened potential for inflammatory and thrombotic responses to occur, and previous work has associated cardiovascular complications with these responses.21,22
Morphology
Using previously established methods,16,17 we quantified the morphology of HUVECs that were exposed to glycated albumin (Table 1). In conjunction with this, morphological changes were verified with scanning electron microscopy (Figure 2). In general, there was an altered percentage of elongated cells. In previous work, we have correlated changes in the percentage of elongated cells with angiogenesis potential.16 Scanning electron microscopy images verified these findings and showed a significantly altered morphology with longer glycation durations. Others showed that there is a degeneration in endothelial cell association with the extracellular matrix via adhesion molecules, which would induce morphology changes.23
Metabolic Activity
We measured an increase in metabolic activity with longer times in culture, except for albumin exposed to glucose for longer durations (Figure 3). These findings are in agreement with previous work that has shown that the metabolic activity of endothelial cells within a diabetic vasculature is reduced and that this can be reversed through the application of pharmacological agents.24 Combined, our data suggest that there is an overall impairment of endothelial cell culture in response to albumin exposed to glucose for longer durations.
Inflammatory and Thrombotic Responses
To relate the previous data to inflammatory and thrombotic responses, we measured the expression of ICAM-1, thrombomodulin, and tissue factor (Figure 4). We measured an enhanced expression of ICAM-1 and tissue factor after exposure to albumin exposed to glucose for longer durations, which would suggest that there is the potential for an enhanced inflammatory and/or thrombotic response.25,26 Both of these outcomes are hallmarks of cardiovascular diseases associated with diabetes. Furthermore, we saw a marked decrease in the expression of thrombomodulin, especially for cells incubated with albumin exposed to glucose for 6 or 8 weeks (Figure 4). With a decrease in thrombomodulin, we would anticipate an enhancement of the thrombotic response, once initiated. Others have shown that high glucose or animal models of diabetes are characterized by the same decrease in thrombomodulin expression.27,28
Using immunofluorescence microscopy, we imaged the expression of connexin-43 and caveolin-1 as markers of enhanced angiogenesis potential and mature communi-cation pathway formation. For the most part, there were no trends in the expression of these molecules; however, the incubation of endothelial cells with albumin exposed to glucose for 8 weeks typically induced the highest expression of these molecules (Figures 5 and 6). There has been some work on the expression of gap junction proteins during diabetes. So far, there seems to be no consensus; however, most of these studies have been carried out in varying cell types and under varying stimulation. For instance, endothelial cell connexin-40 expression has been shown to be downregulated under diabetic conditions, and this has been supported in astrocytes.29,30 Under hyperglycemic conditions, connexin-43 expression was reduced in the microvasculature.31 Others have shown an enhancement of gap junction expression under their particular conditions.32,33 Our data would suggest that the expression of connexin-43 is highly regulated under these conditions and is a function of glycation extent and exposure duration. Most of the caveolin-1 literature is in agreement with our data in that there is an overall upregulation of caveolin-1 in response to glycated albumin.34,35
Conclusions
Our goal was to determine changes in endothelial cell thrombotic response and inflammatory responses during exposure to glycated albumin. Here we show that there is an overall reduction in HUVEC viability, density, and metabolic activity. Furthermore, this was more prevalent for cells that were exposed to albumin exposed to glucose for longer durations. Intracellular adhesion molecule-1, tissue factor, connexin-43, and caveolin-1 expression were upregulated, while thrombomodulin expression was downregulated in response to the advanced glycated albumin. Combined, our data would suggest that, in the presence of albumin exposed to glucose for longer durations, there is an overall enhancement of the inflammatory and thrombotic responses, which may lead to enhanced cardiovascular complications associated with platelet–endothelial cell interactions. These observations are limited by the assumption that the glycated albumin that we form in vitro is similar to what would form under diabetic conditions.
Acknowledgments
Parts of this work were carried out in the Microscopy Laboratory, Oklahoma State University, which received funds for purchasing the equipment from the National Science Foundation Major Research Instrumentation Program.
Abbreviations
- (AGE)
advanced glycation end product
- (ANOVA)
analysis of variance
- (BSA)
bovine serum albumin
- (ELISA)
enzyme-linked immunosorbent assay
- (HUVEC)
human umbilical vein endothelial cell
- (ICAM-1)
intracellular adhesion molecule-1
- (MTT)
3-[4,5-dimethylthiazol- 2-yl]-2,5-diphenyl tetrazolium bromide
- (PBS)
phosphate-buffered saline
Funding:
The authors thank the Oklahoma Center for the Advancement of Science and Technology (award number HR09-158) for supporting this research.
References:
- 1.Harja E, Bu DX, Hudson BI, Chang JS, Shen X, Hallam K, Kalea AZ, Lu Y, Rosario RH, Oruganti S, Nikolla Z, Belov D, Lalla E, Ramasamy R, Yan SF, Schmidt AM. Vascular and inflammatory stresses mediate atherosclerosis via RAGE and its ligands in apoE-/- mice. J Clin Invest. 2008;118(1):183–194. doi: 10.1172/JCI32703. [DOI] [PMC free article] [PubMed] [Google Scholar]
- 2.Meng L, Park J, Cai Q, Lanting L, Reddy MA, Natarajan R. Diabetic conditions promote binding of monocytes to vascular smooth muscle cells and their subsequent differentiation. Am J Physiol Heart Circ Physiol. 2010;298(3):H736–H745. doi: 10.1152/ajpheart.00935.2009. [DOI] [PMC free article] [PubMed] [Google Scholar]
- 3.Zitman-Gal T, Green J, Pasmanik-Chor M, Oron-Karni V, Bernheim J. Endothelial pro-atherosclerotic response to extracellular diabetic-like environment: possible role of thioredoxin-interacting protein. Nephrol Dial Transplant. 2010;25(7):2141–2149. doi: 10.1093/ndt/gfp768. [DOI] [PubMed] [Google Scholar]
- 4.Yamagishi S, Matsui T, Ueda S, Nakamura K, Imaizumi T. Advanced glycation end products (AGEs) and cardiovascular disease (CVD) in diabetes. Cardiovasc Hematol Agents Med Chem. 2007;5(3):236–240. doi: 10.2174/187152507781058681. [DOI] [PubMed] [Google Scholar]
- 5.Cho SJ, Roman G, Yeboah F, Konishi Y. The road to advanced glycation end products: a mechanistic perspective. Curr Med Chem. 2007;14(15):1653–1671. doi: 10.2174/092986707780830989. [DOI] [PubMed] [Google Scholar]
- 6.Khalifah RG, Todd P, Booth AA, Yang SX, Mott JD, Hudson BG. Kinetics of nonenzymatic glycation of ribonuclease A leading to advanced glycation end products. Paradoxical inhibition by ribose leads to facile isolation of protein intermediate for rapid post-Amadori studies. Biochemistry. 1996;35(15):4645–4654. doi: 10.1021/bi9525942. [DOI] [PubMed] [Google Scholar]
- 7.Rubenstein DA, Morton BE, Yin W. The combined effects of sidestream smoke extracts and glycated serum albumin on endothelial cells and platelets. Cardiovasc Diabetol. 2010;9:28. doi: 10.1186/1475-2840-9-28. [DOI] [PMC free article] [PubMed] [Google Scholar]
- 8.Rubenstein DA, Yin W. Quantifying the effects of shear stress and shear exposure duration regulation on flow induced platelet activation and aggregation. J Thromb Thrombolysis. 2010;30(1):36–45. doi: 10.1007/s11239-009-0397-0. [DOI] [PubMed] [Google Scholar]
- 9.Puddu P, Muscari A, Puddu GM, Cravero E, Giannoni C, Zoli M. The complexity of platelet metabolism and its contribution to atherothrombosis. Acta Cardiol. 2009;64(2):157–165. doi: 10.2143/AC.64.2.2035338. [DOI] [PubMed] [Google Scholar]
- 10.Rubenstein DA, Yin W. Glycated albumin modulates platelet susceptibility to flow induced activation and aggregation. Platelets. 2009;20(3):206–215. doi: 10.1080/09537100902795492. [DOI] [PubMed] [Google Scholar]
- 11.Alexandru N, Popov D, Sbarcea A, Amuzescu M. Platelet free cytosolic calcium concentration during ageing of type 2 diabetic patients. Platelets. 2007;18(7):473–480. doi: 10.1080/09537100701507619. [DOI] [PubMed] [Google Scholar]
- 12.Hangaishi M, Taguchi J, Miyata T, Ikari Y, Togo M, Hashimoto Y, Watanabe T, Kimura S, Kurokawa K, Ohno M. Increased aggregation of human platelets produced by advanced glycation end products in vitro. Biochem Biophys Res Commun. 1998;248(2):285–292. doi: 10.1006/bbrc.1998.8945. [DOI] [PubMed] [Google Scholar]
- 13.Hasegawa Y, Suehiro A, Higasa S, Namba M, Kakishita E. Enhancing effect of advanced glycation end products on serotonin-induced platelet aggregation in patients with diabetes mellitus. Thromb Res. 2002;107(6):319–323. doi: 10.1016/s0049-3848(02)00348-1. [DOI] [PubMed] [Google Scholar]
- 14.Bierhaus A, Chevion S, Chevion M, Hofmann M, Quehenberger P, Illmer T, Luther T, Berentshtein E, Tritschler H, Müller M, Wahl P, Ziegler R, Nawroth PP. Advanced glycation end product-induced activation of NF-kappaB is suppressed by alpha-lipoic acid in cultured endothelial cells. Diabetes. 1997;46(9):1481–1490. doi: 10.2337/diab.46.9.1481. [DOI] [PubMed] [Google Scholar]
- 15.Li J, Schmidt AM. Characterization and functional analysis of the promoter of RAGE, the receptor for advanced glycation end products. J Biol Chem. 1997;272(26):16498–16506. doi: 10.1074/jbc.272.26.16498. [DOI] [PubMed] [Google Scholar]
- 16.Rubenstein D, Han D, Goldgraben S, El-Gendi H, Gouma PI, Frame MD. Bioassay chamber for angiogenesis with perfused explanted arteries and electrospun scaffolding. Microcirculation. 2007;14(7):723–737. doi: 10.1080/10739680701410173. [DOI] [PubMed] [Google Scholar]
- 17.Rubenstein DA, Venkitachalam SM, Zamfir D, Wang F, Lu H, Frame MD, Yin W. In vitro biocompatibility of sheath-core cellulose-acetate-based electrospun scaffolds towards endothelial cells and platelets. J Biomater Sci Polym Ed. 2010;21(13):1713–1736. doi: 10.1163/092050609X12559317149363. [DOI] [PubMed] [Google Scholar]
- 18.Araujo JC, Téran FC, Oliveira RA, Nour EA, Montenegro MA, Campos JR, Vazoller RF. Comparison of hexamethyldisilazane and critical point drying treatments for SEM analysis of anaerobic biofilms and granular sludge. J Electron Microsc (Tokyo) 2003;52(4):429–433. doi: 10.1093/jmicro/52.4.429. [DOI] [PubMed] [Google Scholar]
- 19.Beltramo E, Buttiglieri S, Pomero F, Allione A, D'Alù F, Ponte E, Porta M. A study of capillary pericyte viability on extracellular matrix produced by endothelial cells in high glucose. Diabetologia. 2003;46(3):409–415. doi: 10.1007/s00125-003-1043-6. [DOI] [PubMed] [Google Scholar]
- 20.Xu B, Chibber R, Ruggiero D, Kohner E, Ritter J, Ferro A. Impairment of vascular endothelial nitric oxide synthase activity by advanced glycation end products. FASEB J. 2003;17(10):1289–1291. doi: 10.1096/fj.02-0490fje. [DOI] [PubMed] [Google Scholar]
- 21.Cai W, Zhu L, Chen X, Uribarri J, Peppa M. Association of advanced glycoxidation end products and inflammation markers with thrombosis of arteriovenous grafts in hemodialysis patients. Am J Nephrol. 2006;26(2):181–185. doi: 10.1159/000093122. [DOI] [PubMed] [Google Scholar]
- 22.Sommeijer DW, Beganovic A, Schalkwijk CG, Ploegmakers H, van der Loos CM, van Aken BE, ten Cate H, van der Wal AC. More fibrosis and thrombotic complications but similar expression patterns of markers for coagulation and inflammation in symptomatic plaques from DM2 patients. J Histochem Cytochem. 2004;52(9):1141–1149. doi: 10.1369/jhc.3A6207.2004. [DOI] [PubMed] [Google Scholar]
- 23.Cohen MP, Hud E, Wu VY, Ziyadeh FN. Glycated albumin modified by Amadori adducts modulates aortic endothelial cell biology. Mol Cell Biochem. 1995;143(1):73–79. doi: 10.1007/BF00925929. [DOI] [PubMed] [Google Scholar]
- 24.Nascimento NR, Lessa LM, Kerntopf MR, Sousa CM, Alves RS, Queiroz MG, Price J, Heimark DB, Larner J, Du X, Brownlee M, Gow A, Davis C, Fonteles MC. Inositols prevent and reverse endothelial dysfunction in diabetic rat and rabbit vasculature metabolically and by scavenging superoxide. Proc Natl Acad Sci U S A. 2006;103(1):218–223. doi: 10.1073/pnas.0509779103. [DOI] [PMC free article] [PubMed] [Google Scholar]
- 25.Ettelaie C, Su S, Li C, Collier ME. Tissue factor-containing micro-particles released from mesangial cells in response to high glucose and AGE induce tube formation in microvascular cells. Microvasc Res. 2008;76(3):152–160. doi: 10.1016/j.mvr.2008.07.007. [DOI] [PubMed] [Google Scholar]
- 26.Roberts CK, Won D, Pruthi S, Lin SS, Barnard RJ. Effect of a diet and exercise intervention on oxidative stress, inflammation and monocyte adhesion in diabetic men. Diabetes Res Clin Pract. 2006;73(3):249–259. doi: 10.1016/j.diabres.2006.02.013. [DOI] [PubMed] [Google Scholar]
- 27.Sunagawa M, Shimada S, Hanashiro K, Nakamura M, Kosugi T. Elevation of intracellular cAMP up-regulated thrombomodulin mRNA in cultured vascular endothelial cells derived from spontaneous type-II diabetes mellitus model rat. Endothelium. 2006;13(5):325–333. doi: 10.1080/10623320600972051. [DOI] [PubMed] [Google Scholar]
- 28.Wang HJ, Huang HC, Chuang YC, Liao PJ, Yang DM, Yang WK, Huang H. Modulation of tissue factor and thrombomodulin expression in human aortic endothelial cells incubated with high glucose. Acta Diabetol. 2010 doi: 10.1007/s00592-010-0182-8. Epub ahead of print. [DOI] [PubMed] [Google Scholar]
- 29.Gandhi GK, Ball KK, Cruz NF, Dienel GA. Hyperglycaemia and diabetes impair gap junctional communication among astrocytes. ASN Neuro. 2010;2(2):e00030. doi: 10.1042/AN20090048. [DOI] [PMC free article] [PubMed] [Google Scholar]
- 30.Makino A, Platoshyn O, Suarez J, Yuan JX, Dillmann WH. Downregulation of connexin40 is associated with coronary endo-thelial cell dysfunction in streptozotocin-induced diabetic mice. Am J Physiol Cell Physiol. 2008;295(1):C221–C230. doi: 10.1152/ajpcell.00433.2007. [DOI] [PMC free article] [PubMed] [Google Scholar]
- 31.Sato T, Haimovici R, Kao R, Li AF, Roy S. Downregulation of connexin 43 expression by high glucose reduces gap junction activity in microvascular endothelial cells. Diabetes. 2002;51(5):1565–1571. doi: 10.2337/diabetes.51.5.1565. [DOI] [PubMed] [Google Scholar]
- 32.Abdullah KM, Luthra G, Bilski JJ, Abdullah SA, Reynolds LP, Redmer DA, Grazul-Bilska AT. Cell-to-cell communication and expression of gap junctional proteins in human diabetic and nondiabetic skin fibroblasts: effects of basic fibroblast growth factor. Endocrine. 1999;10(1):35–41. doi: 10.1385/ENDO:10:1:35. [DOI] [PubMed] [Google Scholar]
- 33.Zhang J, Hill CE. Differential connexin expression in preglomerular and postglomerular vasculature: accentuation during diabetes. Kidney Int. 2005;68(3):1171–1185. doi: 10.1111/j.1523-1755.2005.00509.x. [DOI] [PubMed] [Google Scholar]
- 34.Komers R, Schutzer WE, Reed JF, Lindsley JN, Oyama TT, Buck DC, Mader SL, Anderson S. Altered endothelial nitric oxide synthase targeting and conformation and caveolin-1 expression in the diabetic kidney. Diabetes. 2006;55(6):1651–1659. doi: 10.2337/db05-1595. [DOI] [PubMed] [Google Scholar]
- 35.Uyy E, Antohe F, Ivan L, Haraba R, Radu DL, Simionescu M. Upregulation of caveolin-1 expression is associated with structural modifications of endothelial cells in diabetic lung. Microvasc Res. 2010;79(2):154–159. doi: 10.1016/j.mvr.2009.11.008. [DOI] [PubMed] [Google Scholar]


