

Abstract
Bipolar disorder is a devastating illness that is marked by recurrent episodes of mania and depression. There is growing evidence that the disease is correlated with disruptions in synaptic plasticity cascades involved in cognition and mood regulation. Alleviating the symptoms of bipolar disorder involves chronic treatment with mood stabilizers like lithium or valproate. These two structurally dissimilar drugs are known to alter prominent signaling cascades in the hippocampus, but their effects on the postsynaptic density complex remain undefined. In this work, we utilized mass spectrometry for quantitative profiling of the rat hippocampal postsynaptic proteome to investigate the effects of chronic mood stabilizer treatment. Our data shows that in response to chronic treatment of mood stabilizers there were not gross qualitative changes but rather subtle quantitative perturbations in PSD proteome linked to several key signaling pathways. Our data specifically support the changes in actin dynamics on valproate treatment. Using label free quantification methods, we report that lithium and valproate significantly altered the abundance of 21 and 43 proteins, respectively. Seven proteins were affected similarly by both lithium and valproate: Ank3, Grm3, Dyhc1, and four isoforms of the 14-3-3 family. Immunoblotting the same samples confirmed the changes in Ank3 and Grm3 abundance. Our findings support the hypotheses that BPD is a synaptic disorder and that mood stabilizers modulate the protein signaling complex in the hippocampal PSD.
Keywords: Hippocampus, postsynapse, lithium, valproate, ankyrin 3, Grm3
Introduction
The hippocampus and related limbic structures are critical to regulating affect, stress responses, and cognition related to memory formation. Dysfunction in these brain regions is hypothesized to contribute to affective illnesses like bipolar disorder. Observational and functional studies have investigated the neuroanatomical differences in the hippocampus of bipolar patients, though few differences in overall structure and cell type distributions have been noted (Videbech & Ravnkilde 2004, Knable et al. 2004, Frazier et al. 2005). However, the two most prominent drugs used to treat the manic and depressive elements of bipolar disorder, lithium and valproate, have been shown to have a significant impact on the hippocampus in both preclinical and clinical studies. These mood stabilizers enhance the rate of hippocampal neurogenesis in rodents (Chen et al. 2000), patients (Yucel et al. 2007, Yucel et al. 2008), and can drastically alter prominent signaling cascades as well. Previous studies have shown that lithium and valproate alter prominent intracellular signaling pathways, including the glycogen synthase kinase-3 (GSK-3), extracellular regulated kinase (ERK), B-cell CLL/lymphoma 2 (Bcl-2) signaling cascade and the wnt/β-catenin pathway (Hunsberger et al. 2009). While it is unclear whether altering these signaling cascades can affect the overall hippocampal structure, there is evidence that significant changes emerge at the subcellular level, particularly at the neuronal synapse.
Located at neuronal terminals, the postsynaptic density (PSD) comprises a complex network of cytoskeletal scaffolding and signaling proteins that facilitate the movement of receptor and signaling proteins within the synaptic active zone (Sheng & Hoogenraad 2007). It is thought to facilitate many functions that are critical to interneuronal signaling and to reflect cellular response to external environmental changes (Emes et al. 2008). Metabotropic glutamate receptors (mGluRs) in the PSD control long term potentiation or depression, providing the mechanisms thought to underlie cognitive and mood processes (Luscher & Huber 2010). Dysfunction in plasticity cascades has been implicated in patients suffering from bipolar disorder, as well as many other psychiatric disorders, and the therapeutic basis of conventional and novel mood stabilizers may be mediated through improvements in synaptic plasticity regulation (Zarate et al. 2006, Coyle & Duman 2003). Observational studies have examined the composition of the postsynaptic complex in the rodent brain (Collins et al. 2006, Trinidad et al. 2006), but methods for quantitatively evaluating protein expression are still emerging (Dosemeci et al. 2007). The overarching remodeling of the postsynaptic protein complex following chronic treatment with mood stabilizers is unknown. In this work, we used mass spectrometry to quantitatively investigate the composition of the rat hippocampal postsynaptic complex and examined how this proteomic network is affected by chronic treatment with lithium and valproate.
Materials & Methods
Animals and treatment with mood stabilizers
8-week old male Wistar Kyoto rats (Taconic, Germantown, NY) were housed in pairs and treated for 5 weeks with either unmedicated chow (control group, n=12), or medicated chow containing either lithium carbonate (2.4 gm/kg, n=12) or sodium valproate (20 gm/kg, n=10) (BioServ, Frenchtown, NJ). All animals were housed in a facility with constant temperature (22 ± 1°C) and 12 h light/dark cycle with ad libitum access to food and water. An additional water bottle containing 0.9% saline solution was provided to ensure electrolyte balance was maintained throughout the experiment. All experimental procedures were approved by the Animal Use Committee of the National Institute of Mental Health and were conducted according to the NIH guidelines.
Isolation of hippocampal postsynaptic densities
The postsynaptic density (PSD) fraction was isolated from hippocampal tissue of rats that were housed in the same cage using procedures previously published (Carlin et al. 1980, Dosemeci et al. 2000). Hippocampi were rapidly collected, pooled from two animals so that there would be sufficient final PSD yield (~60–100 µg) for proteolysis and peptide fractionation. Tissue was immediately homogenized using a chilled glass Teflon homogenizer in ice-cold buffer (0.3 M mannitol, 1mM EDTA, protease inhibitor cocktail (Gamm et al. 2008)), omitting aprotinin due to observed interference with subsequent analyses (AEBSF 104 mM, bestatin HCL 4 mM, E-64 1.4 mM, leupeptin 2 mM, pepstatin 1.5 mM and phosphatase inhibitors I & II diluted 1:100, all from Sigma Aldrich St. Louis, MO). The homogenate was centrifuged at 3,000 × g for 10 min at 4°C (SS-34 rotor, Sorvall) to remove nuclei and cell debris. The resulting supernatant was saved and pellet was resuspended in another 3 mL ice cold mannitol buffer and centrifuged as above. Pooled supernatants were centrifuged at 26,900 × g for 30 min at 4°C. The pellet was resuspended again in 0.7 mL ice cold mannitol buffer and fractionated on a 6-tier Ficoll® gradient (20, 16, 12, 8, 2, 0%) and centrifuged for 90 min at 59,600 × g at 4°C (SW-60ti rotor, Beckman XL-90 Ultra).
The fractions between the 8–12% and 12–16% interfaces were first collected, pooled together, and then diluted 1:4 in 4 mL mannitol buffer. These combined fractions were centrifuged at 26,900 × g (SS-34 rotor) for 20 min at 4°C. The synaptosomal pellet was resuspended in 0.9 mL of a 20mM HEPES solution (pH 7.2) containing 0.5% Triton X-100 detergent (supplemented with protease and phosphatase I & II inhibitors(diluted 1:100 as recommended)). The suspension was centrifuged at 20,800 × g (Eppendorf 5417R) for 30 min at 4°C. The pellet was resuspended in 0.5 mL of HEPES buffer (containing 0.5% Triton X-100 and 75mM KCl) and centrifuged again at 20,800 × g for 30 min at 4°C. Finally, the enriched PSD pellet was resuspended in 0.2 mL detergent-free 20mM HEPES buffer. The protein concentration was estimated by BCA protein assay (Thermo Scientific, Rockford, IL) and aliquots were frozen at −80 °C.
Western Blotting
Immunoblotting was done using a standard protocol. Briefly, membranes were probed with the primary antibodies to Ankyrin G (1:100, NB20, EMD Biosciences, Gibbstown, NJ), Grm3 (1:300, sc-47137, Santa Cruz Biotechnology, Santa Cruz, CA) and PSD-95 (1:5,000, #4970, Cell Signaling, Beverley, MA). Protein bands were visualized using ECL Plus enhanced chemiluminescent signal detection kit (GE Healthcare) and exposed to Kodak Biolight film (Rochester, NY). When necessary, membranes were stripped using Re-Blot Plus (Millipore, Waltham, MA). Protein levels were normalized to a loading control (PSD-95) and subsequently analyzed by densitometric film analysis using AlphaImager software (Alpha Innotech, San Leandro, CA). GraphPad Prism software was used for statistics, performing one-way ANOVA with a post hoc Tukey (compares all columns) and individual t-tests (Control vs. Lithium, Control vs. Valproate).
Strong cation exchange chromatography
From each treatment group, three different PSD preparations of 50 µg proteins were denatured by 8 M urea at 60°C for 45 min. To reduce denatured PSD proteins, 1M DTT (final concentration 45 mM) was added and incubated at 60°C for 15 min. The proteins were alklyated by adding 1M iodoacetamide (final concentration 100mM) and incubating in the dark for 15 min. Subsequently, the PSD sample was digested by diluting from 8M to 1M urea concentration by adding 100 mM NH4HCO3 and sequencing grade trypsin (Promega, Madison WI) (substrate to enzyme ratio of 10:1(w/w)). The sample was digested at 37°C overnight. The digested samples were desalted using an UltraMicroSpin™ reverse phase column (The Nest Group Inc., Southboro, MA) according to the manufacturer’s instructions. The desalted sample was concentrated to dryness in vacuo (SpeedVac, Thermo-Savant). The dried peptides were resuspended in 100 µl of 10mM ammonium formate, 10mM formic acid, and 25% acetonitrile by vortexing and sonicating for 15 min respectively. The resuspended sample was then loaded onto the PolySULFOETHYL A column (1.0 mm × 50 mm, PolyLC Inc., Columbia, MD) to separate peptides by strong cation exchange chromatography. The composition of solution A was 10mM ammonium formate, 10mM formic acid, 25% acetonitrile; solution B contained 500mM ammonium formate, 500mm formic acid, 25 % acetonitrile. The peptides were separated by 12 nonlinear gradient steps of 3 min each at 100 µl/min flow rate. The fractions were collected every minute for a total of 36 fractions. The concentration of solution B in each step of the gradient was 0%, 1%, 3%, 5%, 7 %, 10 %, 15%, 20%, 30%, 50%, 70% and 100%, respectively. Each fraction was dried in vacuo and then re-suspended in nanopure water to remove volatile ammonium formate salts in vacuo. After three cycles of aqueous suspension and in vacuo drying, the peptides were re-suspended in 30ul of 5% acetonitrile, 0.1% formic acid before analyzing by mass spectrometry.
Mass spectrometry
Samples were separated on reverse phase nanocolumn (PicoFritBioBasicC18 column with 75-m inner diameter and 15-m tip, New Objective, Woburn, MA) at 500 nl/min, running a 60-minute linear gradient from 5 % to 80% acetonitrile on an Eksigent nano LC 2D HPLC system. The LC unit was coupled to Triversa Nanomate (Advion, Ithaca, NY) spray source attached to LTQ-Orbitrap (Thermo Electron, San Jose, CA). To minimize the variation in liquid chromatography between fractions, individual fractions from each treatment were run in a set. That is, replicates of fraction 1 from the SCX of the three treatment groups (nine samples) were analyzed on LC/MS as a single set. In each set, between every sample analyzed, one blank with a short LC cycle of 30 minutes was run to minimize peptide carry-over. All of the fractions from all replicates and conditions were analyzed, a total of 324 LC/MS runs. The peptides were analyzed in positive ion mode; for each MS scan, the top five most intense ions were selected for collision-induced dissociation and MS/MS recording. The collision energy was set at 35%. The resolution for MS was set at 60,000 and data was collected in a centroid mode.
Data analysis
Data were searched using MASCOT version 2.1 (Matrix Science, Boston MA) (Perkins et al. 1999). The data was searched against the Swiss-Prot database (version 57. 15.0, release date March 24 2009) with the species filter “mammals”. The other parameters were as follows: 1. Enzyme specificity: trypsin; 2. One allowed missed cleavage; 3. Fixed modification: cysteine carbamidomethylation; 4. Variable modification: methionine oxidation; 5. Precursor mass tolerance was ± 50 ppm; 6. Fragment ion mass tolerance was ±0.8 Da. The false discovery rate (FDR) for each sample set was determined with Mascot using a concatenated reversed sequence decoy database. Control 1: 0.63 % (11 decoy hits/ 1751 peptides), Control 2: 0.27 % (6 decoys/2184 peptides), Control 3: 0.35 % (8 decoys/2306 peptides), Lithium 1: 0.43% (10 decoys/ 2314 peptides), Lithium 2: 0.32% (9 decoys /2175 peptides), Lithium 3: 0.47% (11 decoys/2343 peptides), Valproate 1: 0.46% (10 decoys/2193 peptides), Valproate 2: 0.23% (6 decoys/2598 peptides) Valproate 3: 0.25% (6 decoys/2418 peptides). It should be noted that most reversed sequence decoy database hits were single spectra observations. As a result, the FDR calculated for spectral hits is lower than that for peptides (average FDR for all nine sample sets based on spectral hits is 0.07 ± 0.021%). The protein inference from the peptide search data was done by parsimony analysis (Yang et al. 2004) using the NCBI software MassSieve (Slotta et al. 2010). In MassSieve, all single peptide hits are removed and only peptide identifications with MASCOT ion scores greater than or equal to their identity scores and with probability scores less than 0.05 accepted. The net effect of this filtering is that the calculable peptide FDR drops to zero. We used a broad species filter because the rat database is incomplete, and then reviewed all mammalian proteins designated as equivalent (i.e., containing identical sets of peptides) (Liska & Shevchenko 2003, Junqueira et al. 2008). Using this strategy, protein identifications were assigned to the species rat by default, but wherever a rat homolog was not found, a secondary rodent species (mouse) was preferentially selected, followed by human and bovine, respectively. We included proteins only if there was at least one unique peptide (observed multiple times) identified in each of the groups (control, lithium, valproate) based on the criteria described above. Mass spectrometric data files (raw data files, data files from the MASCOT search engine, and the protein inference list from MassSieve) associated with this paper have been deposited in the NCBI Peptidome Repository for public access (Accession PSE 150) (http://www.ncbi.nlm.nih.gov/projects/peptidome/).
Protein quantification and statistical analyses
The software program suite DBparser 3.0 was used for the protein quantification as described previously (Dosemeci et al. 2007, McFarland et al. 2008). The program extracts retention time and peak intensities from MS1 raw data based on the precursor mass assigned by MASCOT. Proteins were quantified by summing the ion current intensities of all constituent peptides, and have not been normalized. The log2-fold change between treated and control was calculated by comparing average intensities from three replicates. Proteins that were not identified in all three replicates were not considered for quantification. A two tailed t-test and Cohen’s d effect size correlation was performed based on log2 transformed intensities. The p value cutoff of > 0.9, effect size of > ± 0.8, and log2-fold change of ± 0.8 was considered significant. The effect size (Cohen’s d) is the number of standard deviations difference between conditions. So, a Cohen’s d of 1.0 means there is a one standard deviation difference between conditions. Thus, the effect sizes take into account the size of the standard deviation for the variable in question.
Network Analysis
The networks, functional analyses, and canonical pathways were generated using Ingenuity Pathway Analysis (Ingenuity® Systems, http://www.ingenuity.com). The composite data of post synaptic density proteome used is the dataset reported in Supplementary Table 1.
Results
Composition of hippocampal post synaptic density proteome
We identified 605 proteins in the PSD of the rat hippocampus, based on concatenated data sets derived from nine sets of mass spectrometric analyses (3 conditions × 1/2 (6 paired hippocampi) × 36 SCX fractions, or 324 runs) (Supplementary Table 1). Of the total, 584 proteins (96.5%) were found in both treatment groups and control (but not necessarily in all three replicates), while 332 (55%) of the proteins were found in all of the replicates of all three groups. The functional classification of the proteins, shown in Supplementary Table 1, follows the format used previously in a comprehensive literature survey of PSD proteins (Collins et al. 2006). Based on this classification scheme, our PSD preparation was predominantly composed of signaling proteins (23%), cytoskeletal and cell adhesion (20%) and synaptic vesicle proteins (13%) (Figure 1) similar to those reported in the survey of PSD proteomics literature (Collins et al. 2006). In the Collins study, a consensus list of 466 proteins was compiled from seven different studies profiling the rodent post synaptic density proteome. From this consensus list, we found 424 proteins in our PSD preparation from rat hippocampus (data not shown). The overlap of our dataset list with the published PSD consensus list indicates that our preparations are relatively specific, and typical of sucrose density gradient purified postsynaptic fractions (Dosemeci et al. 2007). Trinidad et. al. reported 2159 proteins in PSD isolated from several regions of mouse brain. This higher number of PSD proteins may be attributed to improved instrumentation, synaptic heterogeneity, and/or sample quantity. The Trinidad study used tenfold higher amounts of purified PSD preparation (500 µg, tissues pooled from several animals) in their analyses compared to 50 µg in the current study (Trinidad et al. 2006).
Figure 1. Functional classification of proteins identified in hippocampal proteome.
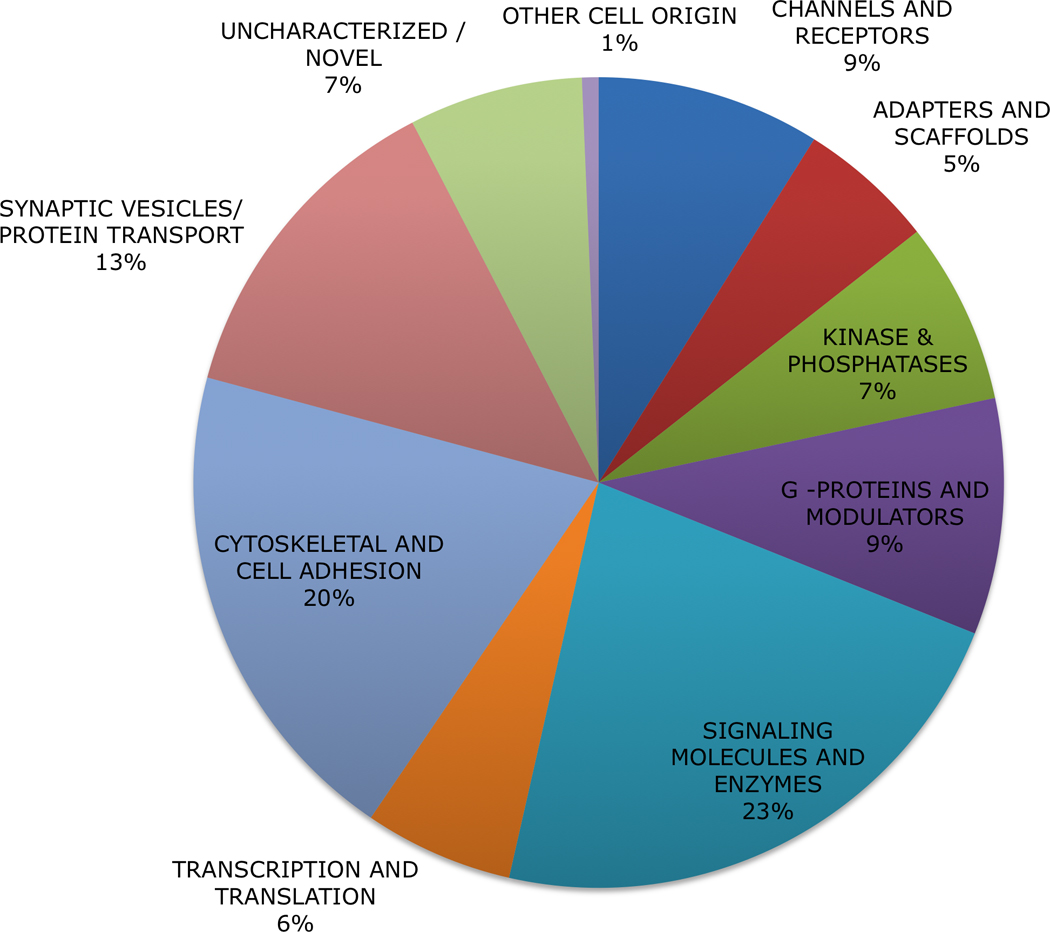
Ingenuity Pathway Analysis of 605 proteins detected by mass spectrometry were sorted based upon previously established functional categories (see Supplementary Table 1 for complete list).(Collins et al. 2006)
Effects of lithium and valproate on hippocampal postsynaptic proteome
We compared the changes in protein abundance at the postsynaptic density following chronic treatment with lithium or valproate. Based on our statistical criteria (see Materials and Methods), we found that lithium treatment significantly altered the level of 20 proteins (Table 1) (for complete list, see Supplementary Table 2) and valproate significantly affected abundance of 41 proteins (Table 2) (for complete list, see Supplementary Table 3). Seven proteins were significantly altered by both lithium and valproate treatment: metabotropic glutamate receptor 3 (Grm3), ankyrin 3 (Ank3), dynein heavy chain 1 (Dyhc1), and 14-3-3 protein isoforms T, F, E and Z. All seven proteins identified responded similarly, in direction and magnitude, to both mood stabilizers (Table 1 & 2 shown in bold letters). To validate these results, we performed immunoblotting experiments on three selected proteins Ank3 and Grm3 with the same nine PSD fraction sample sets (n=3/treatment group) that underwent mass spectrometry analysis (Figure 2). After testing for antibody specificity and linearity (data not shown), we confirmed that Grm3 and Ank3 abundance were increased, as expected in the PSD fraction by mood stabilizers (Figure 2).
Table 1. Comparison of protein abundance difference in synapse enriched fraction from hippocampus in lithium treated and non- treated animal.
Proteins that are significantly altered following chronic lithium treatment. 20 proteins were identified that were significantly altered following chronic lithium treatment. Criteria for significance were a p value cutoff of > 0.9, effect size of > ± 0.8, and log2-fold change of ± 0.8. Bold font indicates proteins whose expression is significantly affected by both lithium and valproate. Log2-fold changes greater than zero indicate increased expression in the treatment group, while values less than zero indicate decreases in expression. References are provided for proteins that have been previously implicated in relevant neurological and psychiatric diseases.
| Protein | Log2 fold change |
p value |
Disease function |
Description |
|---|---|---|---|---|
| IGSF8_MOUSE | 2.4 | 0.97 | Glioblastoma/ AD(Zhang et al. 2005) |
Implicated in neurite outgrowth and maintenance of neural networks. Overexpression is shown to inhibit glioblastoma invivo and invitro(Murdoch et al. 2003, Kolesnikova et al. 2009) |
| 1433T_RAT | 2.1 | 0.92 | Schz | Adapter protein |
| E41L3_MOUSE | 1.9 | 0.95 | Interacts with actin and spectrin and plays a role in recruitment of NMDARs to synaptic junctions(Hoy et al. 2009) |
|
| 1433F_RAT | 1.8 | 0.91 | Schz/BD | Adapter protein |
| PDE2A_RAT | 1.8 | 0.96 | Depression | Implicated in depression and elevated levels are shown in hippocampus and cerebellum on treatment of antidepressants(Esposito et al. 2009) |
| 1433E_RAT | 1.7 | 0.93 | Schz/BD | Adapter protein |
| 1433Z_RAT | 1.4 | 0.92 | Schz | Adapter protein |
| VA0D1_MOUSE | 1.4 | 0.98 | BD (Wellcome, 2007) |
ATP Synthetase |
| RIMB2_RAT | 1.2 | 0.90 | Regulation and coordination of synaptic vesicle trafficking and exocytosis(Hibino et al. 2002) |
|
| DYHC1_RAT | 1.1 | 0.97 | Motor protein | |
| GRM3_RAT | 1.0 | 0.93 | Schz | Metabotropic glutamate receptor 3 |
| QCR1_RAT | 0.8 | 0.99 | HD(Trushina & McMurray 2007) /Depression |
Level shown to be reduced in patients suffering with depression(Johnston-Wilson et al. 2000) |
| ANK3_HUMAN | 0.8 | 0.94 | BD |
Regulation of the assembly of voltage gated sodium channels |
| CAMKV_RAT | −0.8 | 0.94 | Signaling | |
| CSKI1_RAT | −0.8 | 0.92 | Forms tripartite complex of unknown function with CASK and neurexin-1 (Tabuchi et al. 2002) |
|
| CTNA2_MOUSE | −1.2 | 0.92 | BD (Wellcome, 2007)/PMN |
Regulator of synaptic remodeling and plays role in stability of dendritic spines and contacts(Abe et al. 2004) |
| RGRF1_RAT | −1.3 | 0.93 | Activation of Erk and cAMP signaling by coupling of NMDARs to Ras(Sepulveda et al. 2010) |
|
| TPIS_RAT | −1.5 | 0.98 | HD(Strand et al. 2005) | Glycolytic enzyme linked to inositol depletion during lithium treatment(Shi et al. 2005) |
| CCG8_RAT | −1.5 | 0.97 | Regulation and translocation of AMPA receptors on synaptic membranes(Rouach et al. 2005) |
Abbreviations: Alz, Alzheimer’s Disease; BD, Bipolar Disorder; HD, Huntington's Disease; PMN, progressive motor neuropathy; Schz, Schizophrenia.
Table 2. Comparison of protein abundance difference in synapse enriched fraction from hippocampus in valproate treated vs control rats.
Proteins that are significantly altered following chronic valproate treatment. 41 proteins were identified that were significantly altered following chronic valproate treatment. Criteria for significance were a p value cutoff of > 0.9, effect size of > ± 0.8, and log2-fold change of ± 0.8. Bold font indicates proteins where expression is significantly affected by both mood stabilizers. Log2-fold changes greater than zero indicate increased expression in the treatment group, while values less than zero indicate decreases in expression. References are provided for proteins that have been previously implicated in relevant neurological and psychiatric diseases. Abbreviations are same as in Table 1.
| Protein | Log2 fold change |
p value |
Disease function | Description |
|---|---|---|---|---|
| SHLB2_RAT | 3.0 | 0.97 | uncharacterized/novel | |
| MAP2_RAT | 2.6 | 1.00 | HD (Hodges et al. 2006)/BD | Reduced expression in hippocampus in individuals suffering with bipolar disorder(MacDonald et al. 2006) |
| AT2B1_RAT | 2.4 | 0.90 | HD(Luthi-Carter et al. 2000) | Calcium transport and homeostasis |
| PRDX1_RAT | 2.4 | 0.92 | AD(Cumming et al. 2007)/ BD (Wellcome, 2007) |
Redox regulation of cell. |
| HS12A_HUMAN | 2.0 | 1.00 | Schz | Expression is reduced in prefrontal cortex in patients suffering with schizophrenia(Pongrac et al. 2004) |
| NCDN_RAT | 1.9 | 0.97 | Epilepsy(Dateki et al. 2005) | Deletion results into epileptic seizures and may be negative regulator of CamKII(Dateki et al. 2005) |
| 1433T_RAT | 1.8 | 0.92 | Schz | Adapter protein |
| 1433F_RAT | 1.7 | 0.91 | Schz/BD | Adapter protein |
| 1433E_RAT | 1.5 | 0.93 | Schz/BD | Adapter protein |
| ADA23_MOUSE | 1.4 | 0.98 | Interacts with LGI1 and required for regulation of neurite growth(Owuor et al. 2009) |
|
| PSD3_MOUSE | 1.4 | 0.92 | Modulator/Guanine exchange factor for Arf6 | |
| CAPZB_RAT | 1.4 | 0.90 | Regulation of actin polymerization(Cooper & Schafer 2000) | |
| NSF_RAT | 1.3 | 0.96 | Schz(Hurko & Ryan 2005) | Regulated targeting of synaptic vesicles |
| CAZA1_RAT | 1.2 | 0.90 | Regulation of actin polymerization(Cooper & Schafer 2000) | |
| 1433Z_RAT | 1.2 | 0.94 | Schz | Adapter protein |
| DPYL2_RAT | 1.2 | 1.00 | BD/Schz/AD(Takata et al. 2009) | Implicated as common genetic marker between schizophrenia and bipolar disorder(Fallin et al. 2005) |
| RUFY3_RAT | 1.2 | 0.98 | Parkinson’s disease(Maraganore et al. 2005) |
Neuronal polarization(Mori et al. 2007) |
| PROF2_RAT | 1.2 | 0.94 | Schz(Hakak et al. 2001) | Actin polymerization(Pilo Boyl et al. 2007) |
| DYHC1_RAT | 1.2 | 0.97 | Motor protein | |
| NAC2_RAT | 1.1 | 0.99 | Calcium transport and homeostasis | |
| GRM2_RAT | 1.0 | 0.97 | Metabotropic glutamate receptor 2 | |
| COF1_RAT | 1.0 | 0.97 | Cytoskeleton protein/ disassembly of actin filaments(Bellenchi et al. 2007) |
|
| RL18_RAT | 1.0 | 0.92 | Ribosomal protein | |
| VATB2_RAT | 1.0 | 1.00 | HD(Strand et al. 2005)/ Schz(Hakak et al. 2001) | ATP synthesis and upregulated in dorsolateral prefrontal cortex in patients suffering with schizophrenia(Hakak et al. 2001) |
| MAP4_RAT | 0.9 | 0.97 | Parkinson’s disease(Fung et al. 2006) |
Microtubule associated protein |
| ANK3_HUMAN | 0.9 | 0.95 | BD |
Regulation of the assembly of voltage gated sodium channels |
| PHAR1_RAT | 0.9 | 0.93 | BD (Wellcome, 2007) | Protein phosphatase I and actin regulatory protein |
| SYT1_RAT | 0.8 | 0.99 | Schz(Hemby et al. 2002) | Calcium sensor for coordinated synaptic vesicle exocytosis. Expression is reduced in patients suffering with mesial temporal lobe epilepsy(Yang et al. 2006) |
| SNP25_RAT | 0.8 | 0.98 | BD/ Schz | Plays role in synaptic vesicle exocytosis and expression is found to be reduced in hippocampus of patients suffering with schizophrenia and bipolar disorder(Fatemi et al. 2001) |
| GBB1_RAT | 0.8 | 0.92 | HD(Abou-Sleymane et al. 2006)/ AD(Li et al. 2008) | Beta subunit of G-protein |
| GRM3_RAT | 0.8 | 0.96 | Schz | Metabotropic glutamate receptor 3 |
| GEPH_HUMAN | 0.8 | 0.94 | Hypereplexia | GABAergic and glycinergic inhibitory synapse. Form tripartite complex with neurolign-2 and collybistin(Poulopoulos et al. 2009) |
| IQEC3_RAT | −1.2 | 0.91 | Modulator/guanine exchange factor for Arf1 | |
| IP3KA_RAT | −1.4 | 0.94 | Activity of the enzyme is regulated by Ca+2 and calmodulin and plays role in calcium homeostasis(Xia & Yang 2005) |
|
| EFTU_RAT | −1.5 | 0.97 | Protein translation | |
| UN13A_RAT | −1.7 | 0.97 | ALS(Schymick et al. 2007) | Synaptic vesicle priming |
| ODO2_RAT | −1.8 | 0.95 | Mitochondrial enzyme | |
| NLGN2_RAT | −2.0 | 0.91 | GABAergic and glycinergic inhibitory synapse. Form tripartite complex with neurolign-2 and collybistin(Poulopoulos et al. 2009) |
|
| COX41_RAT | −2.0 | 0.98 | Mitochondrial enzyme | |
| NOE1_RAT | −2.3 | 1.00 | Schz | Uncharacterized/novel. Physically interacts with DISC-1(Camargo et al. 2007) |
| MYO6_MOUSE | −5.3 | 0.91 | Regulate the clathrin mediate endocytosis of AMPA(Osterweil et al. 2005) receptors(Camargo et al. 2007) |
Figure 2.
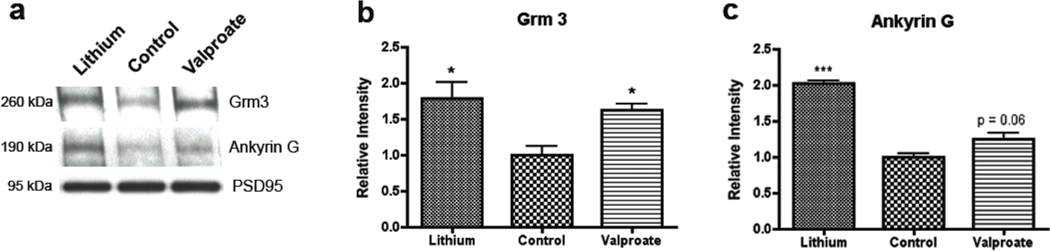
(a) Densitometry from immunoblotting was utilized to confirm quantitative values measured using mass spectrometry. Proteins were measured that were significantly affected by both lithium and valproate treatments and had commercially available antibodies. (b) Similar to spectrometry results, Western blotting showed significant increases in Grm3 expression in both treatment groups. (c) Levels of ankyrin 3 (ankyrin G) were significantly increased in the lithium treatment group, while they exhibited a trend in the valproate treatment (p=0.06, *p<0.05, ***p< 0.001.
Lithium and valproate specific quantitative changes in hippocampal PSD proteome
There are 13 additional protein concentrations that changed specifically in response to lithium as described in Table 1. These proteins are known from the literature to be implicated in different neurological and psychiatric disorders and are associated with different functions as indicated in the table. The quantitative changes in the protein phosphodiesterase Pde2a and the scaffolding protein Dlg1 are consistent with the observations made by others in the literature (Esposito et al. 2009, Sato et al. 2008) Valproate treatment has more robust effect on altering PSD protein levels in comparison with lithium. There are an additional 35 proteins whose abundance has changed on valproate treatment (Table 2): especially those in different functional categories like cytoskeletal (especially actin dynamics as discussed later), signaling proteins, enzymes, synaptic vesicles and transport. As shown in Table 2, many of these proteins have been implicated in various psychiatric and neurological disorders.
Network analyses
Functional assignment by Ingenuity Pathway Analysis of the 605 identified proteins showed the top five functions as cell-to-cell signaling, cellular organization, morphology, cellular transport, and cell signaling. The top five canonical pathways mapped were oxidative phosphorylation (38 proteins), CREB signaling in neurons (36 proteins), synaptic long term potentiation (28 proteins), glutamate receptor signaling (20 proteins), and calcium signaling (32 proteins). The enrichment of mitochondrial proteins in PSD preparation supports the assignment of oxidative phosphorylation as a top canonical pathway. Network analysis of non-canonical pathways is summarized in Supplementary Table 4, which includes the proteins in each network, their score, and the number of associated focus proteins identified. Ingenuity Pathway Analysis calculates a score for each network that indicates the likelihood that this set of focus genes in a network could be explained by random chance alone. The score is generated by taking into account the number of network eligible molecules, the size of the network, and the total number of molecules in the Ingenuity Knowledge Base that can be included in networks. The score is calculated using a right-tailed Fisher's Exact Test and is displayed as the negative log of that p-value. A score of 6 indicates that there is a 1 in million chance of deriving this network due to random chance.
Discussion
We set out to evaluate the composition of the hippocampal post-synaptic region and how two very different chronic mood stabilizer treatments affect its composition using an unbiased mass spectrometry-based proteomics approach. We found 584 proteins out of 605 proteins in the control and both treatment conditions. These results suggest that chronic lithium and valproate treatments do not promote synthesis or pruning of new protein families, but instead modulate significant increases or decreases in the abundance of proteins present in the postsynaptic proteome as defined by isolation methods commonly used in this field. Although this preparation is enriched with respect to histologically confirmed post-synaptic density proteins, there are some proteins co-isolated that are known to be presynaptic or mitochondrial in origin. The abundance of scaffolding proteins, with the exception of Dlg1 (Disks large homolog 1, or SAP97), did not change significantly following drug treatment (see Supplementary Table 5). The graphical comparison of the log2-fold changes of lithium vs. valproate treatment (Figure 3) reveals that most proteins are centered towards zero in all four quadrants. This suggests that mood stabilizer treatments lead to few, specific quantitative changes in the PSD proteome. Remarkably, there is not a single protein in this scatter plot analysis whose abundance is changed in opposite directions by the two drug treatments (see Quadrants 1 and 3 of Fig. 3) and there are few that show similar changes in abundance (see Quadrants 2 and 4). There are a significant number of proteins that show changes in abundance levels that are specific to either lithium or valproate treatment (points close to the X and Y axis in Fig. 3), suggesting differences in mechanism and pharmacology of these two drugs. The effectiveness of valproate on alteration of protein level, could also be due to its inhibitory action on histone deacetylase, which is thought to epigenetically repress transcription (Phiel et al. 2001, Gottlicher et al. 2001).
Figure 3. Scatter plot analysis of mass spectroscopy results.

A scatter plot analysis of the log2-fold change in expression of proteins identified in the PSD proteome whose expression is significantly altered following chronic mood stabilizer treatment. Red and yellow indicate proteins that show ± 0.8 log2 fold change and levels are changing in similar direction in both lithium and valproate treatment.
To get further insight, we analyzed our data set with Ingenuity Pathway Analysis to determine significant non-canonical networks of proteins and corresponding changes distinct to the valproate and lithium treatment. The top five networks identified with this analysis are detailed in Supplementary Table 4. Because it is known that valproate induces growth cone spreading and affects the actin polymerization leading to changes in growth cone morphology, the network illustrating that the abundance of 50 actin interacting proteins change on valproate treatment (Figure 4) is shown. The change in actin cytoskeleton is important for neuronal guidance and may be responsible for establishing new neuronal contacts resulting in changes in the neuronal circuit. In this network of proteins, Cof1(CFL1), Dpysl2, Phactr1, IP3KA (ITPKA) and E41L3 (EPB41L3) are involved in regulation of actin polymerization and dynamics (Figure 4). Though not mapped in Figure 4, Prof2 (1.2 log2-fold change, Table 2) is suggested to interact with the Wave1 complex at the synapse to control the actin polymerization (Pilo Boyl et al. 2007) while Cof1 is implicated in the disassembly of actin filaments (Bellenchi et al. 2007). The role of Dpysl2 is shown to be critical in axon formation and dendrite specification. It has been suggested Dpysl2 plays a role in transport of Sra-1/Wave1 complex to growth cones, augmenting the actin reorganization, and thereby inducing the axon outgrowth and formation (Kawano et al. 2005). The role of IP3KA in calcium transport is well known, but it also contains an F-actin binding domain. Kim et. al. showed that this actin binding domain (independent of IP3KA catalytic activity), regulates the remodeling of dendritic spine actin by the scaffolding Rac protein. (Kim et al. 2009). They also observed the accumulation of IP3KA in the synaptic area after induction of LTP. Phactr1 and E41L3 also physically interact with actin but their role in actin dynamics is still not very clear (Allen et al. 2004, Parra et al. 2000). The expression of E41L3 is significantly increased also on lithium treatment (Table 1). The actin capping protein Caza2 (CAPZA2), regulates the actin polymerization by binding to barbed ends of actin filament (Cooper & Schafer 2000). The loss of capping proteins reduces the cellular motility and their role may be “funneling,” i.e. to regulate actin polymerization at specific time and place (Cooper & Schafer 2000). Our quantitative and network analyses support the pathophysiology of neuronal remodeling and neurogenesis on valproate treatment.
Figure 4. Cellular Assembly and Organization, Cellular Function and Maintenance, Nervous System Development and Function.
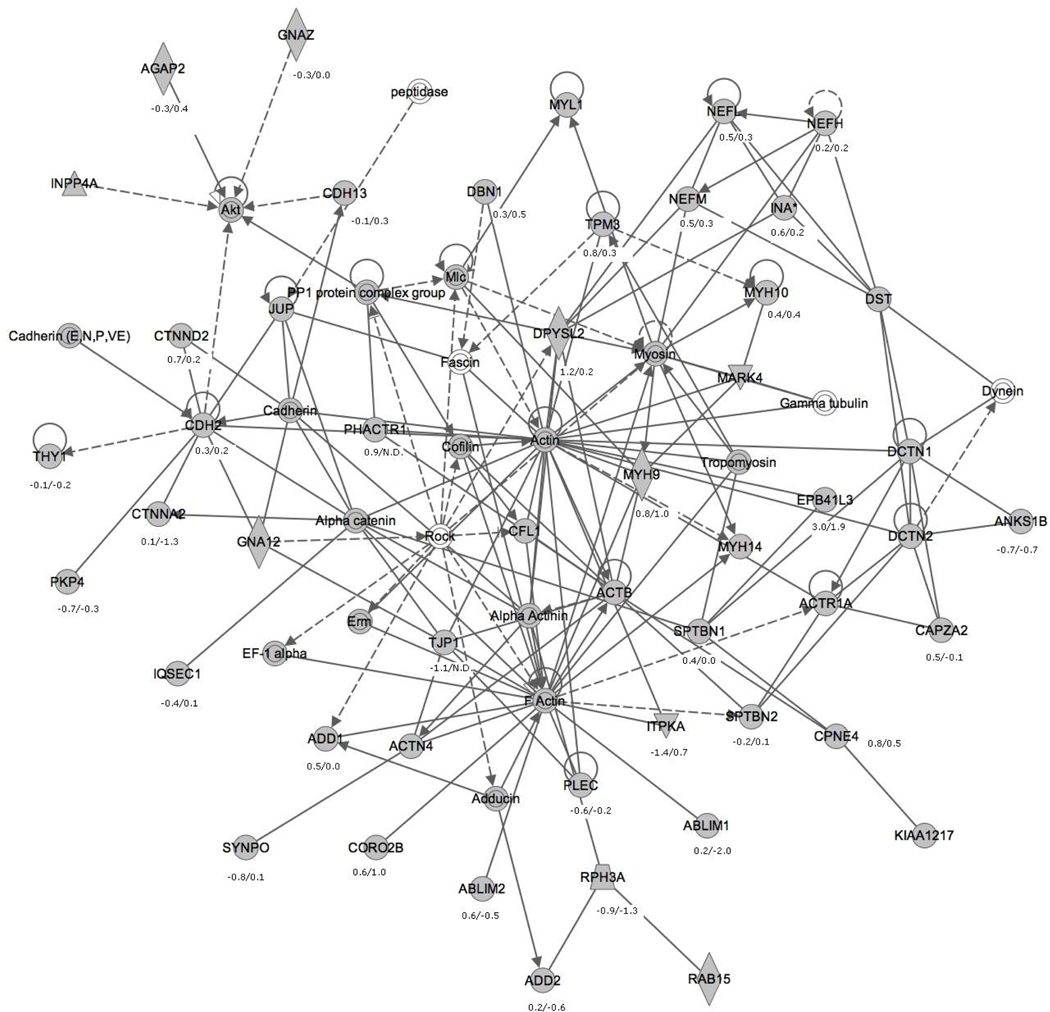
A non-canonical protein network inferred by Ingenuity Pathway Analysis as described in Results. A solid line with an arrow suggests direct interaction, whereas a dotted line with an arrow suggests indirect interaction; and a simple edge (without arrow) suggests binding only. Symbol legend: diamond, enzyme; concentric circles, complex/group; triangles, phosphatase/kinase; filled symbols, detected proteins; unfilled, not detected; numeric values are log2 vs. control valproate/lithium derived from Supplementary Tables 2 and 3. The network was assigned a probability score of 64, calculated using a right-tailed Fisher's Exact Test, and reported as the negative log of that p-value.
In lithium treated rats, the expression of the transmembrane protein Igfs8, belonging to immunoglobulin superfamily, increases prominently and significantly (2.5 log2-fold change). Igfs8 is expressed in adult brain and implicated in neurite outgrowth and maintenance of neural networks (Murdoch et al. 2003). Its expression is reduced in glioblastoma and its overexpression inhibits glioblastoma in vivo and in vitro (Kolesnikova et al. 2009). Our data is consistent with the observation that lithium has neuroprotective and neurotrophic effects. In Table 1, the reduced abundance of triose phosphate isomerase (TPIS) after lithium treatment is particularly notable. The therapeutic value of lithium has been attributed to the depletion of inositol in the human brain, although the molecular basis for this depletion is not completely clear. Shi et al. have shown that yeast with a mutation in the gene encoding triphosphate isomerase leads to hypersensitivity to lithium and valproate, inositol auxotrophy and accumulation of dihydroxyacetone phosphate (DHAP), an intermediate in the glycolytic pathway. The authors reasoned that accumulation of DHAP leads to competitive inhibition of myo-inositol phosphate 3 synthetase, which is a likely cause of inositol auxotrophy (Shi et al. 2005). Our data suggest that it is possible that a reduction in inositol during lithium treatment could be due to inhibition of the de novo biosynthetic pathway.
The seven proteins that changed in common after lithium and valproate treatment do not map to any single set of canonical or non-canonical pathways upon Ingenuity Pathway Analysis. However, the role of the 14-3-3 protein group has been implicated in psychiatric disorders previously. Middleton et al. have shown that expression of 14-3-3 gene group is decreased in patients suffering with schizophrenia (Middleton et al. 2005). In support of the transcriptomics data, Martins-de-Souza et al. showed the reduction in 14-3-3 zeta/delta, 14-3-3 gamma and 14-3-3 eta in patients suffering with schizophrenia using differential labeled quantitative proteomic technique (Martins-de-Souza et al. 2009). Two different studies have found evidence of association of two members of this group, 14-3-3F and 14-3-3E with bipolar disorder and schizophrenia (Grover et al. 2009, Ikeda et al. 2008). It was reported that lower levels of 14-3-3E showed developmental defects in hippocampal neurons (Ikeda et al. 2008).
Ankyrin 3 is an adapter protein that regulates the assembly of voltage gated sodium channels. Genome wide association studies (GWAS) have shown that the genetic variant of ANK3 (which encodes ankyrin 3) is significantly associated with risk of bipolar disorders (Phiel et al. 2001, Schulze et al. 2009). Some GWAS imply GRM3 (also known as mGluR3) genetic variants as risk factors for BPD and major depressive disorder (Kato 2007, Fallin et al. 2005). More studies are needed to explore causality between BPD and ANK3 or GRM3 genetic variants. The mGluR2/3 antagonist, LY-341495, increases mobility time in the forced swim test. The mGluR2/3 agonist, LY-379268, treatment mimics nicotine withdraw in induction of reward deficit monitored with intracranial self-stimulation reward thresholds. mGluR2/3 agonists, LY-379268 and LY-354740 attenuate amphetamine induced locomotion (Cartmell et al. 2000, Cartmell et al. 1999), an experimental model for mania and behavioral action of mood stabilizers. Our data suggests both lithium and valproate increase concentrations of Ank3 and mGluR3 in the PSD proteome, supporting the roles of these proteins in mood regulation.
In summary, we used a broad, discovery approach to profile the chronic effects of lithium and valproate on the post-synaptic density-enriched proteome isolated from rat hippocampus. The results support the multiple known protein networks of this synaptosomal preparation with regard to neuronal plasticity, and the notion that dysfunction of this synaptic proteome contributes to BPD and other major psychiatric illnesses. Further, we found that chronic treatment with mood stabilizers regulated levels of PSD proteome proteins linked to several key signaling pathways. Our data specifically support the changes in actin dynamics on valproate treatment. Lithium and valproate treatments increased levels of Ank3 and mGluR3 in the PSD proteome, supporting the roles of these two proteins in mood regulation. Future studies are required to test whether targeting Ank3 or mGluR3 produce lithium-like mood stabilizing effects in animal models and in BPD patients.
Supplementary Material
Acknowledgments
This work was supported by the Intramural Research Program of the National Institute of Mental Health, NIH (MH000274 and MH000279). The authors received significant advice and assistance from staff in LNT, especially Dr. Jeffrey Kowalak, Anthony J. Makusky, Jason Harrington, and Ronald Finnegan.
Footnotes
Disclosure: The authors report no biomedical financial interests or potential conflicts of interest. At the date of manuscript submission, Dr. Manji and Dr. Chen are employees of Johnson and Johnson Pharmaceutical Research and Development, Titusville, NJ; Dr. Catapano is an employee of George Washington University, Washington, DC, and Dr. Nanavati is an employee of Northwestern University, Evanston, IL. This work was initiated while they were employees of the NIMH.
References
- Abe K, Chisaka O, Van Roy F, Takeichi M. Stability of dendritic spines and synaptic contacts is controlled by alpha N-catenin. Nat Neurosci. 2004;7:357–363. doi: 10.1038/nn1212. [DOI] [PubMed] [Google Scholar]
- Abou-Sleymane G, Chalmel F, Helmlinger D, et al. Polyglutamine expansion causes neurodegeneration by altering the neuronal differentiation program. Hum Mol Genet. 2006;15:691–703. doi: 10.1093/hmg/ddi483. [DOI] [PubMed] [Google Scholar]
- Allen PB, Greenfield AT, Svenningsson P, Haspeslagh DC, Greengard P. Phactrs 1–4: A family of protein phosphatase 1 and actin regulatory proteins. Proc Natl Acad Sci U S A. 2004;101:7187–7192. doi: 10.1073/pnas.0401673101. [DOI] [PMC free article] [PubMed] [Google Scholar]
- Bellenchi GC, Gurniak CB, Perlas E, Middei S, Ammassari-Teule M, Witke W. N-cofilin is associated with neuronal migration disorders and cell cycle control in the cerebral cortex. Genes Dev. 2007;21:2347–2357. doi: 10.1101/gad.434307. [DOI] [PMC free article] [PubMed] [Google Scholar]
- Camargo LM, Collura V, Rain JC, Mizuguchi K, Hermjakob H, Kerrien S, Bonnert TP, Whiting PJ, Brandon NJ. Disrupted in Schizophrenia 1 Interactome: evidence for the close connectivity of risk genes and a potential synaptic basis for schizophrenia. Mol Psychiatry. 2007;12:74–86. doi: 10.1038/sj.mp.4001880. [DOI] [PubMed] [Google Scholar]
- Carlin RK, Grab DJ, Cohen RS, Siekevitz P. Isolation and characterization of postsynaptic densities from various brain regions: enrichment of different types of postsynaptic densities. J Cell Biol. 1980;86:831–845. doi: 10.1083/jcb.86.3.831. [DOI] [PMC free article] [PubMed] [Google Scholar]
- Cartmell J, Monn JA, Schoepp DD. The metabotropic glutamate 2/3 receptor agonists LY354740 and LY379268 selectively attenuate phencyclidine versus d-amphetamine motor behaviors in rats. J Pharmacol Exp Ther. 1999;291:161–170. [PubMed] [Google Scholar]
- Cartmell J, Monn JA, Schoepp DD. The mGlu(2/3) receptor agonist LY379268 selectively blocks amphetamine ambulations and rearing. Eur J Pharmacol. 2000;400:221–224. doi: 10.1016/s0014-2999(00)00423-4. [DOI] [PubMed] [Google Scholar]
- Chen G, Rajkowska G, Du F, Seraji-Bozorgzad N, Manji HK. Enhancement of hippocampal neurogenesis by lithium. J Neurochem. 2000;75:1729–1734. doi: 10.1046/j.1471-4159.2000.0751729.x. [DOI] [PubMed] [Google Scholar]
- Collins MO, Husi H, Yu L, Brandon JM, Anderson CN, Blackstock WP, Choudhary JS, Grant SG. Molecular characterization and comparison of the components and multiprotein complexes in the postsynaptic proteome. J Neurochem. 2006;(97 Suppl 1):16–23. doi: 10.1111/j.1471-4159.2005.03507.x. [DOI] [PubMed] [Google Scholar]
- Cooper JA, Schafer DA. Control of actin assembly and disassembly at filament ends. Curr Opin Cell Biol. 2000;12:97–103. doi: 10.1016/s0955-0674(99)00062-9. [DOI] [PubMed] [Google Scholar]
- Coyle JT, Duman RS. Finding the intracellular signaling pathways affected by mood disorder treatments. Neuron. 2003;38:157–160. doi: 10.1016/s0896-6273(03)00195-8. [DOI] [PubMed] [Google Scholar]
- Cumming RC, Dargusch R, Fischer WH, Schubert D. Increase in expression levels and resistance to sulfhydryl oxidation of peroxiredoxin isoforms in amyloid beta-resistant nerve cells. J Biol Chem. 2007;282:30523–30534. doi: 10.1074/jbc.M700869200. [DOI] [PubMed] [Google Scholar]
- Dateki M, Horii T, Kasuya Y, et al. Neurochondrin negatively regulates CaMKII phosphorylation, and nervous system-specific gene disruption results in epileptic seizure. J Biol Chem. 2005;280:20503–20508. doi: 10.1074/jbc.M414033200. [DOI] [PubMed] [Google Scholar]
- Dosemeci A, Makusky AJ, Jankowska-Stephens E, Yang X, Slotta DJ, Markey SP. Composition of the synaptic PSD-95 complex. Mol Cell Proteomics. 2007;6:1749–1760. doi: 10.1074/mcp.M700040-MCP200. [DOI] [PMC free article] [PubMed] [Google Scholar]
- Dosemeci A, Reese TS, Petersen J, Tao-Cheng JH. A novel particulate form of Ca(2+)/calmodulin-dependent [correction of Ca(2+)/CaMKII-dependent] protein kinase II in neurons. J Neurosci. 2000;20:3076–3084. doi: 10.1523/JNEUROSCI.20-09-03076.2000. [DOI] [PMC free article] [PubMed] [Google Scholar]
- Emes RD, Pocklington AJ, Anderson CN, et al. Evolutionary expansion and anatomical specialization of synapse proteome complexity. Nat Neurosci. 2008;11:799–806. doi: 10.1038/nn.2135. [DOI] [PMC free article] [PubMed] [Google Scholar]
- Esposito K, Reierson GW, Luo HR, Wu GS, Licinio J, Wong ML. Phosphodiesterase genes and antidepressant treatment response: a review. Ann Med. 2009;41:177–185. doi: 10.1080/07853890802441169. [DOI] [PubMed] [Google Scholar]
- Fallin MD, Lasseter VK, Avramopoulos D, et al. Bipolar I disorder and schizophrenia: a 440-single-nucleotide polymorphism screen of 64 candidate genes among Ashkenazi Jewish case-parent trios. Am J Hum Genet. 2005;77:918–936. doi: 10.1086/497703. [DOI] [PMC free article] [PubMed] [Google Scholar]
- Fatemi SH, Earle JA, Stary JM, Lee S, Sedgewick J. Altered levels of the synaptosomal associated protein SNAP-25 in hippocampus of subjects with mood disorders and schizophrenia. Neuroreport. 2001;12:3257–3262. doi: 10.1097/00001756-200110290-00023. [DOI] [PubMed] [Google Scholar]
- Frazier JA, Chiu S, Breeze JL, et al. Structural brain magnetic resonance imaging of limbic and thalamic volumes in pediatric bipolar disorder. Am J Psychiatry. 2005;162:1256–1265. doi: 10.1176/appi.ajp.162.7.1256. [DOI] [PubMed] [Google Scholar]
- Fung HC, Scholz S, Matarin M, et al. Genome-wide genotyping in Parkinson's disease and neurologically normal controls: first stage analysis and public release of data. Lancet Neurol. 2006;5:911–916. doi: 10.1016/S1474-4422(06)70578-6. [DOI] [PubMed] [Google Scholar]
- Gamm DM, Melvan JN, Shearer RL, Pinilla I, Sabat G, Svendsen CN, Wright LS. A novel serum-free method for culturing human prenatal retinal pigment epithelial cells. Invest Ophthalmol Vis Sci. 2008;49:788–799. doi: 10.1167/iovs.07-0777. [DOI] [PubMed] [Google Scholar]
- Gottlicher M, Minucci S, Zhu P, et al. Valproic acid defines a novel class of HDAC inhibitors inducing differentiation of transformed cells. EMBO J. 2001;20:6969–6978. doi: 10.1093/emboj/20.24.6969. [DOI] [PMC free article] [PubMed] [Google Scholar]
- Grover D, Verma R, Goes FS, Mahon PL, Gershon ES, McMahon FJ, Potash JB. Family-based association of YWHAH in psychotic bipolar disorder. Am J Med Genet B Neuropsychiatr Genet. 2009;150B:977–983. doi: 10.1002/ajmg.b.30927. [DOI] [PMC free article] [PubMed] [Google Scholar]
- Hakak Y, Walker JR, Li C, Wong WH, Davis KL, Buxbaum JD, Haroutunian V, Fienberg AA. Genome-wide expression analysis reveals dysregulation of myelination-related genes in chronic schizophrenia. Proc Natl Acad Sci U S A. 2001;98:4746–4751. doi: 10.1073/pnas.081071198. [DOI] [PMC free article] [PubMed] [Google Scholar]
- Hemby SE, Ginsberg SD, Brunk B, Arnold SE, Trojanowski JQ, Eberwine JH. Gene expression profile for schizophrenia: discrete neuron transcription patterns in the entorhinal cortex. Arch Gen Psychiatry. 2002;59:631–640. doi: 10.1001/archpsyc.59.7.631. [DOI] [PubMed] [Google Scholar]
- Hibino H, Pironkova R, Onwumere O, Vologodskaia M, Hudspeth AJ, Lesage F. RIM binding proteins (RBPs) couple Rab3-interacting molecules (RIMs) to voltage-gated Ca(2+) channels. Neuron. 2002;34:411–423. doi: 10.1016/s0896-6273(02)00667-0. [DOI] [PMC free article] [PubMed] [Google Scholar]
- Hodges A, Strand AD, Aragaki AK, et al. Regional and cellular gene expression changes in human Huntington's disease brain. Hum Mol Genet. 2006;15:965–977. doi: 10.1093/hmg/ddl013. [DOI] [PubMed] [Google Scholar]
- Hoy JL, Constable JR, Vicini S, Fu Z, Washbourne P. SynCAM1 recruits NMDA receptors via protein 4.1B. Mol Cell Neurosci. 2009;42:466–483. doi: 10.1016/j.mcn.2009.09.010. [DOI] [PMC free article] [PubMed] [Google Scholar]
- Hunsberger J, Austin DR, Henter ID, Chen G. The neurotrophic and neuroprotective effects of psychotropic agents. Dialogues Clin Neurosci. 2009;11:333–348. doi: 10.31887/DCNS.2009.11.3/jhunsberger. [DOI] [PMC free article] [PubMed] [Google Scholar]
- Hurko O, Ryan JL. Translational research in central nervous system drug discovery. NeuroRx. 2005;2:671–682. doi: 10.1602/neurorx.2.4.671. [DOI] [PMC free article] [PubMed] [Google Scholar]
- Ikeda M, Hikita T, Taya S, et al. Identification of YWHAE, a gene encoding 14-3-3epsilon, as a possible susceptibility gene for schizophrenia. Hum Mol Genet. 2008;17:3212–3222. doi: 10.1093/hmg/ddn217. [DOI] [PubMed] [Google Scholar]
- Johnston-Wilson NL, Sims CD, Hofmann JP, Anderson L, Shore AD, Torrey EF, Yolken RH. Disease-specific alterations in frontal cortex brain proteins in schizophrenia, bipolar disorder, and major depressive disorder. The Stanley Neuropathology Consortium. Mol Psychiatry. 2000;5:142–149. doi: 10.1038/sj.mp.4000696. [DOI] [PubMed] [Google Scholar]
- Junqueira M, Spirin V, Balbuena TS, Thomas H, Adzhubei I, Sunyaev S, Shevchenko A. Protein identification pipeline for the homology-driven proteomics. J Proteomics. 2008;71:346–356. doi: 10.1016/j.jprot.2008.07.003. [DOI] [PMC free article] [PubMed] [Google Scholar]
- Kato T. Molecular genetics of bipolar disorder and depression. Psychiatry Clin Neurosci. 2007;61:3–19. doi: 10.1111/j.1440-1819.2007.01604.x. [DOI] [PubMed] [Google Scholar]
- Kawano Y, Yoshimura T, Tsuboi D, Kawabata S, Kaneko-Kawano T, Shirataki H, Takenawa T, Kaibuchi K. CRMP-2 is involved in kinesin-1-dependent transport of the Sra-1/WAVE1 complex and axon formation. Mol Cell Biol. 2005;25:9920–9935. doi: 10.1128/MCB.25.22.9920-9935.2005. [DOI] [PMC free article] [PubMed] [Google Scholar]
- Kim IH, Park SK, Hong ST, et al. Inositol 1,4,5-trisphosphate 3-kinase a functions as a scaffold for synaptic Rac signaling. J Neurosci. 2009;29:14039–14049. doi: 10.1523/JNEUROSCI.2483-09.2009. [DOI] [PMC free article] [PubMed] [Google Scholar]
- Knable MB, Barci BM, Webster MJ, Meador-Woodruff J, Torrey EF. Molecular abnormalities of the hippocampus in severe psychiatric illness: postmortem findings from the Stanley Neuropathology Consortium. Mol Psychiatry. 2004;9:609–620. doi: 10.1038/sj.mp.4001471. 544. [DOI] [PubMed] [Google Scholar]
- Kolesnikova TV, Kazarov AR, Lemieux ME, Lafleur MA, Kesari S, Kung AL, Hemler ME. Glioblastoma inhibition by cell surface immunoglobulin protein EWI-2, in vitro and in vivo. Neoplasia. 2009;11:77–86. doi: 10.1593/neo.81180. 74p following 86. [DOI] [PMC free article] [PubMed] [Google Scholar]
- Li H, Wetten S, Li L, et al. Candidate single-nucleotide polymorphisms from a genomewide association study of Alzheimer disease. Arch Neurol. 2008;65:45–53. doi: 10.1001/archneurol.2007.3. [DOI] [PubMed] [Google Scholar]
- Liska AJ, Shevchenko A. Expanding the organismal scope of proteomics: cross-species protein identification by mass spectrometry and its implications. Proteomics. 2003;3:19–28. doi: 10.1002/pmic.200390004. [DOI] [PubMed] [Google Scholar]
- Luscher C, Huber KM. Group 1 mGluR-dependent synaptic long-term depression: mechanisms and implications for circuitry and disease. Neuron. 2010;65:445–459. doi: 10.1016/j.neuron.2010.01.016. [DOI] [PMC free article] [PubMed] [Google Scholar]
- Luthi-Carter R, Strand A, Peters NL, et al. Decreased expression of striatal signaling genes in a mouse model of Huntington's disease. Hum Mol Genet. 2000;9:1259–1271. doi: 10.1093/hmg/9.9.1259. [DOI] [PubMed] [Google Scholar]
- MacDonald ML, Naydenov A, Chu M, Matzilevich D, Konradi C. Decrease in creatine kinase messenger RNA expression in the hippocampus and dorsolateral prefrontal cortex in bipolar disorder. Bipolar Disord. 2006;8:255–264. doi: 10.1111/j.1399-5618.2006.00302.x. [DOI] [PMC free article] [PubMed] [Google Scholar]
- Maraganore DM, de Andrade M, Lesnick TG, et al. High-resolution whole-genome association study of Parkinson disease. Am J Hum Genet. 2005;77:685–693. doi: 10.1086/496902. [DOI] [PMC free article] [PubMed] [Google Scholar]
- Martins-de-Souza D, Gattaz WF, Schmitt A, Rewerts C, Marangoni S, Novello JC, Maccarrone G, Turck CW, Dias-Neto E. Alterations in oligodendrocyte proteins, calcium homeostasis and new potential markers in schizophrenia anterior temporal lobe are revealed by shotgun proteome analysis. J Neural Transm. 2009;116:275–289. doi: 10.1007/s00702-008-0156-y. [DOI] [PubMed] [Google Scholar]
- McFarland MA, Ellis CE, Markey SP, Nussbaum RL. Proteomics analysis identifies phosphorylation-dependent alpha-synuclein protein interactions. Mol Cell Proteomics. 2008;7:2123–2137. doi: 10.1074/mcp.M800116-MCP200. [DOI] [PMC free article] [PubMed] [Google Scholar]
- Middleton FA, Peng L, Lewis DA, Levitt P, Mirnics K. Altered expression of 14-3-3 genes in the prefrontal cortex of subjects with schizophrenia. Neuropsychopharmacology. 2005;30:974–983. doi: 10.1038/sj.npp.1300674. [DOI] [PubMed] [Google Scholar]
- Mori T, Wada T, Suzuki T, Kubota Y, Inagaki N. Singar1, a novel RUN domain-containing protein, suppresses formation of surplus axons for neuronal polarity. J Biol Chem. 2007;282:19884–19893. doi: 10.1074/jbc.M700770200. [DOI] [PubMed] [Google Scholar]
- Murdoch JN, Doudney K, Gerrelli D, Wortham N, Paternotte C, Stanier P, Copp AJ. Genomic organization and embryonic expression of Igsf8, an immunoglobulin superfamily member implicated in development of the nervous system and organ epithelia. Mol Cell Neurosci. 2003;22:62–74. doi: 10.1016/s1044-7431(02)00021-0. [DOI] [PubMed] [Google Scholar]
- Osterweil E, Wells DG, Mooseker MS. A role for myosin VI in postsynaptic structure and glutamate receptor endocytosis. J Cell Biol. 2005;168:329–338. doi: 10.1083/jcb.200410091. [DOI] [PMC free article] [PubMed] [Google Scholar]
- Owuor K, Harel NY, Englot DJ, Hisama F, Blumenfeld H, Strittmatter SM. LGI1-associated epilepsy through altered ADAM23-dependent neuronal morphology. Mol Cell Neurosci. 2009;42:448–457. doi: 10.1016/j.mcn.2009.09.008. [DOI] [PMC free article] [PubMed] [Google Scholar]
- Parra M, Gascard P, Walensky LD, et al. Molecular and functional characterization of protein 4.1B, a novel member of the protein 4.1 family with high level, focal expression in brain. J Biol Chem. 2000;275:3247–3255. doi: 10.1074/jbc.275.5.3247. [DOI] [PubMed] [Google Scholar]
- Perkins DN, Pappin DJ, Creasy DM, Cottrell JS. Probability-based protein identification by searching sequence databases using mass spectrometry data. Electrophoresis. 1999;20:3551–3567. doi: 10.1002/(SICI)1522-2683(19991201)20:18<3551::AID-ELPS3551>3.0.CO;2-2. [DOI] [PubMed] [Google Scholar]
- Phiel CJ, Zhang F, Huang EY, Guenther MG, Lazar MA, Klein PS. Histone deacetylase is a direct target of valproic acid, a potent anticonvulsant, mood stabilizer, and teratogen. J Biol Chem. 2001;276:36734–36741. doi: 10.1074/jbc.M101287200. [DOI] [PubMed] [Google Scholar]
- Pilo Boyl P, Di Nardo A, Mulle C, et al. Profilin2 contributes to synaptic vesicle exocytosis, neuronal excitability, and novelty-seeking behavior. EMBO J. 2007;26:2991–3002. doi: 10.1038/sj.emboj.7601737. [DOI] [PMC free article] [PubMed] [Google Scholar]
- Pongrac JL, Middleton FA, Peng L, Lewis DA, Levitt P, Mirnics K. Heat shock protein 12A shows reduced expression in the prefrontal cortex of subjects with schizophrenia. Biol Psychiatry. 2004;56:943–950. doi: 10.1016/j.biopsych.2004.09.005. [DOI] [PubMed] [Google Scholar]
- Poulopoulos A, Aramuni G, Meyer G, et al. Neuroligin 2 drives postsynaptic assembly at perisomatic inhibitory synapses through gephyrin and collybistin. Neuron. 2009;63:628–642. doi: 10.1016/j.neuron.2009.08.023. [DOI] [PubMed] [Google Scholar]
- Rouach N, Byrd K, Petralia RS, et al. TARP gamma-8 controls hippocampal AMPA receptor number, distribution and synaptic plasticity. Nat Neurosci. 2005;8:1525–1533. doi: 10.1038/nn1551. [DOI] [PubMed] [Google Scholar]
- Sato J, Shimazu D, Yamamoto N, Nishikawa T. An association analysis of synapse-associated protein 97 (SAP97) gene in schizophrenia. J Neural Transm. 2008;115:1355–1365. doi: 10.1007/s00702-008-0085-9. [DOI] [PubMed] [Google Scholar]
- Schulze TG, Detera-Wadleigh SD, Akula N, et al. Two variants in Ankyrin 3 (ANK3) are independent genetic risk factors for bipolar disorder. Mol Psychiatry. 2009;14:487–491. doi: 10.1038/mp.2008.134. [DOI] [PMC free article] [PubMed] [Google Scholar]
- Schymick JC, Scholz SW, Fung HC, et al. Genome-wide genotyping in amyotrophic lateral sclerosis and neurologically normal controls: first stage analysis and public release of data. Lancet Neurol. 2007;6:322–328. doi: 10.1016/S1474-4422(07)70037-6. [DOI] [PubMed] [Google Scholar]
- Sepulveda FJ, Bustos FJ, Inostroza E, Zuniga FA, Neve RL, Montecino MA, van Zundert B. Differential roles of NMDA receptor subtypes NR2A and NR2B in dendritic branch development and requirement of RasGRF1. J Neurophysiol. 2010 doi: 10.1152/jn.00823.2009. [DOI] [PubMed] [Google Scholar]
- Sheng M, Hoogenraad CC. The postsynaptic architecture of excitatory synapses: a more quantitative view. Annu Rev Biochem. 2007;76:823–847. doi: 10.1146/annurev.biochem.76.060805.160029. [DOI] [PubMed] [Google Scholar]
- Shi Y, Vaden DL, Ju S, Ding D, Geiger JH, Greenberg ML. Genetic perturbation of glycolysis results in inhibition of de novo inositol biosynthesis. J Biol Chem. 2005;280:41805–41810. doi: 10.1074/jbc.M505181200. [DOI] [PubMed] [Google Scholar]
- Slotta DJ, McFarland MA, Markey SP. Proteomics. 2010 doi: 10.1002/pmic.200900370. In Press. [DOI] [PMC free article] [PubMed] [Google Scholar]
- Strand AD, Aragaki AK, Shaw D, et al. Gene expression in Huntington's disease skeletal muscle: a potential biomarker. Hum Mol Genet. 2005;14:1863–1876. doi: 10.1093/hmg/ddi192. [DOI] [PubMed] [Google Scholar]
- Tabuchi K, Biederer T, Butz S, Sudhof TC. CASK participates in alternative tripartite complexes in which Mint 1 competes for binding with caskin 1, a novel CASK-binding protein. J Neurosci. 2002;22:4264–4273. doi: 10.1523/JNEUROSCI.22-11-04264.2002. [DOI] [PMC free article] [PubMed] [Google Scholar]
- Takata K, Kitamura Y, Nakata Y, Matsuoka Y, Tomimoto H, Taniguchi T, Shimohama S. Involvement of WAVE accumulation in Abeta/APP pathology-dependent tangle modification in Alzheimer's disease. Am J Pathol. 2009;175:17–24. doi: 10.2353/ajpath.2009.080908. [DOI] [PMC free article] [PubMed] [Google Scholar]
- Trinidad JC, Specht CG, Thalhammer A, Schoepfer R, Burlingame AL. Comprehensive identification of phosphorylation sites in postsynaptic density preparations. Mol Cell Proteomics. 2006;5:914–922. doi: 10.1074/mcp.T500041-MCP200. [DOI] [PubMed] [Google Scholar]
- Trushina E, McMurray CT. Oxidative stress and mitochondrial dysfunction in neurodegenerative diseases. Neuroscience. 2007;145:1233–1248. doi: 10.1016/j.neuroscience.2006.10.056. [DOI] [PubMed] [Google Scholar]
- Videbech P, Ravnkilde B. Hippocampal volume and depression: a meta-analysis of MRI studies. Am J Psychiatry. 2004;161:1957–1966. doi: 10.1176/appi.ajp.161.11.1957. [DOI] [PubMed] [Google Scholar]
- Wellcome Trust Clinical Consortium. Genome-wide association study of 14,000 cases of seven common diseases and 3,000 shared controls. Nature. 2007;447:661–678. doi: 10.1038/nature05911. [DOI] [PMC free article] [PubMed] [Google Scholar]
- Xia HJ, Yang G. Inositol 1,4,5-trisphosphate 3-kinases: functions and regulations. Cell Res. 2005;15:83–91. doi: 10.1038/sj.cr.7290270. [DOI] [PubMed] [Google Scholar]
- Yang JW, Czech T, Felizardo M, Baumgartner C, Lubec G. Aberrant expression of cytoskeleton proteins in hippocampus from patients with mesial temporal lobe epilepsy. Amino Acids. 2006;30:477–493. doi: 10.1007/s00726-005-0281-y. [DOI] [PubMed] [Google Scholar]
- Yang X, Dondeti V, Dezube R, Maynard DM, Geer LY, Epstein J, Chen X, Markey SP, Kowalak JA. DBParser: web-based software for shotgun proteomic data analyses. J Proteome Res. 2004;3:1002–1008. doi: 10.1021/pr049920x. [DOI] [PubMed] [Google Scholar]
- Yucel K, McKinnon MC, Taylor VH, Macdonald K, Alda M, Young LT, MacQueen GM. Bilateral hippocampal volume increases after long-term lithium treatment in patients with bipolar disorder: a longitudinal MRI study. Psychopharmacology (Berl) 2007;195:357–367. doi: 10.1007/s00213-007-0906-9. [DOI] [PubMed] [Google Scholar]
- Yucel K, Taylor VH, McKinnon MC, Macdonald K, Alda M, Young LT, MacQueen GM. Bilateral hippocampal volume increase in patients with bipolar disorder and short-term lithium treatment. Neuropsychopharmacology. 2008;33:361–367. doi: 10.1038/sj.npp.1301405. [DOI] [PubMed] [Google Scholar]
- Zarate CA, Jr, Singh J, Manji HK. Cellular plasticity cascades: targets for the development of novel therapeutics for bipolar disorder. Biol Psychiatry. 2006;59:1006–1020. doi: 10.1016/j.biopsych.2005.10.021. [DOI] [PubMed] [Google Scholar]
- Zhang J, Goodlett DR, Montine TJ. Proteomic biomarker discovery in cerebrospinal fluid for neurodegenerative diseases. J Alzheimers Dis. 2005;8:377–386. doi: 10.3233/jad-2005-8407. [DOI] [PubMed] [Google Scholar]
Associated Data
This section collects any data citations, data availability statements, or supplementary materials included in this article.