

Abstract
Background
Large datasets for investigating vaginal flora change at frequent, repeated intervals are limited and graphical methods for exploring such data are inadequate. We report 2-year weekly vaginal flora changes based on Gram stain using lasagna plots.
Methods
Weekly vaginal flora patterns were evaluated among 211 sexually experienced women with 18 months or more of follow-up in Rakai, Uganda. Vaginal flora swabs were self-collected weekly and categorized by Nugent Gram stain criteria (0–3, normal; 4–6, intermediate; 7–10, BV). Vaginal flora patterns were analyzed as the percentage of weekly observations with BV (longitudinal prevalence) and illustrated by lasagna plots. Characteristics of women were compared across tertiles of longitudinal prevalence of BV.
Results
Ninety-five percent of women had at least 1 episode of BV over 2 years with one-third of women spending over half (52–100%) of their time with BV. Vaginal pH > 4.5 increased with increasing tertiles of longitudinal prevalence of BV (p < 0.001). Weekly fluctuation in vaginal flora states, as measured by a change in flora states from the prior to current visit, was highest in the middle (41.9%) compared to the lower (30.1%) and upper tertiles (27.8%, p < 0.001). HIV status and reported vaginal symptoms did not differ significantly across BV tertiles.
Conclusions
Women exhibited different patterns of vaginal flora changes over time, which could not be described by baseline behaviors. Lasagna plots aided in describing the natural history of BV within and across women and may be applied to future BV natural history studies.
Introduction
Bacterial vaginosis (BV) is the most common vaginal syndrome among reproductive-aged women and is marked by a shift in the normal Lactobacillus-dominant flora to a more diverse flora consisting of commensal anaerobic bacteria.1 Clinically, BV is characterized by vaginal discharge, odor, and an increased vaginal pH (> 4.5); however, symptoms are nonspecific and as many as 50% of women remain asymptomatic.2, 3 Women with BV are more likely to experience reproductive and obstetric complications, including preterm birth, low birth weight, and sexually transmitted infections.4 Despite its prevalence and adverse sequelae, the etiology and natural history of BV are poorly understood.
The dynamics of vaginal flora variability over time within women add to the complexity of studying this condition. A recent NIH workshop on BV research priorities stressed the need for larger studies with more frequent, prospective sampling.1 Longitudinal studies of vaginal flora change with infrequent observations are likely to miss episodes of BV or to detect transient BV, rather than documenting the full variability of vaginal flora patterns. A limited number of studies with frequent, repeated measurements have investigated short-term fluctuations in vaginal microflora at daily or weekly intervals; however, these studies were constrained by small sample sizes and short study duration.5–12 In addition, the display of vaginal flora patterns over time was often limited to a few individuals’ representative patterns rather than utilizing the entirety of the data across all individuals. This limitation is further complicated by inadequate graphical methods for large longitudinal datasets, such as spaghetti plots, which can lead to multiple, intersecting lines that can obscure trends and patterns.13 Establishing patterns and adequate display of vaginal flora trajectories within and between women over time is needed from large studies to better understand the natural history of BV.
We report data from a cohort of ever sexually active, reproductive-aged women in Rakai, Uganda followed weekly for up to two years and classify women according to their longitudinal vaginal flora profile. Vaginal flora patterns within and between women are illustrated using lasagna plotting, which is a recently developed exploratory method for representing and summarizing longitudinal, categorical data across a large sample of individuals.13
Materials and Methods
A two-year cohort study was conducted between 2001 and 2003 among 312 consenting females aged 13–39 years in rural Rakai District, Uganda. Women who were sexually active and postmenarcheal at baseline (N=255) and who remained in the study for at least 18 months of observation (N=211, 82.7% of the eligible sample) were included in this analysis. Ethical approval for this study was provided by institutional review boards (IRBs) in Uganda (the Scientific and Ethics Committee of the Uganda Virus Research Institute) and the United States (the Johns Hopkins Bloomberg School of Public Health IRB and the Columbia University Medical Center IRB).
The study design and data collection has been described previously.14 Briefly, women were enrolled regardless of HIV status, pregnancy, or sexual history. Participants were interviewed in their homes every week for up to 2 years and provided a self-collected vaginal swab for BV and vaginal pH assessment. More detailed questionnaires were administered at baseline, monthly, and 6-monthly visits. Self-collected vaginal swabs were rolled onto slides and air dried, Gram stained, and assessed using the Nugent quantitative morphologic classification for vaginal flora.15 Vaginal flora status based on the Nugent score was defined as: normal (0–3 points), intermediate (4–6 points), or bacterial vaginosis (7–10 points). Vaginal pH was determined by BAKER-pHIX pH papers (pH range: 4.0–9.0, Phillipsburg, NJ) affixed to a pediatric tongue depressor and assessed during all non-menstruating visits.
A serologic sample was analyzed for HIV every 6 months using two HIV enzyme immunosorbent assays (Vironostika HIV-1, Organon Teknicka, Charlotte, North Carololina, USA; Cambridge Biotech, Worcester, MA, USA) and Western blot (HIV-1 Western Blot, BioMerieuz-Vitek, St. Louis, MI, USA) for discordant results. InPouch TV culture (BioMed Diagnostics, San Jose, CA) was used for Trichomonas vaginalis (TV) detection from vaginal swabs collected every 6 months. At baseline and monthly, urinary hCG was assessed for pregnancy in all women who were not visibly pregnant, had a last menstrual period over 30 days prior to the visit, were not using Depo Provera, or had lactational amenorrhoea.
Self-reported abnormal genital discharge, dysuria, and ulcers were treated syndromically, using a single, directly observed 2 gram dose of metronidazole for discharge, which was one of the recommended regimens for BV during the study period16. Persistent abnormal discharge was treated with 1 gram dose of Azithromycin or 400 mg of Cefixime for pregnant women. Self-reported treatment was used in the analysis.
Statistical Methods
For women who completed up to 18 to 24 months of follow-up, we estimated the percentage of follow-up time spent in a given vaginal flora state, which is referred to as “longitudinal prevalence” and is often used to represent the prevalence of common recurrent infections, such as episodes of diarrhea or respiratory infections, in the same individual over time. 17 For example, the longitudinal prevalence of BV was estimated by calculating the total number of visits with BV divided by the total number of observations per woman and, subsequently, divided into tertiles. This calculation was also applied to estimate the average frequency (percentage) of time women spent with: normal and intermediate vaginal flora states, vaginal pH greater than 4.5, self-reported vaginal symptoms and treatment, menses, pregnancy, weekly sex, new partners in the past month, and substances inserted into the vagina in the past month. The frequency of vaginal flora state transitioning within a woman was estimated by the number of times the prior weekly state differed from the current state divided by the total number of paired, consecutive visits observed.
Vaginal flora patterns within and between women over time were represented by lasagna plots, which is an exploratory graphical method proposed by Swihart et al. for use in large longitudinal epidemiologic studies and analogous to heat maps often used in the genomics literature.13,18 This method was developed to overcome limitations of the spaghetti plot for visualizing longitudinal data, which is subject to overlapping trajectories, indistinguishable data patterns, and difficulties in displaying missing data. In contrast, lasagna plots allow for visualization of transitional, categorical data and simultaneous illustration of individual and group level (e.g., women grouped according to an external covariate, such as age) information for large groups of individuals. Briefly, the visualization of transitional data can be represented by an m × n history matrix H, where m rows are the number of individuals and n columns are the number of repeated intervals. Thus, each row represents the subject-specific data across n intervals. Graphical visualization of the data is achieved by assigning colors to each element hij based on the vaginal flora status (normal, intermediate, or BV) for that visit. In addition, this framework allows for row, column, and cluster sorting facilitating the graphical display of information and patterns in the data. This method precludes overlapping of trajectories to better reveal trends and patterns.
BV and other vaginal flora states vary over time and are subject to remission and recurrence for different lengths of time across individuals. Two matrices were generated to illustrate these data using lasagna plots. The first matrix (Figure 1) illustrates the temporal ordering of vaginal flora states and transitions across individuals (Y-axis) over time (X-axis). The second matrix (Figure 2) sorts vaginal flora states within each individual to display the proportion of follow-up time spent with BV (longitudinal prevalence of BV). Both figures order women by their longitudinal prevalence of BV from lowest to highest and are divided into tertiles of this distribution. Lasagna plots were generated using R 2.8.1 statistical software.19
Figure 1. Subject-specific vaginal flora transition states by weekly visits ordered by the 2-year longitudinal prevalence of BV from lowest to highest.
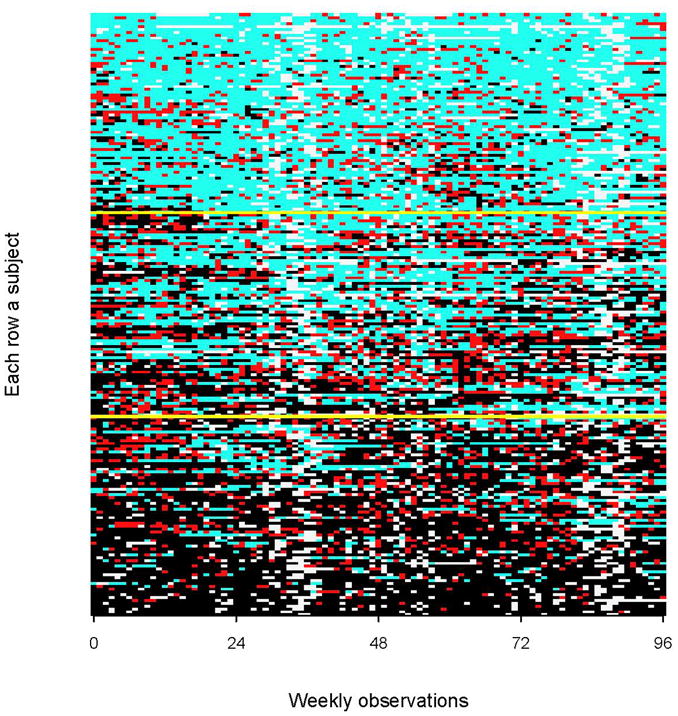
In the graph, light blue boxes correspond to normal flora, red boxes to intermediate flora, black boxes to BV, and off-white boxes to missing visits. Yellow lines divide women based on tertiles of their longitudinal prevalence of BV from lowest to highest.
Figure 2. The 2-year longitudinal prevalence of BV per woman ordered from lowest to highest.
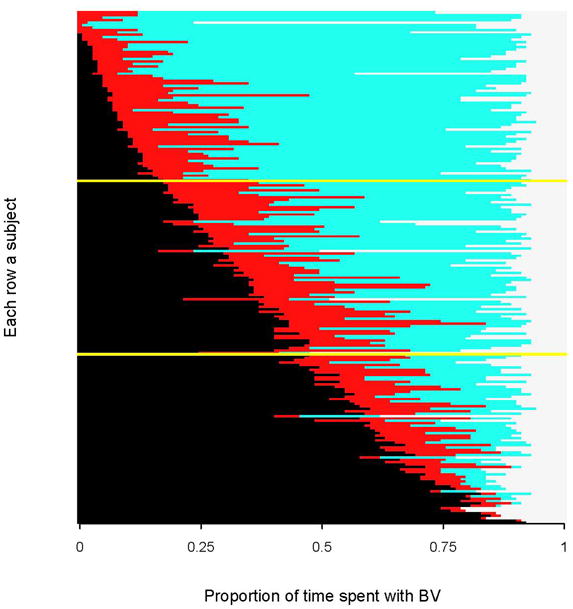
In the graph, light blue bars correspond to normal vaginal flora, red bars to intermediate flora, black bars to BV, and off-white bars to missing visits. Yellow lines divide women based on tertiles of their longitudinal prevalence of BV from lowest to highest. [This figure represents a within-row sort of BV states from Figure 1].
Baseline characteristics and longitudinal frequencies were compared by tertiles of longitudinal prevalence of BV. Baseline associations were assessed by chi-squared tests for categorical variables and one-way ANOVA for continuous variables. Medians and interquartile ranges (IQR) of 2-year longitudinal frequencies were compared by Kruskal Wallis one-way analysis of variance with correction for ties. A two-sided p-value of 0.05 was used to assess statistical significance. Data were analyzed using Stata/SE 10.0 for Windows (Stata Corporation, College Station, TX).
Results
There were a total of 255 ever sexually active, postmenarcheal women at baseline. The mean age of participants at baseline was 24.7 years (SD = 6.4) with 25.7% aged 14–19 years. Eleven percent were HIV-positive and almost half of the women (47.6%) had BV at enrollment. Four women seroconverted to HIV by the end of follow-up. Participant retention rates were high with 211 (82.7%) women remaining under observation beyond 18 months and contributing an average of 83.6 (SD = 8.2) weekly visits per woman, which constitutes an 86.2% compliance with the weekly visit schedule over 24 months. Losses to follow-up were 6.3%, 5.9%, and 5.1% by 6 months, 6–12 months, and 12–18 months, respectively.
Of the 211 women observed for 18 months or more of observation, there were 71 women in the lowest tertile (0–19.3% longitudinal prevalence of BV), 70 women in the middle tertile (20.2–52.2% longitudinal prevalence of BV), and 70 in the upper tertile (52.3–100% longitudinal prevalence of BV). The vaginal flora patterns are depicted by lasagna plots in Figures 1 and 2 and ordered by each woman’s longitudinal prevalence of BV from lowest to highest. Figure 1 illustrates temporal transitioning between weekly vaginal flora states. In the lowest tertile, most of the women had persistent normal vaginal flora (light blue) with transient intermediate status (red) or BV (black ) episodes. In the upper tertile, most of the women had persistent BV over two years with some transitory intermediate episodes and resolution to normal flora. The middle tertile showed the greatest fluctuation between vaginal flora states over time. Figure 1 also shows a cluster of missing observations (off-white boxes) that occurred around 36 and 84 weeks of observation, which correspond to the Christmas and New Years holiday and are similar in timing across all tertiles of longitudinal prevalence. Figure 2 is a within-woman sort on BV status (i.e. collapsed over time) to display the total time each women spent in BV, intermediate and normal flora states. Almost all women had BV for at least one visit during follow-up (n=202, 95.7%) and women at the bottom of the figure spent almost their entire observation time in a BV state.
Comparisons of the sociodemographic, behavioral, and clinical characteristics by tertiles of longitudinal prevalence of BV are shown in Table 1. Most baseline characteristics did not differ significantly between tertiles of longitudinal prevalence with the exception of baseline vaginal flora status, in which the enrollment prevalence of BV significantly increased with increasing tertiles of longitudinal prevalence of BV (12.7%, 55.1%, and 74.3% for lower, middle, and upper tertiles, respectively, p < 0.001). Differences in mean age at first sex and sex with a circumcised partner were of borderline significance (p = 0.07 and 0.13, respectively).
Table 1.
Baseline descriptive characteristics and longitudinal frequency of vaginal flora and vaginal symptoms by lower, middle, and upper tertiles of the longitudinal prevalence of BV
| Lower | Middle | Upper | p-valuea | |
|---|---|---|---|---|
| Total (n = 211) | 71 | 70 | 70 | - |
| Baseline characteristicsb | ||||
| Mean (SD) age (years) | 25.2 (6.5) | 25.7 (6.3) | 24.4 (6.4) | 0.50 |
| Age groups | ||||
| 14–19 | 13 (18.3) | 16 (22.9) | 21 (30.0) | |
| 20–29 | 38 (53.5) | 36 (51.4) | 34 (48.6) | |
| 30–39 | 20 (28.1) | 18 (25.7) | 15 (21.4) | 0.58 |
| Mean (SD) age at first sex (years) | 16.1 (2.2) | 15.5 (1.8) | 15.4 (1.9) | 0.07 |
| Currently married | ||||
| No | 20 (28.1) | 23 (32.9) | 25 (35.7) | 0.63 |
| Yes | 51 (71.8) | 47 (67.1) | 45 (64.3) | |
| Hormonal contraceptive use | ||||
| No | 52 (73.4) | 46 (65.7) | 49 (70.0) | |
| Yes | 14 (19.7) | 18 (25.7) | 14 (20.0) | |
| Pregnant at baseline | 5 (7.0) | 6 (8.6) | 7 (10.0) | 0.85 |
| Sex partners in the past 5 yearsc | ||||
| 1 | 59 (83.1) | 54 (78.3) | 49 (70.0) | |
| 2+ | 12 (16.9) | 15 (21.7) | 21 (30.0) | 0.17 |
| Condom used | ||||
| Never | 44 (62.0) | 47 (67.1) | 41 (58.6) | |
| Inconsistent | 20 (28.1) | 13 (18.6) | 19 (27.1) | |
| Consistent | 7 (9.9) | 10 (14.3) | 10 (14.3) | 0.61 |
| Partner’s circumcision statusd | ||||
| Uncircumcised | 40 (58.8) | 51 (72.9) | 51 (72.9) | |
| Circumcised | 28 (41.2) | 19 (27.1) | 19 (27.1) | 0.13 |
| HIV status | ||||
| Negative | 64 (90.1) | 63 (90.0) | 61 (89.7) | |
| Positive | 7 (9.9) | 7 (10.0) | 7 (10.3) | 0.99 |
| Trichomonas vaginalis | ||||
| Negative | 64 (97.0) | 56 (90.3) | 60 (90.9) | |
| Positive | 2 (3.0) | 6 (9.7) | 6 (9.1) | 0.27 |
| Baseline vaginal flora status | ||||
| Normal | 39 (54.9) | 18 (26.1) | 8 (11.4) | |
| Intermediate | 23 (32.4) | 13 (18.8) | 10 (14.3) | |
| BV | 9 (12.7) | 38 (55.1) | 52 (74.3) | <0.001 |
| 2-year Longitudinal Frequencye | ||||
| Vaginal flora states | ||||
| Bacterial Vaginosis | 7.9 (3.5–12.6) | 37.3 (28.6–45.6) | 69.8 (61.6–85.5) | <0.001 |
| Intermediate Flora | 13.8 (9.6–21.6) | 20.0 (15.1–30.2) | 11.8 (6.8–20.2) | <0.001 |
| Normal Flora | 76.1 (67.9–86.2) | 42.4 (32.1–52.1) | 11.9 (6.2–22.2) | <0.001 |
| Transitions between flora states | 30.1 (22.0–39.2) | 41.9 (33.3–50.8) | 27.8 (17.9–39.0) | <0.001 |
| Vaginal Symptoms | ||||
| Discharge | 0 (0–2.2) | 0 (0–2.3) | 0 (0–2.4) | 0.65 |
| Odor | 0 (0–0) | 0 (0–1.1) | 0 (0–0) | 0.23 |
| Treatment for Vaginal Symptoms | 1.6 (0–4.3) | 1.5 (0–5.1) | 1.6 (0–4.5) | 0.82 |
| Vaginal pH > 4.5 | 64.0 (54.3–72.8) | 74.9 (68.2–84.0) | 83.7 (76.0–88.4) | <0.001 |
NOTE: Totals may vary due to missing responses or test results
Baseline characteristics are compared using chi-squared or ANOVA tests; longitudinal summary measures are compared using Kruskal-Wallis one-way analysis of variance with correction for ties
Data are presented as n (%) unless specified otherwise, SD = standard deviation
One person reported no partners in the past 5 years and was grouped as having 1 partner
Most recent male partner
Data are presented as median (IQR) percentage of visits, IQR = interquartile range
Transitioning between Nugent score categories (normal, intermediate or BV) per woman was highest for the middle tertile (median: 41.9%, IQR: 33.3–50.8%) compared to the lower tertile (median: 30.1%, IQR: 22.0–39.2%) and upper tertiles (median: 27.8%, IQR: 17.9–39.0%, p < 0.001). Women in the upper tertile spent the greatest amount of time in a BV state (median: 69.8%, IQR: 61.6–85.5), the middle tertile in an intermediate state (median: 20.0%, IQR: 15.1–30.2), and the lowest tertile in a normal vaginal flora state (median: 76.1%, IQR: 67.9–86.2). A high vaginal pH (pH > 4.5) was the only clinical predictor that increased significantly with increasing tertiles of longitudinal prevalence (p < 0.001). Reported frequencies of vaginal discharge or odor and treatment for vaginal symptoms were low and not significantly different across all 3 tertiles. Restricting the analysis to those who experienced any symptom of discharge, odor, or received treatment, did not change inference (p = 0.79, 0.28, and 0.91, respectively). There were no differences in the frequency of reported sex in the past week, pregnancy status, substances inserted into the vagina new sex partners, and swabs collected during menstruation across tertiles (data not shown). Finally, the pattern of missing visits appears to be fairly consistent across all individuals and there were no differences in the average number of observed visits per tertile (lower = 83.7, middle = 83, and upper = 84.2, p = 0.70).
Discussion
Among women in rural Rakai, Uganda, BV was common with 95% of women having at least 1 weekly episode of BV diagnosed by Nugent Gram stain criteria over a 2-year period. Apart from a woman’s starting vaginal flora state, there were few baseline characteristics that predicted differences across tertiles of longitudinal prevalence of BV. Our data also indicate that vaginal symptoms of discharge and odor did not vary across different patterns of vaginal flora, but that the frequency of high vaginal pH (pH > 4.5) increased with increasing tertiles of longitudinal prevalence of BV. Lasagna plots further illustrated temporal patterns in vaginal flora and graphically illustrated the duration of onset and remission of BV, transitions between vaginal flora states, and the overall proportion of time spent in a given vaginal flora state within and between women. Incorporating measures of chronicity, such as longitudinal prevalence, into future BV studies may better describe the burden of BV in women.
Women in the upper tertile of longitudinal prevalence of BV tended to persist in a BV state. It has been suggested that women with persistent BV may represent a unique group with distinct vaginal flora that differ from women with less frequent or no BV occurrences.20 It has also been hypothesized that specific bacteria in women with persistent BV by Nugent criteria may maintain a healthy vaginal environment, as defined by lactic acid production and low vaginal pH, despite the lack of lactobacilli.21 However, this assertion was not supported by our data, which shows an increasing percentage of women with a vaginal pH > 4.5 associated with increasing tertiles of longitudinal prevalence of BV (Table 1). Women in the middle tertile of longitudinal prevalence of BV had the highest frequency of transitioning between vaginal flora states. While transient shifts in BV status may be influenced by recent sex or menstruation22, this association was not reflected across tertiles of longitudinal prevalence of BV. Thus, other factors, such as vaginal bacterial composition, may explain the higher frequency of transitioning in this group over a 2-year period.
There was some evidence to suggest that women who had predominantly normal flora throughout follow-up (lower tertile) were more likely to initiate sex at a later age and have a circumcised partner compared to those with moderate or frequent BV occurrences. Uncircumcised men may increase their partner’s exposure to anaerobic bacteria leading to more vaginal flora changes,23 and greater BV prevalence.24
There were few differences in clinical factors across tertiles of longitudinal BV prevalence. The prevalence of T. vaginalis was higher in middle and upper tertiles; however, the number of women with T. vaginalis was low and was not statistically significant. Longitudinal studies evaluating BV prevalence in HIV-positive women are conflicting and show either no effect or increased risk in HIV-positive women.25, 26 However, both studies supported a protective effect of treatment, higher CD4 cell counts, or lower viral load on BV among HIV-positive women. In this study, there were a total of 21 HIV-positive women who most likely represented women at an earlier stage of HIV infection. Finally, it is unknown why some women develop symptoms of BV and others do not. We did not find that the frequency of self-reported vaginal symptoms varied by greater persistence of high Nugent scores over time. While asymptomatic BV has been associated with adverse health outcomes, there is some debate regarding the utility of Nugent scores for defining a “healthy” vaginal flora environment.27 Nevertheless, the Nugent score method continues to be recommended as the gold standard until new diagnostic methods are developed.1
This study is unique in that it provides a data-rich structure for evaluating the natural history of BV at weekly intervals over 2 years. In addition, we presented methods for illustrating and exploring trends in transitional, categorical data. However, our analyses were limited to use of Nugent score morphology, which does not provide information on bacterial composition and abundance that may influence vaginal flora trajectories. In addition, findings from these rural Ugandan women may not be generalizable to other populations. We previously reported a cross-sectional prevalence of BV in this study population of 47.6% 28, which is similar to the prevalence of non-Hispanic black women in the United States (51.4%). 29 Comparisons of the longitudinal prevalence of BV by race in the United States and other populations are warranted.
In summary, BV was common and tended to be persistent in this population. The use of longitudinal prevalence of BV, illustrated by lasagna plots provides a new approach to the analysis of vaginal flora in large populations with frequent sampling. Future research should explore the vaginal microbiota using molecular technologies to further elucidate bacterial communities in women with different durations of time spent with BV.
Acknowledgments
Funding Sources
This work was supported in part by the Intramural Research Program of the National Institutes of Health (NIH), Eunice Kennedy Shriver National Institute of Child Health and Human Development (NICHD), the NIH, NICHD grant R01AI47608 (to M.J.W); the NIH, National Institute for Allergy and Infectious Diseases (NIAID) grant T32AI050056 (to J.M.Z), the Cooperative Agreement number R36PS001104 (to M.E.T) from the Center for Disease Control and Prevention (CDC). [Its contents are solely the responsibility of the authors and do not represent the official views of the CDC].
The authors thank Bruce Swihart for his feedback and assistance with lasagna plotting, including providing his program developed in R to generate the figures used in this paper.
References
- 1.Marrazzo JM, Martin DH, Watts DH, Schulte J, Sobel JD, Hillier SL, et al. Bacterial Vaginosis: Identifying Research Gaps Proceedings of a Workshop Sponsored by DHHS/NIH/NIAID. Sex Transm Dis. 2010;37:732–744. doi: 10.1097/OLQ.0b013e3181fbbc95. [DOI] [PMC free article] [PubMed] [Google Scholar]
- 2.Amsel R, Totten PA, Spiegel CA, Chen KC, Eschenbach D, Holmes KK. Nonspecific vaginitis. Diagnostic criteria and microbial and epidemiologic associations. Am J Med. 1983;74:14–22. doi: 10.1016/0002-9343(83)91112-9. [DOI] [PubMed] [Google Scholar]
- 3.Klebanoff MA, Schwebke JR, Zhang J, Nansel TR, Yu KF, Andrews WW. Vulvovaginal symptoms in women with bacterial vaginosis. Obstetrics and Gynecology. 2004;104:267–272. doi: 10.1097/01.AOG.0000134783.98382.b0. [DOI] [PubMed] [Google Scholar]
- 4.Koumans EH, Kendrick JS. Preventing adverse sequelae of bacterial vaginosis: a public health program and research agenda. Sex Transm Dis. 2001;28:292–297. doi: 10.1097/00007435-200105000-00011. [DOI] [PubMed] [Google Scholar]
- 5.Hay PE, Ugwumadu A, Chowns J. Sex, thrush and bacterial vaginosis. Int J STD AIDS. 1997;8:603–608. doi: 10.1258/0956462971918850. [DOI] [PubMed] [Google Scholar]
- 6.Keane FE, Ison CA, Taylor-Robinson D. A longitudinal study of the vaginal flora over a menstrual cycle. Int J STD AIDS. 1997;8:489–494. doi: 10.1258/0956462971920631. [DOI] [PubMed] [Google Scholar]
- 7.Morison L, Ekpo G, West B, Demba E, Mayaud P, Coleman R, et al. Bacterial vaginosis in relation to menstrual cycle, menstrual protection method, and sexual intercourse in rural Gambian women. Sex Transm Infect. 2005;81:242–247. doi: 10.1136/sti.2004.011684. [DOI] [PMC free article] [PubMed] [Google Scholar]
- 8.Priestley CJ, Jones BM, Dhar J, Goodwin L. What is normal vaginal flora? Genitourin Med. 1997;73:23–28. doi: 10.1136/sti.73.1.23. [DOI] [PMC free article] [PubMed] [Google Scholar]
- 9.Schwebke JR, Morgan SC, Weiss HL. The use of sequential self-obtained vaginal smears for detecting changes in the vaginal flora. Sex Transm Dis. 1997;24:236–239. doi: 10.1097/00007435-199704000-00009. [DOI] [PubMed] [Google Scholar]
- 10.Schwebke JR, Richey CM, Weiss2 HL. Correlation of behaviors with microbiological changes in vaginal flora. Journal of Infectious Diseases. 1999;180:1632–1636. doi: 10.1086/315065. [DOI] [PubMed] [Google Scholar]
- 11.Brotman RM, Ravel J, Cone RA, Zenilman JM. Rapid fluctuation of the vaginal microbiota measured by Gram stain analysis. Sex Transm Infect. 2010;86:297–302. doi: 10.1136/sti.2009.040592. [DOI] [PMC free article] [PubMed] [Google Scholar]
- 12.Srinivasan S, Liu C, Mitchell CM, Fiedler TL, Thomas KK, Agnew KJ, et al. Temporal variability of human vaginal bacteria and relationship with bacterial vaginosis. PLoS One. 2010;5:e10197. doi: 10.1371/journal.pone.0010197. [DOI] [PMC free article] [PubMed] [Google Scholar]
- 13.Swihart BJ, Caffo B, James BD, Strand M, Schwartz BS, Punjabi NM. Lasagna plots: a saucy alternative to spaghetti plots. Epidemiology. 2010;21:621–625. doi: 10.1097/EDE.0b013e3181e5b06a. [DOI] [PMC free article] [PubMed] [Google Scholar]
- 14.Thoma ME, Gray RH, Kiwanuka N, Aluma S, Wang MC, Sewankambo N, et al. The Short-term Variability of Bacterial Vaginosis Diagnosed by Nugent Gram Stain Criteria Among Sexually Active Women in Rakai, Uganda. Sex Transm Dis. 2010 doi: 10.1097/OLQ.0b013e3181f0bdd0. [DOI] [PubMed] [Google Scholar]
- 15.Nugent RP, Krohn MA, Hillier SL. Reliability of diagnosing bacterial vaginosis is improved by a standardized method of gram stain interpretation. J Clin Microbiol. 1991;29:297–301. doi: 10.1128/jcm.29.2.297-301.1991. [DOI] [PMC free article] [PubMed] [Google Scholar]
- 16.Koumans EH, Markowitz LE, Hogan V. Indications for therapy and treatment recommendations for bacterial vaginosis in nonpregnant and pregnant women: a synthesis of data. Clin Infect Dis. 2002;35:S152–S172. doi: 10.1086/342103. [DOI] [PubMed] [Google Scholar]
- 17.Schmidt WP, Genser B, Barreto ML, Clasen T, Luby SP, Cairncross S, et al. Sampling strategies to measure the prevalence of common recurrent infections in longitudinal studies. Emerg Themes Epidemiol. 2010;7:5. doi: 10.1186/1742-7622-7-5. [DOI] [PMC free article] [PubMed] [Google Scholar]
- 18.Baumgartner R, Somorjai R. Graphical display of fMRI data: visualizing multidimensional space. Magn Reson Imaging. 2001;19:283–286. doi: 10.1016/s0730-725x(01)00296-x. [DOI] [PubMed] [Google Scholar]
- 19.R Development Core Team. R: A language and environment for statistical computing. Vienna, Austria: R Foundation for Statistical Computing; 2008. Ref Type: Computer Program. [Google Scholar]
- 20.Brotman RM, Erbelding EJ, Jamshidi RM, Klebanoff MA, Zenilman JM, Ghanem KG. Findings Associated with Recurrence of Bacterial Vaginosis among Adolescents Attending Sexually Transmitted Diseases Clinics. Journal of Pediatric and Adolescent Gynecology. 2007;20:225–231. doi: 10.1016/j.jpag.2006.11.009. [DOI] [PMC free article] [PubMed] [Google Scholar]
- 21.Witkin SS, Linhares IM, Giraldo P. Bacterial flora of the female genital tract: function and immune regulation. Best Pract Res Clin Obstet Gynaecol. 2007;21:347–354. doi: 10.1016/j.bpobgyn.2006.12.004. [DOI] [PubMed] [Google Scholar]
- 22.Thoma ME, Gray RH, Kiwanuka N, Aluma S, Wang MC, Sewankambo N, et al. The Short-term Variability of Bacterial Vaginosis Diagnosed by Nugent Gram Stain Criteria Among Sexually Active Women in Rakai, Uganda. Sex Transm Dis. 2010 doi: 10.1097/OLQ.0b013e3181f0bdd0. [DOI] [PubMed] [Google Scholar]
- 23.Price LB, Liu CM, Johnson KE, Aziz M, Lau MK, Bowers J, et al. The effects of circumcision on the penis microbiome. PLoS One. 2010;5:e8422. doi: 10.1371/journal.pone.0008422. [DOI] [PMC free article] [PubMed] [Google Scholar]
- 24.Gray RH, Kigozi G, Serwadda D, Makumbi F, Nalugoda F, Watya S, et al. The effects of male circumcision on female partners’ genital tract symptoms and vaginal infections in a randomized trial in Rakai, Uganda. American Journal of Obstetrics and Gynecology. 2009:200. doi: 10.1016/j.ajog.2008.07.069. [DOI] [PMC free article] [PubMed] [Google Scholar]
- 25.Watts DH, Springer G, Minkoff H, Hillier SL, Jacobson L, Moxley M, et al. The occurrence of vaginal infections among HIV-infected and high-risk HIV-uninfected women: longitudinal findings of the women’s interagency HIV study. J Acquir Immune Defic Syndr. 2006;43:161–168. doi: 10.1097/01.qai.0000242448.90026.13. [DOI] [PubMed] [Google Scholar]
- 26.Jamieson DJ, Duerr A, Klein RS, Paramsothy P, Brown W, Cu-Uvin S, et al. Longitudinal analysis of bacterial vaginosis: Findings from the HIV epidemiology research study. Obstetrics and Gynecology. 2001;98:656–663. doi: 10.1016/s0029-7844(01)01525-3. [DOI] [PubMed] [Google Scholar]
- 27.Ravel J, Gajer P, Abdo Z, Schneider GM, Koenig SS, McCulle SL, et al. Vaginal microbiome of reproductive-age women. Proc Natl Acad Sci USA. 2011;108(Suppl 1):4680–4687. doi: 10.1073/pnas.1002611107. [DOI] [PMC free article] [PubMed] [Google Scholar]
- 28.Thoma ME, Gray RH, Kiwanuka N, Aluma S, Wang MC, Sewankambo N, et al. The short-term variability of bacterial vaginosis diagnosed by Nugent Gram stain criteria among sexually active women in Rakai, Uganda. Sex Transm Dis. 2011;38:111–116. doi: 10.1097/OLQ.0b013e3181f0bdd0. [DOI] [PubMed] [Google Scholar]
- 29.Koumans EH, Sternberg M, Bruce C, McQuillan G, Kendrick J, Sutton M, et al. The prevalence of bacterial vaginosis in the United States, 2001–2004; associations with symptoms, sexual behaviors, and reproductive health. Sex Transm Dis. 2007;34:864–869. doi: 10.1097/OLQ.0b013e318074e565. [DOI] [PubMed] [Google Scholar]