Abstract
This paper describes the development of a high-frequency 256-element linear ultrasonic array utilizing an interdigitally bonded (IB) piezo-composite. Several IB composites were fabricated with different commercial and experimental piezoelectric ceramics and evaluated to determine a suitable formulation for use in high-frequency linear arrays. It was found that the fabricated fine-scale 2–2 IB composites outperformed 1–3 IB composites with identical pillar- and kerf-widths. This result was not expected and lead to the conclusion that dicing damage was likely the cause of the discrepancy. Ultimately, a 2–2 composite fabricated using a fine-grain piezoelectric ceramic was chosen for the array. The composite was manufactured using one IB operation in the azimuth direction to produce approximately 19-μm-wide pillars separated by 6-μm-wide kerfs. The array had a 50 μm (one wavelength in water) azimuth pitch, two matching layers, and 2 mm elevation length focused to 7.3 mm using a polymethylpentene (TPX) lens. The measured pulse-echo center frequency for a representative array element was 28 MHz and −6-dB band-width was 61%. The measured single-element transmit −6-dB directivity was estimated to be 50°. The measured insertion loss was 19 dB after compensating for the effects of attenuation and diffraction in the water bath. A fine-wire phantom was used to assess the lateral and axial resolution of the array when paired with a prototype system utilizing a 64-channel analog beamformer. The −6-dB lateral and axial resolutions were estimated to be 125 and 68 μm, respectively. An anechoic cyst phantom was also imaged to determine the minimum detectable spherical inclusion, and thus the 3-D resolution of the array and beamformer. The minimum anechoic cyst detected was approximately 300 μm in diameter.
I. Introduction
High-frequency (>20 MHz) ultrasonic imaging is currently used for various clinical and preclinical applications: for example, visualizing atherosclerotic plaque in the coronary arteries and ocular or dermatological pathologies are common clinical uses, and visualizing the effects of experimental drug treatments in small animal models is a common pre-clinical use. In recent years, high-frequency array development has been pursued to meet the demand for improved image quality and functionality [1], [2]. Designs incorporating mechanically or laser-diced 2–2 and 1–3 composite elements have been successful in producing arrays with center frequencies up to 50 MHz [3]–[6]. In this study, we chose to pursue high-frequency linear array development using interdigitally bonded (IB) composites [7], [8]. This composite manufacturing technique was chosen because it can be implemented with a mechanical dicing saw to produce fine-scale composites suitable for high-frequency arrays. We previously reported the fabrication of an IB 1–3 composite 30-MHz array whose performance was deemed less than satisfactory because of higher-than-expected measured insertion loss (29 dB) [9]. Those results served as an inspiration for the present study, which provides a more critical look at fine-scale IB composites with the intention of improving performance of our arrays operating at approximately 30 MHz. This paper first describes the development and evaluation of fabricated fine-scale IB composites followed by the development and evaluation of a high-frequency linear-array transducer utilizing one such composite.
II. Materials, Methods, and Results
A. Interdigitally Bonded Composite Development
There are several manufacturing techniques currently available that are suitable for fabricating high-frequency 1–3 and 2–2 piezoelectric composites. A modified mechanical dicing technique has been used, whereby multiple dice-and-fill operations are performed to produce piezo-electric ceramic pillar spacing that would not have been possible with a single dicing operation [4], [6]. This technique is limited by the minimum blade width commercially available (currently 10 μm) and often results in a low composite volume fraction or an undesirable piezoelectric pillar aspect ratio. High volume fractions and small pillar and kerf widths are attainable by reactive ion etching [10] or laser dicing [5]; however, it is challenging to produce pillars with uniform aspect ratios using these techniques. A process involving the controlled lamination of lapped piezoelectric plates with an epoxy filled with polystyrene sphere spacers proved to be an effective, although laborious, way to produce extremely uniform fine-scale 2–2 composites [3]. Piezoceramic composite micromolding [11] and tape-casting techniques [12] have also proven to be effective in producing very uniform pillar aspect ratios; however, the performance of these fine-scale composites have yet to demonstrate their superiority over those involving the machining of bulk piezoelectric materials. Considering all available options, we chose to manufacture our array composites using IB because it can be performed using bulk piezoceramic or piezoelectric single-crystal materials to produce fine-scale composites with relatively uniform pillar aspect ratios and geometry [7], [8].
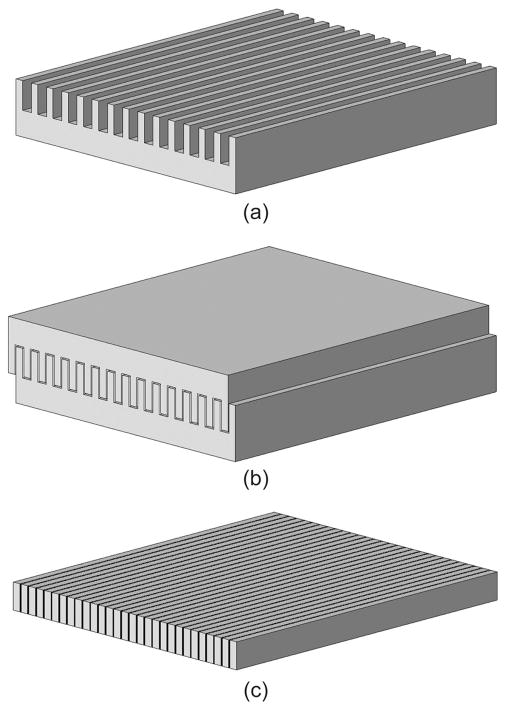
IB composite manufacturing involves the mating of two mechanically diced slabs of a piezoelectric material (Fig. 1) [7]. The diced kerfs must be larger than the width of the pillars so that the diced portions of the slabs will mate properly. The kerfs between mated pillars are infiltrated with an adhesive, usually epoxy, which is cured before further processing. An IB 2–2 composite is produced by lapping off the unwanted remnants of the piezoelectric slabs and cured adhesive. Additional IB processes can be performed using a parallel dicing direction to produce finer scale 2–2 composites [8] or perpendicularly to produce 1–3 composites. The one major drawback of the IB method is pillar misalignment, which can result in undesirable kerf widths. For every composite, there is a range of kerf widths that will result in acceptable transducer performance. A kerf width that is too large or too small can promote coupling between the thickness mode of the composite pillars and deleterious lateral modes. To combat this, we developed a pillar-positioning technique that can be used to reduce misalignment. This technique worked by creating one or more nearly-kerf-sized alignment pillars on the edges of the diced slabs to force the IB pillars to align or misalign purposefully [13]. These alignment pillars were removed by machining in the later stages of the fabrication process. Pillar-positioning was used in all composites manufactured for this study. A scanning electron microscopy (SEM) (S-3500N, Hitachi Ltd., Tokyo, Japan) image of an IB 2–2 composite is shown in Fig. 2. The combination of uniform pillar aspect ratio and kerf width for the composite shown in these images would be difficult to attain using methods other than those described by Ritter et al. [3], Cochran et al. [11], or Hackenberger et al. [12].
Fig. 1.
Drawing indicating the steps involved with manufacturing a 2–2 composite using interdigital bonding. The process involves (a) the dicing of two plates (only one is shown) of piezoelectric material with kerf widths that are smaller than pillar widths, (b) mating them together interdigitally after infiltrating the kerfs with an adhesive, and (c) removing all unwanted piezoelectric material and cured adhesive [7].
Fig. 2.
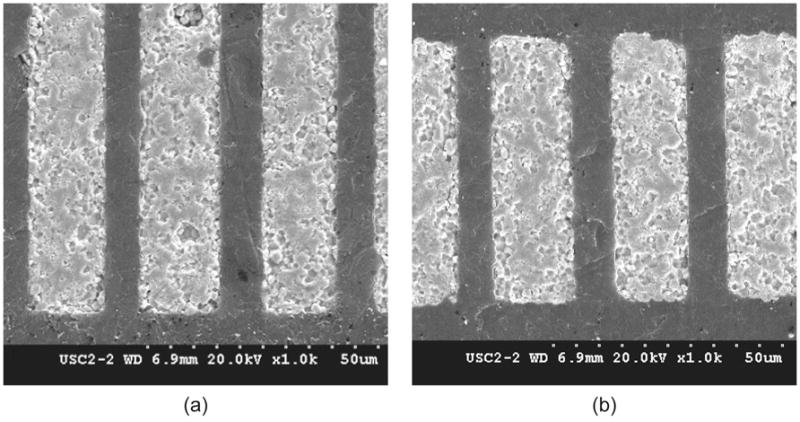
Scanning electron microscopy images of an interdigitally bonded 2–2 composite showing the (a) top and (b) side views. This composite was designed to have 55 μm thick, 19 μm wide, and 2 mm long piezoelectric ceramic pillars separated by 6-μm-wide epoxy kerfs.
IB 2–2 piezo-composite samples were fabricated and tested to assess the performance of five different piezo-electric ceramics that were considered for use in the high-frequency array. Additionally, IB 1–3 composite samples using two different piezoelectric ceramics, and samples of one solid piezoelectric ceramic were fabricated and tested to provide additional comparisons of composite performance.
All composite samples were designed to be 1 mm wide, 2 mm long, and approximately 55 μm thick, containing approximately 19-μm-wide piezoelectric ceramic pillars separated by approximately 6-μm-wide kerfs filled with a mixture of Epo-Tek 301 (Epoxy Technologies, Billerica, MA) and 17.5% by weight of plasticizer LP-3 (SPI-Chem, West Chester, PA). Actual pillar- and kerf-widths may have varied slightly based upon the amount of piezoceramic grain-pullout during dicing (Tcar864-1 dicing saw, Thermocarbon Inc., Casselberry, FL). Thin gold (approx. 1000 Å) on top of chrome (approx. 500 Å) electrodes were sputtered (NSC-3000, Nano-Master Inc., Austin, TX) on both sides of all samples. Each sample was poled in air at room temperature for 10 min using a dc field of approximately 3 kV/mm.
B. Interdigitally Bonded Composite Evaluation
The thickness-mode electromechanical coupling coefficient, kt, clamped dielectric loss tangent, tan(δSe), mechanical quality factor, Qm, attenuation coefficient, α, relative clamped permittivity, εS33/εo, and longitudinal velocity, Vl, were calculated using measurements of air-resonating samples [14], [15], obtained with an impedance analyzer (Model # 4294A with 16034H test fixture, Agilent Technologies, Santa Clara, CA) and a sub-micrometer thickness gauge (CT25/ND281B, Heidenhain, Schaumburg, IL). SEM images were also taken of broken cross-sections of undiced piezoceramic samples to estimate average grain size (AGS). The average properties obtained from five samples of each 2–2 composite material are shown in Table I and the electrical impedance characteristics of a 2–2 composite sample that was determined to be the top performer is shown in Fig. 3.
TABLE I.
Average Measured Material Properties for Interdigitally Bonded 2–2 and 1–3 Piezoceramic Composites Manufactured for This Study.
| AGS (μm) | kt | tan(δSe) | Qm | α (dB/mm) | εS33/εo | Vl (m/s) | |
|---|---|---|---|---|---|---|---|
| TRS-600FGHD 2–2 | 1.3 (0.2) | 0.56 (0.017) | 0.137 (0.004) | 31.2 (3.4) | 7.82 (0.89) | 813 (22) | 3928 (40) |
| TFT-L201F 2–2 | 1.8 (0.4) | 0.58 (0.013) | 0.107 (0.013) | 33.4 (3.1) | 7.67 (0.47) | 739 (45) | 4110 (95) |
| TFT-L202F 2–2 | 1.9 (0.4) | 0.56 (0.010) | 0.135 (0.006) | 32.2 (1.5) | 8.30 (0.26) | 932 (26) | 3990 (47) |
| PMN-30%PT* 2–2 | 2.2 (0.7) | 0.52 (0.005) | 0.167 (0.008) | 30.7 (0.8) | 8.16 (0.22) | 1225 (18) | 3897 (14) |
| CTS-3203HD 2–2 | 4.0 (1.2) | 0.54 (0.015) | 0.123 (0.005) | 24.4 (3.9) | 10.49 (1.93) | 710 (13) | 3930 (45) |
| CTS-3203HD Solid** | 4.0 (1.2) | 0.52 (0.012) | 0.137 (0.026) | 44.9 (9.7) | 5.96 (1.22) | 1377 (73) | 4781 (32) |
| TRS-600FGHD 1–3 | 1.3 (0.2) | 0.47 (0.034) | 0.119 (0.006) | 20.5 (3.4) | 14.36 (2.5) | 638 (38) | 3590 (51) |
| TFT-L201F 1–3 | 1.8 (0.4) | 0.56 (0.023) | 0.128 (0.019) | 20.5 (1.5) | 13.41 (1.4) | 439 (48) | 3497 (38) |
Values in parentheses are the standard deviations for the measured properties.
Experimental PMN-30%PT ceramic developed and manufactured at The Pennslyvania State University [16].
These measurements are for 53-μm-thick solid plate samples of CTS-3203HD ceramic.
Fig. 3.
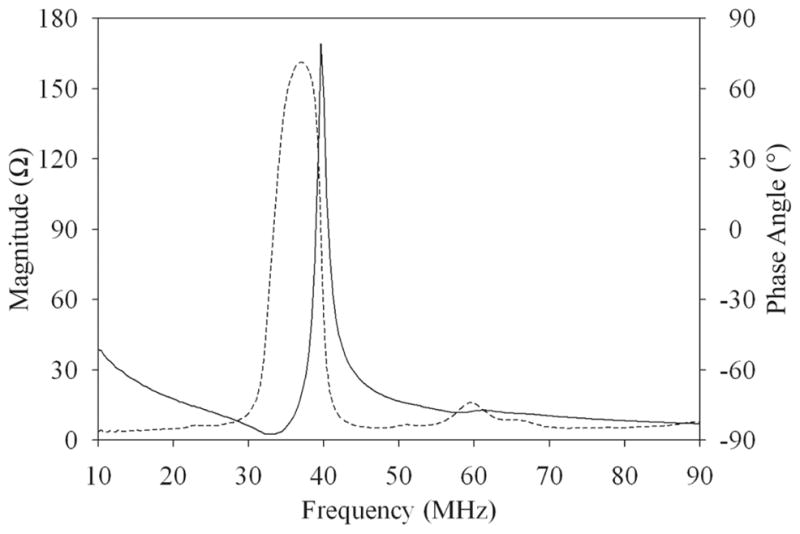
Measured electrical impedance magnitude (solid line) and phase angle (dashed line) for a piece of IB TFT-L201F 2–2 composite. This composite was determined to be the top performer of those manufactured for this study.
The TFT-L201F 2–2 composite (TFT Corporation, Tokyo, Japan) outperformed other 2–2 composites fabricated using TFT-L202F, TRS-600FGHD (TRS Technologies, State College, PA), CTS-3203HD (CTS Ceramics, Albuquerque, NM), and a prototype PMN-30%PT fine-grained ceramic currently being developed at Penn State University for small-aperture devices [16]. This material displayed the highest kt, lowest tan(δSe), and lowest α of the 2–2 composite materials tested and, thus, was chosen for use in fabricating the linear array. Also, on average, the kt, and tan(δSe) for 2–2 composites fabricated using finer-grained (AGS ≤1.9 μm) materials were better, and the Qm and α were significantly better than what was recorded for the one composite fabricated using a coarse-grained piezoceramic (CTS-3203HD, AGS = 4.0 μm); therefore, it appears that finer-grained piezoceramics are the more desirable choice for fabricating high-frequency 2–2 composite transducers.
The measured kt for all 2–2 composite samples was 12 to 21% less than finite-element (PZFlex) model predictions of the electrical impedance curves, assuming manufacturers’ bulk piezoceramic material properties and formula previously described elsewhere [14]. The difference between measured and modeled kt was 19% for TRS-600FGHD, 12% for TFT-L201F, 15% for TFT-L202F, and 21% for both PMN-30%PT and CTS-3203HD 2–2 composites. It is well known that the properties of piezoelectric ceramics are frequency dependent [14], [15]; however it is not known if damage caused by the mechanical dicing process contributes more significantly to the overall performance of the composite. Therefore, we also fabricated and tested three thin (53 μm) solid plate samples of the CTS-3203HD ceramic for a comparison of the percentage of degradation in performance. The averaged performance for these piezoceramic samples, also shown in Table I, agreed with previously reported results by Zipparo et al. [14] and Foster et al. [15] for the same material formulation. The difference between the manufacturer’s reported kt (0.55) [17] for the CTS-3203HD piezoceramic and our measured results was only 5.5%, whereas the difference between measured and modeled 2–2 composite performance using the same material was 21%; therefore, it is clear that the diced IB composites suffered process-induced degradation in addition to frequency-dependent degradation of performance.
It was previously theorized that mechanical or thermal damage during the mechanical dicing process accounted for an observed performance degradation [18]. To test this theory further, we also fabricated 58% volume fraction 1–3 composites with 19-μm pillars and 6-μm kerfs using the TRS-600FGHD and TFT-L201F materials. The averaged results, also listed in Table I, supported the theory that damage caused by dicing had occurred; the 1–3 composites had lower kt and Qm values than the 2–2 composites, and α increased significantly. The measured kt values for these 1–3 composites were particularly alarming considering that the 1–3 composites developed for this study should display significantly higher kt values (approx. 0.73) than 2–2 composites (approx. 0.67) based upon finite element analysis (PZFlex) assuming the manufacturers’ bulk piezoceramic material properties.
A previous study by Liu et al. [7] reported kt values as high as 0.66 and 0.73 for mechanically diced IB 2–2 and 1–3 composites manufactured using the CTS/Motorola 3203HD ceramic. These kt measurements were obtained from 40- to 44-μm-thick composite samples with 36-μm-wide pillars, and therefore we believe that their performance was less influenced by dicing damage than the 19-μm-wide pillars constructed for this study. We also believe that the 36-μm pillar width used in that previous study would not be ideal for fabricating a 30-MHz 1–3 or 2–2 composite transducer optimized for thickness-mode operation. Assuming a thickness of approximately 50 μm, the aspect ratio (width/height) produced with such a large pillar width (0.72) would show significant coupling between the lateral- and thickness-mode resonances [19]; As a result, ultrasonic arrays constructed using such a composite may suffer from lengthy pulse-echo ringdown, increased insertion loss, and high crosstalk between elements. Ideally, pillar aspect ratio should be less than approximately 0.5 to 0.6 to avoid the deleterious effects of mode-coupling [20].
Previously reported results for other fine-scale composite manufacturing methods display kt values comparable to our results for the IB method (Table I). The process involving the controlled lamination of lapped piezoceramic plates [3] produced a 2–2 piezoceramic composite using TRS-600FGHD (28.5-μm-wide pillars and 5.0-μm-wide kerfs) with a recorded kt of 0.6, which is 6.6% higher than what we report using the IB method. The tape-casting method [12] was used to produce 18-MHz and 25-MHz 2–2 piezoceramic composite (22-μm-wide pillars and 4.5-μmwide kerfs) with a measured kt of 0.52 and 0.62, respectively. Finally, a 36-MHz 1–3 composite fabricated using micromolding techniques (15-μm-pillar widths with a 50% piezoceramic volume fraction) recorded a kt value of approximately 0.5 [21]. Unfortunately, these composite manufacturing studies did not report other critical material properties, such as tan(δSe), Qm, and α; therefore, further research is warranted to determine if there is a preferred method.
C. Array Development
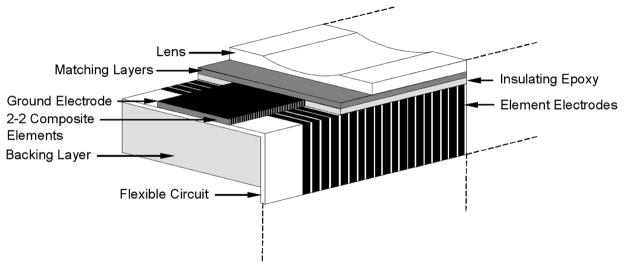
A drawing that shows the major design components of the 30-MHz array developed for this study is displayed in Fig. 4. The array was designed to have a 50-μm (one wavelength in water) pitch and to use a flexible circuit for interconnect. Two acoustic matching layers were used in the design along with a lens for elevation focusing. The IB TFT-L201F 2–2 composite used to form the array elements had kerf and pillar widths identical to the test pieces detailed in the previous section. Matching layer compositions were chosen using formulas derived by DeSilets et al. [22]. The thicknesses of the matching layers and other passive materials used in the array were optimized using a 2-dimensional finite element model (PZFlex, Weidlinger Associates, Santa Clara, CA).
Fig. 4.
Design configuration for the 30-MHz linear array transducer (not to scale).
The interconnection between array elements and imaging system electronics is the most critical and challenging step in the high-frequency array fabrication process. Because of the fine element spacing, techniques such as traditional soldering or bump bonding connections from elements to more coarsely spaced system circuitry are not practical. One successful approach involved the deposition of a metal electrode covering and shorting all piezoelectric array elements to all equally finely-spaced signal traces on a finely-to-coarsely spaced printed circuit. The subsequent separation of individual element electrodes and traces can be accomplished by dicing [3]–[5], or etching. Spatial limitations in the alignment between the array elements and the printed circuit, as well as the material removal process used, dictate the practical limit for this technique. Wire bonding between patterned individual element electrodes and traces on a printed circuit can also be used [6]; however, this technique is limited to the resolution of the wire bonder and gauge of wire used. The approach we decided to use for this study involved the alignment and direct bonding of a flexible printed circuit to a plate of piezo-electric material with patterned individual array element electrodes. This technique is mainly limited by the ability to align the two patterned electrodes. Also, unlike the other techniques reviewed, it does not require specialized equipment such as a laser dicing machine or wire bonder for success.
The components used in the array were fabricated separately and then carefully aligned and bonded together using an unloaded epoxy (Epo-Tek 301). The array assembly process started by casting an 8 × 7 × 22 mm backing block of unloaded Epo-Tek 301 in a rubber mold. The 7-mm backing thickness used was deemed acceptable to avoid backing echo interference based upon previously reported acoustic attenuation data [23]. After curing and de-molding, the backing block was carefully bonded to the flexible circuit, which had fiducial markers printed on it to help with alignment. The custom double-sided flexible circuit used in this study was designed in-house and fabricated by 3M Electronic Solutions (Canoga Park, CA)
A 2 × 13 mm piece of TFT-L201F composite was fabricated for the 256-element array. The composite incorporated a chrome/gold (Cr/Au) signal electrode covering the piezoelectric ceramic pillars only. Selectively patterning the signal electrodes on the composite pillars was accomplished by sputtering a continuous electrode (approx. 2000 Å Au on top of 500 Å Cr) over the entire composite and then removing the electrode covering the exposed epoxy kerfs only using mechanical abrasion with a cotton swab and reagent alcohol [24].
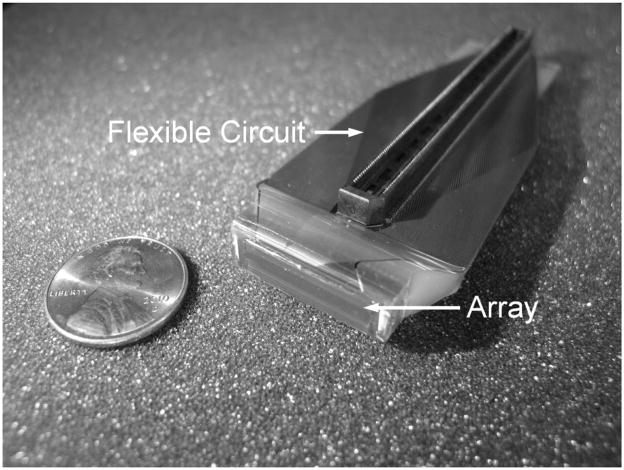
The composite was carefully aligned and bonded to the flex-circuit with the aid of patterned fiducial markers on the flex-circuit so that the kerf between two ceramic pillars was centered over a single signal electrode on the flex-circuit (Fig. 5). An additional electrode (approx. 1000 Å of Au on top of 500 Å of Cr) was sputtered over the composite and a portion of the flex-circuit to create the composite ground layer and short it to the ground electrodes patterned on the flex-circuit. A 17-μm-thick silver epoxy inner matching layer composed of 2- to 3-μm silver particles (Adrich Chem. Co., Milwaukee, WI) mixed with Insulcast 501 (Americal Safety Tech., Roseland, NJ) epoxy was fabricated [3]. A 17-μm-thick parylene C outer matching layer was then vapor deposited (PDS2010, Specialty Coating Systems, Indianapolis, IN) on top of the inner matching layer with the aid of an adhesion promoter (A-174, Specialty Coating Systems). The matching layers were then bonded to a machined polymethylpentene (TPX) (RT18, Mitsui Chemicals, Tokyo, Japan) lens. TPX was used as a lens because it had an ideal combination of an acoustic impedance similar to tissue, and low loss at high frequency [25]. The concave lens was machined using an 11/64-in (4.37-mm) ball-end-mill and polished to provide a smooth surface finish. The matching layer and lens sub-assembly was then bonded to the array assembly. Finally, array elements were poled in air at room temperature by applying a DC field of 3 kV/mm for 10 min. A photograph of the finished array assembly is shown in Fig. 6. A separate custom designed array cable assembly was also fabricated using a 75-Ω coaxial cable bundle (Tyco/Precision Inter-connect, Portland, OR) and three printed circuit boards utilizing four surface mount connectors (BSH Series, Samtec Inc., New Albany, IN). The cable length of 1.5 m was chosen to be approximately 1/4-wavelength at 30 MHz, and thus provided the only electrical impedance matching used between the array elements and the system electronics [3], [4]. This cable assembly was used in conjunction with all array performance tests.
Fig. 5.
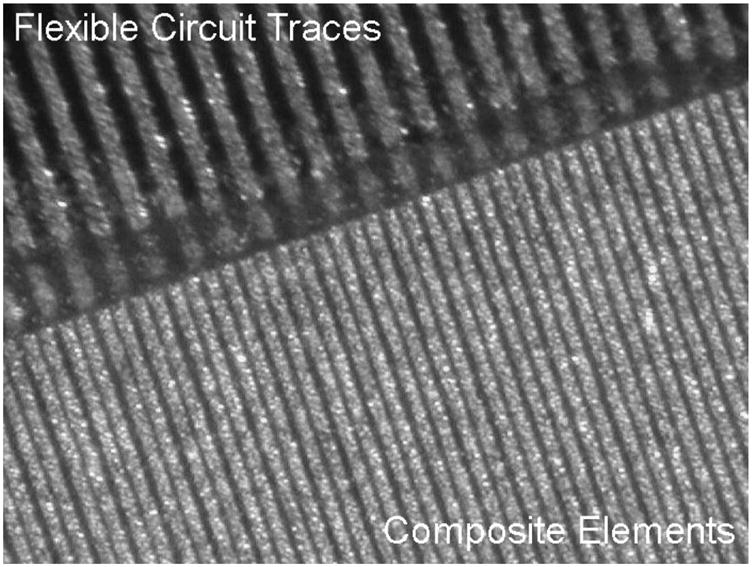
Photograph of a 2–2 composite bonded to the custom-designed flexible circuit. The flexible circuit traces in this photograph are 20 μm wide with 30-μm spaces between them.
Fig. 6.
Photograph of a finished 30-MHz array assembly.
D. Array Evaluation
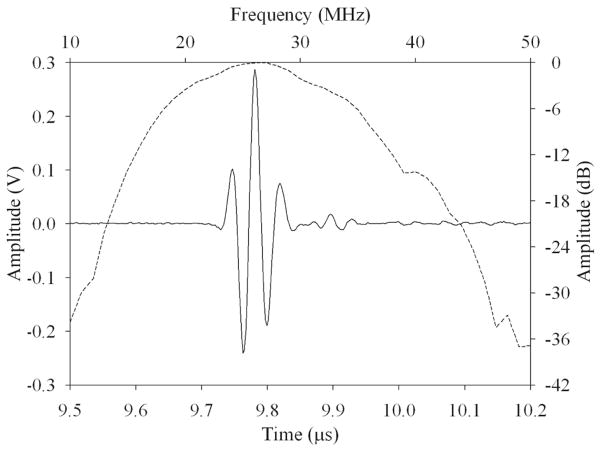
The pulse echo response was acquired using a polished quartz reflector placed in a tank of deionized water positioned at the array elevation focal point. A Panametrics 5900 pulser (Olympus NDT, Waltham, MA) was used to excite array elements individually, and the receiver on the same unit was used to amplify the echoes before displaying them on a digital oscilloscope (LC534, LeCroy Corp., Chestnut Ridge, NY). The response of a typical element, as shown in Fig. 7, had a center frequency of 28 MHz and a −6-dB bandwidth of 61%. The peak echo amplitude located at 9.79 μs corresponded to an elevation focal point of approximately 7.3 mm, which was reasonably close to the designed elevation focus of 7.5 mm. The array echo amplitude standard deviation was also determined to be 0.69 dB over the entire 256-element aperture. There were no open or shorted elements detected, but there were three elements that displayed an echo amplitude between 4 and 8 dB less than the average. These elements displayed lower capacitance than their neighbors, leading to the conclusion that portions of the two piezoelectric ceramic pillars used to form an array element were not fully electrically connected to the flex circuit traces.
Fig. 7.
Measured pulse-echo waveform (solid line) and spectrum (dashed line) for a representative array element.
The combined electrical and mechanical crosstalk was measured by placing the array in a water bath opposite of an absorptive target and exciting a single element with a 5 Vpp sinusoidal burst (AFG3252, Tektronix Inc., Beaverton, OR) at discrete frequencies. Crosstalk was estimated by comparing peak voltage across that element to the peak voltage across neighboring elements. The maximal crosstalk was −21 dB across the nearest element and −30 dB across the next-nearest element in the range of 10 to 50 MHz. The crosstalk averaged over the −6-dB array bandwidth was −27 dB across the nearest element and −38 dB across the next-nearest element. These values were deemed satisfactory considering the simplicity of the array design and construction. In the future, the array fabrication procedure could be modified to include slotted matching layers and air kerfs separating elements [3], [5] if lower crosstalk values are determined to be necessary. For example, a 2–2 composite 30-MHz array with a 2.0-wavelength pitch, mechanically-diced inner matching layer, and air kerfs, displayed a maximal nearest neighbor crosstalk value of less than −30 dB [3]. Similarly, a 2–2 composite 29-MHz array with a 1.5-wavelength pitch, laser-diced inner matching layer, and air kerfs displayed a nearest neighbor crosstalk value of less than −40 dB when averaged across the −6-dB array bandwidth [5].
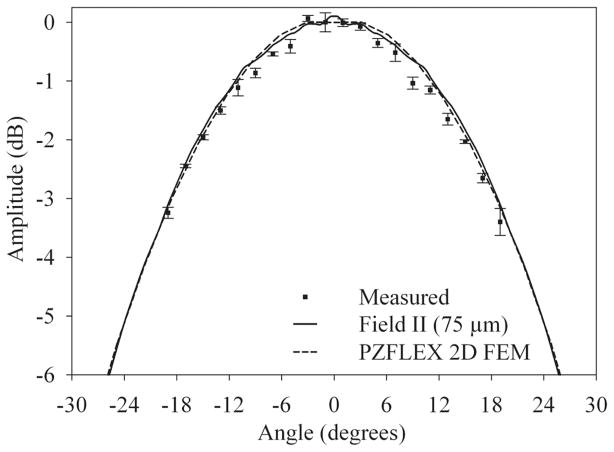
The single-element azimuthal one-way angular response, or directivity, was measured to determine the diffractive loss for proper estimation of array insertion loss. The array was placed in a fixture that allowed it to be rotated around an axis along its width and center. A needle hydrophone (HPM04/1, Precision Acoustics, Dorchester, UK), placed 10 mm away from the array, was used to acquire the peak amplitude of the time-domain response from a representative element at discrete angular positions. The Field II program [26] was used to simulate the directivity of a single array element and to estimate the effective element width by matching a modeled directivity curve to the measured values. A modeled element width of 75 μm provided the closest match to the measured data (Fig. 8). The single-element directivity for the array was estimated to be 50° based upon the projection of the Field II modeled data. An effective width of 50% larger than the array pitch is an indication of the effect of inter-element crosstalk on array performance. Also shown in Fig. 8 is the result of a 2-D (PZFlex) finite element model predicted single-element directivity for the array, which matched very well with the measured results. Because PZFlex does not take into account the electrical crosstalk of the array module and interconnect, this data supported our theory that the observed crosstalk and large effective element width were predominantly caused by mechanical crosstalk in the array structure.
Fig. 8.
Measured and modeled transmit directivity for a single array element. The data obtained using Field II assumed a 75-μm-wide array element.
Array insertion loss was measured by exciting a representative array element with a 10-cycle 5-Vpp 30-MHz sinusoidal burst and receiving the reflected echo from a polished quartz reflector placed at the elevation focus. The receive voltage across a 50-Ω load was compared with the source voltage delivered to a 50-Ω reference load and expressed in decibels. The measured value was then corrected for loss caused by diffraction in the azimuth direction [27], attenuation in the water bath, and imperfect reflection from the quartz target [28]. The measured insertion loss for this array after compensating for attenuation and diffraction in the water bath was 19 dB. This value was 10 dB lower that what was observed for an identically- sized 1–3 composite 30-MHz array [9], but was 4 dB higher than what was observed for a 30-MHz, 2.0-wavelength pitch, 2–2 composite array [3] also developed by our group.
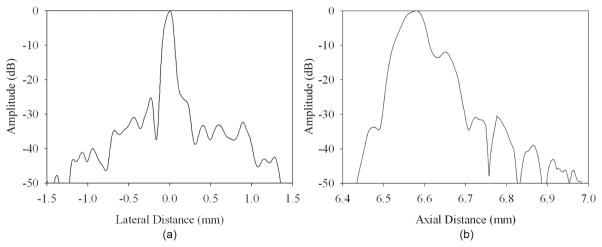
The ultimate test of an ultrasonic array’s performance is accomplished by using it to form an image; however, the quality of images produced is as much dependent on the imaging system electronics as it is on the array. The array was paired with a custom-built system with a 64-active-channel analog receive beamformer currently being developed in our lab to evaluate array imaging performance [29]. The system utilized digital delay-lines to produce a single transmit focus at approximately 6.4 mm, and up to four receive foci (6.4, 8.75, 9.6, and 11.2 mm) with analog delay-lines. A wire phantom comprised of five equally spaced 20-μm-diameter tungsten wires (California Fine Wire Co., Grover Beach, CA) was imaged first. The lateral and axial line spread functions obtained from a single wire located near the transmit focus are shown in Fig. 9. Based upon this data, the −6-dB lateral and axial resolutions were estimated to be 125 and 68 μm, respectively. A Field II simulation of the array with the system was in reasonable agreement with the measured results, predicting lateral and axial resolutions of 109 and 62 μm, respectively. Image SNR at a depth of 6.4 mm was determined to be 55.5 dB by comparing the peak amplitude of the reflected signal off of the tungsten wire to the mean noise level when the wire was removed.
Fig. 9.
Measured (a) lateral and (b) axial line spread functions obtained with the 30-MHz array and the custom-designed imaging system with a 64-channel analog receive beamformer.
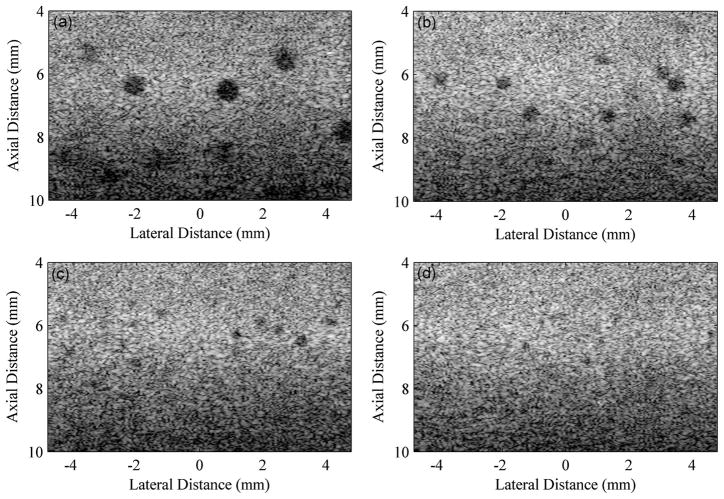
A tissue-mimicking phantom containing anechoic spheres was imaged next to evaluate the array-plus-beam-former’s 3-D resolution by taking into account array elevation slice thickness. The phantom composed of eight blocks of tissue mimicking material, each with a spatially random distribution of anechoic spheres was obtained from the Medical Physics Department at the University of Wisconsin–Madison [30]. Each block had a different mean cyst diameter ranging from 100 to 1090 μm. All blocks were imaged using a single transmit and receive focus of 6.4 mm. The images obtained from the sections with the 825-, 530-, 400-, and 300-μm cysts are displayed in Fig. 10. It was determined that the minimum detectable cyst diameter was 300 μm. A similar result was observed by Madsen et al. [29] using a commercial system (Vevo 2100, Visualsonics Inc., Toronto, ON, Canada) and 30-MHz array with a 1.5-wavelength pitch. Finally, the contrast-to-noise ratio (CNR) at a range of approximately 6.5 mm (focal point for transmit beamformer) were estimated to be 2.6, 2.0, 2.0, and 1.1 using the images (Fig. 10) of the 825-, 530-, 400-, and 300-μm anechoic cysts, respectively [31].
Fig. 10.
Images of a tissue mimicking phantom with (a) 800-, (b) 530-, (c) 400-, and (d) 300-μm-diameter anechoic cysts using the 30-MHz array and custom-designed imaging system. A single transmit and receive focus of 6.4 mm was used and the displayed dynamic range for this image is 40 dB. The contrast-to-noise ratios for these images at a range of 6.5 mm were estimated to be 2.6, 2.0, 2.0, and 1.1, respectively [31].
Finally, an excised bovine eye was imaged to show the ability of the array-plus-system to image biological tissue structures. The system was set to have a transmit focus of 6.4 mm and four receive foci (6.4-, 8.75-, 9.6-, and 11.2- mm). An image of a section of the anterior portion of the excised bovine eye is shown in Fig. 11. The cornea, iris, ciliary body, and the surface of the lens are clearly visible in this image.
Fig. 11.
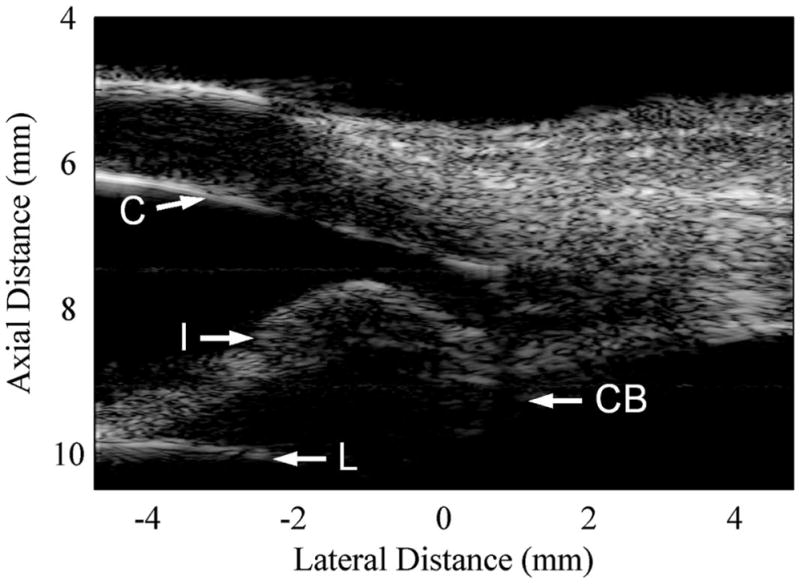
Image of an excised bovine eye obtained with the 30-MHz array and custom-designed imaging system. One transmit (6.4 mm) and four receive foci (6.4, 8.75, 9.6, and 11.2 mm) were used to form this image. The cornea (C), iris (I), ciliary body (CB), and the surface of the lens (L) are clearly visible in this image. The displayed dynamic range for this image is 40 dB.
III. Summary and Conclusions
A high-frequency array was developed that utilized an IB 2–2 composite. This study is the first to report the use of IB 2–2 composites in the manufacture of a high-frequency linear ultrasound array. The IB composite manufacturing technique was chosen because it could provide uniform, fine-scale piezoceramic composites suitable for high-frequency ultrasound transducers.
Several IB 2–2 composites were fabricated using four commercial and one experimental piezoelectric ceramic. Overall, composites made using ceramics with average grain sizes of equal to or less than 1.9 μm outperformed a larger-grained counterpart (CTS-3203HD); however, the electromechanical coupling coefficient for all composites tested was significantly lower than what was modeled using published bulk material properties. More severe performance degradation was also observed with fabricated IB 1–3 composites. The observation that similarly constructed 1–3 composites underperformed their 2–2 composite counterparts led to the conclusion that damage caused by mechanical dicing played a significant role in determining overall composite performance. Considering the observed piezoelectric properties, these results also suggest that 2–2 composites may be a better choice for mechanically diced high-frequency piezoceramic composite linear array fabrication. There may be a correlation between dicing parameters and dicing damage; for example, spindle speed, blade feed rate, water temperature, and blade grain structure. All of these parameters could be evaluated in the future to determine ways to reduce performance degradation caused by mechanical dicing. It was also noted that other piezoceramic composite manufacturing techniques [3], [12], [21] were capable of achieving kt values comparable to what was recorded for composites manufactured using the IB method; however, further studies are needed to make definitive comparisons. Laser-dicing [5] and/or dry-etching [10] should also be evaluated extensively to determine if they are more- or less-effective techniques for producing fine-scale piezoceramic composites for high-frequency ultrasound arrays.
Ultimately fine-scale composite performance must be improved to improve high-frequency array performance. Single-crystal piezoelectrics may ultimately become the preferred materials for fine-scale composites because of their superior performance when compared with piezoceramics [20]; however, we did not evaluate them in this study because their brittle nature makes them an impractical choice for manufacturing fine-scale 2–2 composites using the IB method. Reactive ion etching appears to be a more practical and effective method for creating finescale composites using single-crystal piezoelectrics, having achieved an average kt of 0.71 and tan(δSe) of 0.052 for 1–3 composites designed for 40-MHz operation [10].
A 256-element 30-MHz array was designed and fabricated using the IB 2–2 composite that was determined to be the top performer. The array was constructed by aligning and bonding the electroplated TFT-L201F composite to a custom-designed flexible circuit using an unloaded and non-conductive epoxy. The matching and backing layers, as well as the lens, were also fabricated separately and bonded to the composite and flexible circuit using a unloaded epoxy. The process of aligning and bonding the electroplated composite to the flex circuit to create a 50-μm element pitch was successfully carried out; with no open or shorted elements observed during array testing. Therefore, we feel that such a process should be considered as a viable solution to fine-scale array interconnection techniques. This technique is limited only by the minimum trace- and space-widths achievable with photolithography; however, the creation of arrays with element spacing less than approximately 25-μm most likely will require the aid of micro-positioning fixtures for alignment before bonding.
The fabricated array had a pulse-echo center frequency of 28 MHz and −6-dB bandwidth of 61%. The measured single-element transmit −6-dB directivity was estimated to be 50°, which corresponded to a modeled effective element width of 75 μm. Measured and finite-element-modeled directivity agreed very well, thus indicating that mechanical crosstalk was the dominant factor contributing to the 50% difference between designed and measured effective element width. The measured insertion loss was 19 dB after compensating for losses caused by attenuation and diffraction. This value was 10 dB lower that what was observed for an identically-sized 30-MHz 1–3 IB composite array previously fabricated by our group [9].
Finally, the array was paired with a prototype beamformer system to evaluate image performance. Images of wire and tissue-mimicking phantoms were obtained to assess the spatial resolution of the array plus electronics. The −6-dB lateral and axial resolution was determined to be 125 and 68 μm, respectively. The minimum detectable anechoic cyst diameter was 300 μm, which was comparable to what was reported for a commercial 30-MHz array-based imaging system.
Acknowledgments
The support of NIH grant # P41-EB2182 is gratefully acknowledged.
The authors would like to thank B. Jones and Dr. T. Shrout from the Materials Research Institute at The Pennsylvania State University for providing the fine-grained PMN-PT ceramic used in this study, as well as the scanning electron microscope images of the evaluated ceramics and interdigitally bonded composites.
Biographies
 Jonathan M. Cannata (S’01–M’04) received his B.S. degree in bioengineering from the University of California at San Diego in 1998, and his M.S. and Ph.D. degrees in bioengineering from The Pennsylvania State University, University Park, PA, in 2000 and 2004, respectively.
Since 2001, Dr. Cannata has served as the manager for the NIH Resource on Medical Ultrasonic Transducer Technology, which is currently located at the University of Southern California (USC). In 2005, he was appointed the title of Research Assistant Professor of Biomedical Engineering at USC. He has co-authored more than 30 peer-reviewed journal and more than 40 conference articles related to medical ultrasound. His current interests include the design, modeling, and fabrication of ultrasonic transducers and transducer arrays for medical applications.
Dr. Cannata is a member of IEEE, the Acoustical Society of America, and American Institute of Ultrasound in Medicine.
 Jay A. Williams serves as a Transducer Engineer at the NIH Resource on Medical Ultrasonic Transducer Technology. Mr. Williams joined the group in March 2002 just prior to their move to the University of Southern California in August of that year. He has also been the webmaster for the Resource Center, http://bme.usc.edu/UTRC, since the move to USC. Some of his accomplishments include: the development of 128-element 30-MHz composite 30-μm-pitch phased arrays, 256-element 30-MHz composite 50-μm-pitch linear arrays, 64-element 35-MHz composite 50-μm-pitch linear arrays, 8-element 35- to 60-MHz annular arrays, very light-weight (<0.3 gram 40 to 60 MHz, <0.2 gram 80 to 100 MHz) high frame-rate B-scan transducers, 100- to 150-MHz sputtered ZnO transducers, and 10-MHz composite HIFU catheter transducers. He currently holds a patent, no. 7 695 784, covering post positioning for interdigital bonded composites.
Mr. Williams audited courses in business management, computer science, mechanical engineering, architecture, and physics at The Pennsylvania State University from 1975 to 1977. He also achieved honors in both analog electronics at Radio Semiconductor, 1984, and digital electronics at Control Data Institute Multi-skills Center, 1987. He had worked in industry for 25 years in a variety of technical fields such as mass spectrometry, microwave telecommunication, liquid chromatography, digital electronics, ultrasound, and information technology. In 1990, he began working in ultrasound at Blatek, Inc., State College, PA, serving 8 1/2 years in engineering then 2 1/2 years in management, including the last 5 years as IS/IT Manager, and last 2 years as Quality System Manager, establishing their first ISO 9001 and FDA CGMP (21CFR820) cannata et al.: linear array utilizing an interdigitally bonded piezo-composite 11 quality system. He has now worked in the ultrasound field for over 20 years.
 Lequan Zhang received his B.S. degree in electrical engineering from the University of Science and Technology of China, Hefei, China, in 2004, and his M.S. degrees in biomedical engineering and electrical engineering from the University of Southern California, Los Angeles, CA, in 2006 and 2009, respectively. He received his Ph.D. degree in biomedical engineering from the University of Southern California in 2011. His research interests include the design of high-frequency ultrasound array imaging systems and ultrasound signal processing.
 Changhong Hu received his B.S. degree in biomedical engineering from Xi’an Jiaotong University in 1995, Xi’an, Shannxi, P.R. China, his M.S. degree in bioengineering from The Pennsylvania State University, University Park, PA, in 2002, and his Ph.D. degree in biomedical engineering from the University of Southern California, Los Angeles, in 2005. He worked as a Research Associate and Research Assistant Professor in the Biomedical Engineering Department, University of Southern California from 2006 to 2010. There he specialized in the development of high-frequency ultrasound imaging systems/electronics and digital signal processing techniques. He is currently working at Philips Inc. as a systems engineer.
 K. Kirk Shung (S’73–M’75–SM’89–F’93) obtained a B.S. degree in electrical engineering from Cheng-Kung University in Taiwan in 1968, an M.S. degree in electrical engineering from the University of Missouri, Columbia, MO, in 1970 and a Ph.D. degree in electrical engineering from the University of Washington, Seattle, WA, in 1975. He did postdoctoral research at Providence Medical Center in Seattle, WA, for one year before being appointed a research bioengineer holding a joint appointment at the Institute of Applied Physiology and medicine. He became an assistant professor at the Bioengineering Program, The Pennsylvania State University, University Park, PA, in 1979 and was promoted to professor in 1989. He was a Distinguished Professor of Bioengineering at Penn State until 2002, when he joined the Department of Biomedical Engineering, University of Southern California, Los Angeles, CA, as a professor. He has been the director of NIH Resource on Medical Ultrasonic Transducer Technology since 1997.
Dr. Shung is a life fellow of IEEE, and a fellow of the Acoustical Society of America and American Institute of Ultrasound in Medicine. He is a founding fellow of American Institute of Medical and Biological Engineering. He has served for two terms as a member of the NIH Diagnostic Radiology Study Section. He received the IEEE Engineering in Medicine and Biology Society Early Career Award in 1985 and was the coauthor of a paper that received the best paper award for IEEE Transactions on Ultrasonics, Ferroelectrics and Frequency Control (UFFC) in 2000. He was selected as the distinguished lecturer for the IEEE UFFC society for 2002–2003. He was elected an outstanding alumnus of Cheng- Kung University in Taiwan in 2001. In 2010, he received the Holmes Pioneer Award in Basic Science from American Institute of Ultrasound in Medicine.
Dr. Shung has published more than 300 papers and book chapters. He is the author of the textbook Principles of Medical Imaging, published by Academic Press in 1992 and the textbook Diagnostic Ultrasound: Imaging and Blood Flow Measurements, published by CRC Press in 2005. He co-edited the book Ultrasonic Scattering by Biological Tissues, published by CRC Press in 1993. Dr. Shung’s research interest is in ultrasonic transducers, high-frequency ultrasonic imaging, ultrasound microbeam, and ultrasonic scattering in tissues.
References
- 1.Foster FS, Mehi J, Lukacs M, Hirson D, White C, Chaggares C, Needles A. A new 15–50 MHz array-based micro-ultrasound scanner for preclinical imaging. Ultrasound Med Biol. 2009;35(10):1700–1708. doi: 10.1016/j.ultrasmedbio.2009.04.012. [DOI] [PubMed] [Google Scholar]
- 2.Ketterling JA, Ramachandran S, Aristizábal O. Operational verification of a 40-MHz annular array transducer. IEEE Trans Ultrason Ferroelectr Freq Control. 2006;53(3):623–630. doi: 10.1109/tuffc.2006.1610571. [DOI] [PMC free article] [PubMed] [Google Scholar]
- 3.Ritter TA, Shrout TR, Tutwiler R, Shung KK. A 30- MHz piezo-composite ultrasound array for medical imaging applications. IEEE Trans Ultrason Ferroelectr Freq Control. 2002;49(2):217–230. doi: 10.1109/58.985706. [DOI] [PubMed] [Google Scholar]
- 4.Cannata JM, Williams JA, Zhou Q, Ritter TA, Shung KK. Development of a 35-MHz piezo-composite ultrasound array for medical imaging. IEEE Trans Ultrason Ferroelectr Freq Control. 2006;53(1):224–236. doi: 10.1109/tuffc.2006.1588408. [DOI] [PubMed] [Google Scholar]
- 5.Lukacs M, Yin J, Pang G, Garcia RC, Cherin E, Williams R, Mehi J, Foster FS. Performance and characterization of new micromachined high-frequency linear arrays. IEEE Trans Ultrason Ferroelectr Freq Control. 2006;53(10):1719–1729. doi: 10.1109/tuffc.2006.105. [DOI] [PubMed] [Google Scholar]
- 6.Brown JA, Foster FS, Needles A, Cherin E, Lockwood GR. Fabrication and performance of a linear array based on a 1-3 composite with geometric elevation focusing. IEEE Trans Ultrason Ferroelectr Freq Control. 2007;54(9):1888–1894. doi: 10.1109/tuffc.2007.473. [DOI] [PubMed] [Google Scholar]
- 7.Liu R, Harasiewicz KA, Foster FS. Interdigital pair bonding for high frequency (20–50 MHz) ultrasonic composite transducers. IEEE Trans Ultrason Ferroelectr Freq Control. 2001;48(1):299–306. doi: 10.1109/58.896143. [DOI] [PubMed] [Google Scholar]
- 8.Yin J, Lukacs M, Harasiewicz KA, Foster FS. Design and fabrication of ultrafine piezoelectric composites. Ultrason Imaging. 2005;27(1):54–64. doi: 10.1177/016173460502700104. [DOI] [PubMed] [Google Scholar]
- 9.Cannata JM, Williams JA, Hu C-H, Shung KK. Development of high frequency linear arrays using interdigital bonded composites. Proc. IEEE Ultrasonics Symp; 2008. pp. 686–689. [Google Scholar]
- 10.Yuan JR, Jiang X, Cao PJ, Sadaka A, Bautista R, Snook K, Rehrig PW. High frequency piezo composites microfabricated ultrasound transducers for intravascular imaging. Proc. IEEE Ultrasonics Symp.; 2006. pp. 264–268. [Google Scholar]
- 11.Cochran S, Abrar A, Kirk KJ, Zhang D, Button TW, Su B, Meggs C, Porch N. Net-shape ceramic processing as a route to ultrafine scale 1-3 connectivity piezoelectric ceramic-polymer composite transducers. Proc. IEEE Ultrasonics Symp.; 2004. pp. 1682–1685. [DOI] [PubMed] [Google Scholar]
- 12.Hackenberger W, Kwon S, Rehrig P, Snook K, Rhee S, Geng X. 2-2 PZT-polymer composites for high frequency (>20 MHz) ultrasound transducers. Proc. IEEE Ultrasonics Symp.; 2002. pp. 1253–1256. [Google Scholar]
- 13.Williams JA, Cannata JM, Liu R, Shung KK. Post positioning for interdigital bonded composite. 7 695 784. US Patent. 2010 Apr 13;
- 14.Zipparo MJ, Shung KK, Shrout TR. Piezoceramics for high-frequency (20 to 100 MHz) single-element imaging transducers. IEEE Trans Ultrason Ferroelectr Freq Control. 1997;44(5):1038–1048. [Google Scholar]
- 15.Foster FS, Ryan LK, Turnbull DH. Characterization of lead zirconate titanate ceramics for use in miniature high-frequency (20–80 MHz) transducers. IEEE Trans Ultrason Ferroelectr Freq Control. 1991;38(5):446–453. doi: 10.1109/58.84289. [DOI] [PubMed] [Google Scholar]
- 16.Wang H, Jiang B, Shrout TR, Cao W. Electromechanical properties of fine-grain, 0.7Pb(Mg1/3Nb2/3)O3-0.3PbTiO3 ceramics. IEEE Trans Ultrason Ferroelectr Freq Control. 2004;51(7):908–912. doi: 10.1109/tuffc.2004.1320751. [DOI] [PubMed] [Google Scholar]
- 17.C TS Corp. Superior materials. 2011 Feb 15; [Online]. Available: http://www.ctscorp.com/components/PZT/supmat.asp.
- 18.Nix EL, Corbett J, Sweet JH, Ponting M. Dicing and grinding of electro-ceramics. World Capacitor/Resistor/Inductor Trade Statistics Conf. Europe 2005; pp. 246–264. [Google Scholar]
- 19.Geng X, Zhang QM. Evaluation of piezocomposites for ultrasonic transducer applications-Influence of the unit cell dimensions and the properties of constituents on the performance of 2-2 piezocomposites. IEEE Trans Ultrason Ferroelectr Freq Control. 1997;44(4):857–872. [Google Scholar]
- 20.Ritter TA, Geng X, Shung KK, Lopath PD, Park SE, Shrout TR. Single crystal PZN/PT-polymer composites for ultrasound transducer applications. IEEE Trans Ultrason Ferroelectr Freq Control. 2000;47(4):792–800. doi: 10.1109/58.852060. [DOI] [PubMed] [Google Scholar]
- 21.MacLennan D, Button TW, Elgoyhen J, Hughes H, Meggs C, Corner G, Demore CEM, Cochran S, Zhang D. Fundamental performance characterisation of high frequency piezocomposites made with net-shape viscous polymer processing for medical ultrasound transducers. Proc. IEEE Ultrasonics Symp.; 2008. pp. 58–61. [Google Scholar]
- 22.DeSilets CS, Fraser JD, Kino GS. Design of efficient broadband piezoelectric transducers. IEEE Trans Sonics Ultrason. 1978;SU-25(3):115–125. [Google Scholar]
- 23.Wang H, Ritter TA, Cao W, Shung KK. High frequency properties of passive materials for ultrasonic transducers. IEEE Trans Ultrason Ferroelectr Freq Control. 2001;48(1):78–84. doi: 10.1109/58.895911. [DOI] [PubMed] [Google Scholar]
- 24.Chabok HR, Cannata JM, Kim HH, Williams JA, Park J, Shung KK. A high-frequency annular-array transducer using an interdigital bonded 1-3 composite. IEEE Trans Ultrason Ferroelectr Freq Control. 2011;58(1):206–214. doi: 10.1109/TUFFC.2011.1787. [DOI] [PMC free article] [PubMed] [Google Scholar]
- 25.Ritter TA. PhD dissertation. Dept. of Bioengineering, The Pennsylvania State University; 2000. Design, fabrication and testing of high frequency (> 20 MHz) composite ultrasound imaging arrays. [Google Scholar]
- 26.Jensen J. Field: A program for simulating ultrasound systems. Med Biol Eng Comput. 1996;34(1):351–353. [Google Scholar]
- 27.Selfridge AR. PhD dissertation. Dept. of Electrical Engineering, Stanford University; 1983. The design and fabrication of ultrasonic transducers and transducer arrays. [Google Scholar]
- 28.Lockwood GR, Turnbull DH, Foster FS. Fabrication of high frequency spherically shaped ceramic transducers. IEEE Trans Ultrason Ferroelectr Freq Control. 1994;41(2):231–235. [Google Scholar]
- 29.Zhang L, Hu C-H, Yen JT, Shung KK. Design of a 64 channel analog receive beamformer for high frequency arrays. Proc. IEEE Ultrasonics Symp.; 2010. pp. 4–M3-2. [Google Scholar]
- 30.Madsen EL, Frank GR, McCormick MM, Deaner ME, Stiles TA. Anechoic sphere phantoms for estimating 3-D resolution of very-high-frequency-ultrasound scanners. IEEE Trans Ultrason Ferroelectr Freq Control. 2010;57(10):2284–2292. doi: 10.1109/TUFFC.2010.1689. [DOI] [PMC free article] [PubMed] [Google Scholar]
- 31.Seo CH, Yen JT. Sidelobe suppression in ultrasound imaging using dual apodization. IEEE Trans Ultrason Ferroelectr Freq Control. 2008;55(10):2198–2210. doi: 10.1109/TUFFC.919. [DOI] [PMC free article] [PubMed] [Google Scholar]


