

Abstract
To explain the large, opposite effects of urea and glycine betaine (GB) on stability of folded proteins and protein complexes, we quantify and interpret preferential interactions of urea with 45 model compounds displaying protein functional groups and compare with a previous analysis of GB. This information is needed to use urea as a probe of coupled folding in protein processes and to tune molecular dynamics force fields. Preferential interactions between urea and model compounds relative to their interactions with water are determined by osmometry or solubility and dissected using a unique coarse-grained analysis to obtain interaction potentials quantifying the interaction of urea with each significant type of protein surface (aliphatic, aromatic hydrocarbon (C); polar and charged N and O). Microscopic local-bulk partition coefficients Kp for the accumulation or exclusion of urea in the water of hydration of these surfaces relative to bulk water are obtained. Kp values reveal that urea accumulates moderately at amide O and weakly at aliphatic C, whereas GB is excluded from both. These results provide both thermodynamic and molecular explanations for the opposite effects of urea and glycine betaine on protein stability, as well as deductions about strengths of amide NH—amide O and amide NH—amide N hydrogen bonds relative to hydrogen bonds to water. Interestingly, urea, like GB, is moderately accumulated at aromatic C surface. Urea m-values for protein folding and other protein processes are quantitatively interpreted and predicted using these urea interaction potentials or Kp values.
Keywords: thermodynamics, solutes, osmolytes, solute partitioning model
Urea and glycine betaine (GB) rank at opposite ends of a series of small nonelectrolyte solutes in terms of their effects on protein folding and other protein processes. Stabilities ( ) of folded proteins and of site-specific protein–DNA complexes decrease linearly with increasing urea molarity and increase with increasing GB molarity (1–5). This solute series parallels the Hofmeister anion and cation series of non-Coulombic effects of salt ions on protein processes; guanidinium cation and thiosulfate or iodide anions are highly destabilizing but alkali metal cations are not destabilizing and sulfate or fluoride anions are stabilizing (6–8). Similar rank orders but smaller ranges of solute and non-Coulombic salt effects are observed on DNA and RNA duplex formation; urea and salt ions that greatly destabilize proteins when added at molar concentrations also greatly destabilize DNA duplexes, but GB and Hofmeister salt ions that stabilize proteins do not stabilize nucleic acids duplexes(4, 5, 8–11). Another range of solute effects is observed for the series of solutes from ethylene glycol (EG) to PEG, where the monomer EG destabilizes both hairpin and duplex DNA helices, whereas polymeric PEGs greatly stabilize the duplex and eliminate the destabilization of the hairpin helix (12). In our research, we use molecular thermodynamic analyses of model compound data to interpret and predict the effects of these solutes and Hofmeister salt ions in terms of preferential interactions of the solute or salt ions with individual functional groups on the protein or DNA surfaces that are affected (buried or exposed) in the process, supplemented by excluded volume effects in the case of polymeric solutes such as PEG (4, 8, 12–18). Here we obtain this information for urea and apply it to understand both the molecular and thermodynamic basis of the very different effects of urea and GB on protein processes.
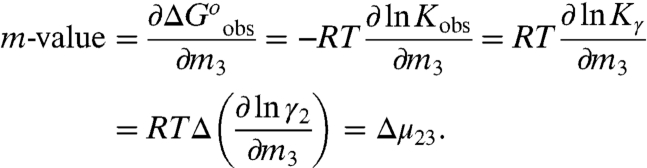
Solute effects on biopolymer processes such as protein folding and protein–DNA binding are quantified by m-values, derivatives with respect to solute concentration (m3) of the observed standard free energy change for the process ( ), where Kobs, the equilibrium concentration quotient for the process, is independent of choice of initial biopolymer concentrations, but varies with solute concentration because it is expressed in terms of biopolymer concentrations and not activities:
 |
[1] |
In Eq. 1, Kγ is the equilibrium constant in terms of biopolymer activity coefficients, and the subscripts 1, 2, and 3 refer to water, biopolymer/model compound, and urea, respectively. Eq. 1 is valid for typical experimental conditions where m3≫m2 and the partial derivatives are at constant m2, T, and P. The chemical potential derivative μ23 is (∂μ2/∂m3)m2 = RT(∂ ln γ2/∂m3)m2, where γ2 is the activity coefficient of component 2; μ23 is negative when there is a favorable preferential interaction between the solute and biopolymer and positive when there is an unfavorable interaction.
Urea m-values for unfolding globular proteins are proportional to the change in accessible surface area (ΔASA) in unfolding (1, 16). Urea m-values for unfolding a series of α-helices with (AEAAKA)n repeats are also proportional to ΔASA; an average per residue m-value is obtained by fitting these transition curves to helix-coil theory (19). Analysis of these protein and peptide unfolding data indicated that urea and GuHCl m-values depend not only on the total ΔASA but also on the composition of the surface that is exposed, and provided estimates of the strength of the favorable interactions of these denaturants with protein amides (16).
To interpret preferential interactions of a solute like urea with proteins and other biopolymers, values of μ23 are determined for the effects of the solute on the chemical potentials of appropriately chosen model compounds. In transfer-free energy analyses, preferential interactions of urea and other solutes with amino acids and small peptides have been determined from solubility measurements and dissected, assuming additivity, to quantify the preferential interactions of urea and other solutes with the 20 amino acid side chains and with the peptide backbone repeat unit (20, 21). Recently we used osmometry to determine preferential interactions of the osmolyte GB with 27 model compounds displaying one or more of the functional groups of proteins [amide, carboxylate, hydroxyl oxygen (O); amide, cationic nitrogen (N); aliphatic and aromatic hydrocarbon (C)] (15). These interactions were dissected, assuming additivity, into individual contributions from interactions with each group, and quantitatively interpreted using the solute partitioning model (SPM). We obtained a pattern of local accumulation or exclusion of GB consistent with expectations based on hydrogen bonding, cation-π interactions, and other short-range noncovalent interactions (15).
Here we use osmometry, solubility, and micelle formation assays to determine values of μ23 for preferential interactions of urea with 20 model compounds and analyze these results together with literature data for 25 urea-model compound interactions to quantify the interactions of urea with the various O, N, and C functional groups of proteins. From these results and information on the amount and composition of the surface exposed in unfolding a protein or disrupting a protein complex, m-values quantifying the effect of urea on the stability of that protein or protein complex are readily predicted. For a protein process like ligand binding or protein-protein association, the urea m-value is a powerful semiquantitative probe of large-scale coupled folding; comparison of urea m-values with those determined for other solutes such as GB that interact differently with protein functional groups will allow a quantitative prediction of the amount and type of protein surface buried in the process.
Results
Quantifying Interactions of Urea with Model Compounds.
Interactions of urea with selected, relatively soluble, nonvolatile model compounds (11 salts and 6 polar nonelectrolytes), each displaying two or three protein functional groups, were quantified over a range of molal concentrations of urea (m3) and model compound (m2) by vapor pressure osmometry (VPO). VPO measures the osmolality (Osm) of a solution; here we determine the excess osmolality ΔOsm [ΔOsm = Osm(m2,m3) - Osm(m2,0) - Osm(0,m3)], from which the chemical potential derivative μ23 is obtained (22, 23):
 |
[2] |
Osmolality differences ΔOsm (a function of urea and model compound molality) are plotted as a function of the concentration product m2m3 (Eq. 3), in the four panels of Fig. 1. In addition, literature determinations by isopiestic distillation of osmolalities of two and three component solutions of urea and an amino acid or small peptide were analyzed to obtain ΔOsm; these data are plotted in Fig. 1B. Values of μ23, determined from the best fitted slopes, are reported in Table 1 and discussed below.
Fig. 1.

Determination of μ23/RT for urea-model compound interactions by osmometry. Excess osmolalities ΔOsm (Eq. 2) determined by VPO are plotted against m2m3, the product of molal concentrations of the model compound and urea; the slope is μ23/RT (Eq. 3). (A) Uncharged model compounds; (B) amino acids; (C and D) salts.
Table 1.
Comparison of surface interaction potentials (αi) and SPM partition coefficients (Kp) for urea and GB
| 104αi, m-1Å-2† |
SPM Kp‡ |
|||
| Surface type, i* | Urea | GB§ | Urea | GB§ |
| Aromatic C | −8.9 ± 0.5 | −23 ± 4 | 1.28 ± 0.02 | 1.62 ± 0.11 |
| Amide O | −8.7 ± 1.8 | 28 ± 10 | 1.28 ± 0.06 | 0.24 ± 0.27 |
| Carboxylate O | −4.0 ± 1.5 | 29 ± 2 | 1.13 ± 0.05 | 0.22 ± 0.06 |
| Amide N | −3.2 ± 2.3 | −20 ± 7 | 1.10 ± 0.07 | 1.54 ± 0.19 |
| Hydroxyl O | −2.5 ± 0.6 | 1 ± 2 | 1.08 ± 0.02 | 0.97 ± 0.06 |
| Aliphatic C | −1.1 ± 0.5 | 3 ± 3 | 1.03 ± 0.02 | 0.92 ± 0.08 |
| Cationic N | 1.8 ± 1.6 | −12 ± 4 | 0.94 ± 0.05 | 1.32 ± 0.11 |
| Inorganic Ion | βion, m-1¶ | |||
| Na+ | 0.104 ± 0.013 | 0∥ | ||
| K+ | 0.146 ± 0.014 | 0.05 ± 0.02 | ||
| Cl- | −0.170 ± 0.021 | −0.04 ± 0.04 | ||
*If the solute has no preferential interaction with a type of surface (i.e., the solute is neither accumulated nor excluded in the vicinity of that type of surface), then αi = 0 and Kp = 1. If the solute is accumulated αi < 0 and Kp > 1, whereas if the solute is excluded αi > 0 and Kp < 1.
†αi is defined in Eq. 4.
‡Kp calculated from Eq. 5 using b1 = 0.18 [i.e., two layers of water (15)] and ϵ = 0.14 for GB [this correction was not applied to the Kp values reported in Capp et al. (15)] and ϵ = -0.02 for urea, obtained from two-component osmolality data.
§Reanalyzed from data of Capp et al. (15); see Materials and Methods and above footnote.
¶βion defined in Eq. 4; not normalized per Å2 of ion surface.
∥Assigned single ion value (15).
Because most of the soluble model compounds investigated by osmometry have relatively small proportions of hydrocarbon surface, we determined the preferential interactions of urea with aromatic and aliphatic hydrocarbon ASA using solubility and micelle dissolution assays. The effect of urea on the solubility or critical micelle concentration (cmc) of the model compound gives the μ23 value for the interaction of urea with the surface area of the model compound exposed in dissolving it from a macroscopic phase or a micelle. In general μ23 = -μ22(∂m2/∂m3)μ2, where μ22 = (∂μ2/∂m2)m3. Evaluated at the solubility (or cmc) of component 2 (designated  ),
),
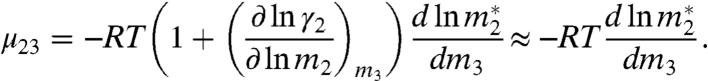 |
[3] |
The solubility m-value ( ) therefore yields μ23/RT directly if the solubility of the model compound is sufficiently small that its saturated solution is an ideal dilute solution in the absence of urea, in which (∂ ln γ2/∂ ln m2)m3 evaluated at
  is negligibly small.
Effects of urea on the solubility  of naphthalene and anthracene and on the cmc
  of SDS micelles are reported in Fig. S1. Values of μ23/RT obtained from the slopes of linear fits of these plots (Eq. 3) are listed in Table S1. Literature data for the effect of urea on the solubility of other sparingly soluble compounds were also plotted according to Eq. 3 (Fig. S2) and initial slopes of a quadratic fit to the curved data are reported in Table S1.
Qualitative Features of Urea-Functional Group Interactions Deduced from Model Compound Data.
From the extensive series of urea/model compound data in Fig. 1 and Figs. S1 and S2 we observe the following:
Addition of urea lowers the chemical potentials of all nonelectrolyte model compounds studied. Most simply interpreted, the favorable preferential interactions of urea with all these model compounds indicate that it interacts favorably, relative to water, with most types of molecular O, C, and N surface.
Water accessible surfaces of the series of polyols glycerol, mannitol, and sucrose are predominantly hydroxyl O and aliphatic C, in approximately a 2∶1 ASA ratio. Fig. 1 shows that preferential interactions of all three polyols with urea are favorable (μ23 < 0) and that μ23 becomes more negative (favorable) as the size of the polyol is increased. These data indicate that preferential interactions of urea with hydroxyl O and/or aliphatic C are favorable and that μ23 increases in magnitude with surface area at constant surface composition.
Preferential interactions of urea with both uncapped and end-capped series (24) of glycine peptides become more favorable (μ23 becomes more negative) as more peptide units are added (Fig. 1 and Fig. S2), indicating that the urea-amide (O,N) preferential interaction is favorable.
Urea weakly favors dissociation of SDS micelles and therefore must have a weak favorable preferential interaction with the primarily aliphatic C surface exposed when an SDS monomer dissociates from a micelle.
NaPropionate and NaBenzoate contain similar amounts of hydrocarbon C and of carboxylate O, differing in that NaPropionate displays aliphatic C, whereas NaBenzoate displays aromatic C. Urea exhibits no significant preferential interaction with NaPropionate, whereas the net urea–NaBenzoate preferential interaction is quite favorable. This means that the interaction of urea with aromatic C must be much more favorable than its weakly favorable interaction with aliphatic C.
Urea exhibits a relatively strong favorable interaction with glycine betaine (Fig. 1A), which displays only aliphatic C and carboxylate O. This interaction is too favorable to be ascribed to the GB methyl groups because these presumably behave like aliphatic C, which has only a weak favorable preferential interaction with urea. Therefore, urea must have a favorable preferential interaction with carboxylate O.
Although interactions of urea with most organic nonelectrolytes are favorable (μ23 < 0), interactions of urea with Na+ or K+ salts of organic anions are less favorable, becoming unfavorable for salts with three Na+ or K+ ions (Na3Citrate, K3Citrate, and Na3NTA), for which μ23 is relatively large and positive (Fig. 1). Therefore urea must have strong unfavorable preferential interactions with Na+ and K+ cations to counteract the favorable interaction with the carboxylate and aliphatic ASA of the organic anions. Values of μ23 for the interactions of urea with KCl and NaCl are small in magnitude and negative, indicating that the preferential interaction of urea with the Cl- anion is favorable and slightly stronger than the unfavorable preferential interaction of urea with Na+ and K+ cations.
Discussion
Interpretation of Urea Interactions (μ23) Using ASA and the SPM.
Preferential interactions of urea with model compounds are quantified by chemical potential derivatives (μ23), closely related to preferential interaction coefficients (14). Qualitatively, trends in the data presented above and in previous studies indicate that values of μ23 for urea-model compound interactions depend on both amount and type of model compound ASA, as previously observed for preferential interactions of GB with a similar set of model compounds (15). In that study, we quantitatively dissected experimental values of μ23 for GB-model compound interactions into additive contributions from interactions of GB with the individual functional groups (i) of the model compound and, for salts, with the inorganic ion.
 |
[4] |
where αi, the contribution to μ23/RT per unit ASA of surface of type i, can be thought of as a preferential interaction potential for urea and surface type i. For electrolyte model compounds with inorganic ions (here K+, Na+, or Cl-), νion is the stoichiometric number of that ion per formula unit of the salt and βion is the contribution of the interaction of urea with that ion to μ23/RT. For urea, as for GB (15), the sum in Eq 4 is over seven chemically distinct types of molecular surface: aliphatic and aromatic C; carboxylate, amide, and hydroxyl O; cationic and amide N. Values of ASAi for each type of surface on each model compound investigated (Table S2) were calculated from structural information as described in SI Text. Values of αi for all seven surface types and three inorganic ions are determined by global fitting of μ23/RT and ASA data for interactions of urea with 44 model compounds to Eq. 4.
Values of αi are interpreted at a molecular level using the results of the molecular thermodynamic analysis of a two-state (local and bulk) approximation to the distribution of the solute in the vicinity of the model compound or protein functional group, called the SPM (15–17, 23, 25, 26). For a nonelectrolyte solute like urea,
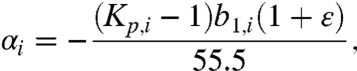 |
[5] |
where b1,i is the number of molecules of local water (water of hydration) per unit area of the surface of interest (i),  is the partition coefficient characterizing the distribution of urea between the local hydration water of surface type (i) and bulk water, and the urea self-nonideality correction ϵ = d ln γ3/d ln m3 is -0.02 in the range 0.1 to 3 molal. Application of Eq. 4 to the μ23 dataset for GB-model compound interactions yielded a set of preferential interaction potentials αi and single ion interaction coefficients βion, which not only provided an excellent representation of the μ23 data but also made chemical sense when interpreted using the SPM (15). Here we apply this analysis to our urea μ23 dataset and compare with GB.
Table 1 summarizes urea interaction potentials αi and corresponding partition coefficients Kp, as well as single ion βion, obtained from a global fit of all urea-model compound data to Eq. 4. To obtain Kp, a common value b1 = 0.18 H2O/Å2 (corresponding to approximately two layers of local water) was assumed for all types of surface investigated. This is the lower-bound value of b1 determined previously for the air–water interface (25) and for molecular aliphatic and aromatic hydrocarbon surfaces in water [using the excluded Hofmeister salt Na2SO4 (17)]. This b1 is also consistent with values of μ23 for interactions of GB with anionic carboxylate O (4, 5, 15), where near-complete exclusion is expected. For comparison, Table 1 also includes values of αi and Kp for the interaction of GB with these functional groups and of βion for interactions of GB with inorganic ions (15), showing that values of αi for the protein functional groups of interest are generally smaller in magnitude for urea than for GB, whereas values of βion for the inorganic ions of salts are larger in magnitude for urea than for GB.
A first application of urea αi values in Table 1 is to predict values of μ23/RT for interactions of urea with all model compounds in the training set. Experimental and calculated values, tabulated in Table S1, are compared in Fig. 2; agreement is very good (average deviation ± 20%), supporting the use of an ASA-based analysis and the assumption of additivity in Eq. 4. We do not detect any common characteristics among the compounds exhibiting the largest deviations between observed and predicted μ23/RT. The interaction potentials in Table 1 allow one to predict the effect of urea and GB on the osmolality or any other colligative property of a solution of any model compound of known structure, and on the solubility or other observed equilibrium constants for processes involving any model compound in water.
Fig. 2.

Plot of predicted vs. observed values of μ23/RT for interactions of urea with model compounds (see Table S1). Line represents equality of predicted and observed values.
Molecular Interpretation of Preferential Interactions of Urea and GB with Functional Groups of Proteins.
Urea, like water, has multiple hydrogen bond donors and acceptors, but glycine betaine has no hydrogen bond donor capability. This key difference is sufficient to explain the differences in Kp values (Table 1) for interactions of urea and GB with N and O groups.
Amide O: Moderately strong accumulation of urea in the vicinity of any amide O group (Kp = 1.28) indicates most simply that formation of a hydrogen bond donated by a urea-amide -NH to an amide O, together with a water–water hydrogen bond, is favored as compared to hydrogen bonds of the urea-amide -NH and the amide O to water. The urea-amide O interaction is one of the two most favorable preferential interactions of urea with the functional groups of proteins. In stark contrast, GB is highly excluded from amide O (Kp = 0.24), presumably because GB lacks a hydrogen bond donor group and so cannot compete with water to interact with amide O. The free energy of transfer of the peptide backbone from water to an osmolyte solution (1 M) is found to decrease strongly and approximately linearly as the fraction of polar surface of the osmolyte increases, with trimethylamine N-oxide (TMAO) and GB at the nonpolar and unfavorable end of the series, and urea and GuHCl at the polar and favorable end (27). Because amide O is the principal contributor to peptide backbone surface, the abilities of these solutes to compete with water to hydrogen bond to amide O are probably the determinant of their place in this series; TMAO, like GB, cannot compete with water to interact with amide O, whereas GuH+ interacts much more favorably with amide O (Kp = 2.8) (17) than does urea (Kp = 1.28).
Hydrogen bonding of urea to amide oxygens on side chains of Poly(N-isopropylacrylamide) (PNIPAM) in water has been quantified recently by FTIR (28). The fraction of PNIPAM amide O predicted to interact with urea instead of water as a function of urea concentration (using the urea-amide O Kp value in Table 1) agrees quantitatively with the fraction of PNIPAM amide O observed to be hydrogen bonded to urea (Fig. S3).
Carboxylate O: Modest accumulation of urea in the vicinity of carboxylate O (Kp = 1.13) indicates most simply that formation of a hydrogen bond donated by a urea-amide N to a carboxylate O, releasing water, is favored in comparison to hydrogen bonds of both groups to water. GB is found to be at least as strongly excluded from carboxylate O as from amide O (Kp = 0.24), because GB lacks any hydrogen bond donor group to compete with water to interact with either anionic or amide O.
Hydroxyl O: The preferential interaction of urea with hydroxyl O is modestly favorable (Kp = 1.08), though less favorable than with amide or carboxylate O. The preferential interaction of GB with hydroxyl O is weakly unfavorable (Kp = 0.97), though much less unfavorable than with amide or carboxylate O.
Amide and cationic N: Urea is weakly accumulated at amide N (Kp = 1.10) and is weakly excluded from cationic N (Kp = 0.94). These modest Kp values indicate that hydrogen bonds between the amide N of urea, acting as donor or acceptor, and an amide or cationic N on another molecule must be quite unfavorable relative to interactions with water. Because the interaction of urea with amide O is quite favorable (see above), the hydrogen bond from the amide -NH of urea to the amide O of another molecule must be favorable relative to hydrogen bonds involving water. The much weaker interaction of urea with amide and cationic N than with amide O therefore indicates that the favorable preferential interaction of these Ns with urea-amide O is largely compensated by an unfavorable preferential interaction of these Ns with urea-amide N. Hydrogen bonding of urea to amide nitrogens of the diamide aAma in water has been quantified recently from the effect of urea on amide hydrogen exchange (HX) (29); the extent of urea-amide N interaction as a function of urea concentration predicted from the experimentally derived Kp value is substantially less than that deduced from the HX data (Fig. S3).
As is the case for interactions with amide, carboxylate, and hydroxyl O surfaces, a strong contrast is observed between preferential interactions of GB and urea with amide and cationic N. From Table 1, GB is quite strongly accumulated at both amide N (Kp = 1.54) and cationic N (Kp = 1.32), presumably because hydrogen bonds donated by amide or cationic N to GB carboxylate O are favored in comparison to hydrogen bonds with water, as discussed above.
Aliphatic C: Urea is slightly accumulated at aliphatic C surface (Kp = 1.03). Though this preferential interaction is only weakly favorable, it appears to be a significant contributor to the observed effect of urea on protein stability because the composition of the surface exposed in unfolding is predominantly (65%) aliphatic C. The slight accumulation of urea in the vicinity of aliphatic C in water means that the interaction of urea with aliphatic C is slightly less unfavorable than the interaction of aliphatic C with water (the hydrophobic effect). Although the methyl groups of GB contribute a large fraction (71%) of the ASA of GB, GB is modestly excluded from aliphatic C (Kp = 0.92). Urea and GB exhibit opposite directions of preferential interactions with aliphatic C, as observed for amide O, anionic O, and cationic N.
Aromatic C: The favorable urea-aromatic interaction (Kp = 1.28), presumably a hydrogen bond from the urea-amide N to the π-system of the aromatic ring, is as favorable as the urea-amide O interaction. GB also exhibits a very favorable preferential interaction with aromatic hydrocarbon surface (Kp = 1.62), proposed to be a cation-π interaction (15); this is the most favorable interaction of GB with any type of protein surface. Because the interaction of water with aromatic surface is intrinsically unfavorable relative to self-interactions (the hydrophobic effect), interactions of urea and GB with aromatic surface need not be intrinsically favorable to be preferred to aromatic-water interactions.
Why Urea Destabilizes and GB Stabilizes Globular Proteins: Analysis Using Solute Interaction Potentials.
An important application of functional group interaction potentials like those for urea and GB in Table 1 is to predict or interpret urea and GB m-values for steps of protein processes. Most solute m-values in the literature are for the process of folding or unfolding globular proteins which, to a good approximation, expose surfaces with similar coarse-grained compositions and different surface areas. For the previously investigated comprehensive set of monomeric globular proteins (13), the average composition of the ASA exposed in unfolding the globular conformation to an extended chain is approximately 65% aliphatic C and 12% amide O, with smaller percentages of other surface types (Table 2). For the process of unfolding a protein that exposes 1,000 Å2 of ASA with this composition, Table 2 lists the predicted contributions of the different surface types to urea and GB m-values, calculated from the interaction potentials (αi) in Table 1. For both urea and GB, interactions with amide O, aliphatic C, and aromatic C make the three most significant contributions to the observed m-value. For urea, where all the significant urea-surface interactions are destabilizing, interactions with amide O contribute approximately one-third and interactions with aliphatic and aromatic C contribute one-quarter and one-fifth, respectively, of the predicted m-value. For GB, where a wide range of favorable and unfavorable interactions with protein functional groups is predicted, the contribution of the GB-amide O interaction (stabilizing) is as large as the predicted m-value; contributions from aliphatic C (stabilizing) and aromatic C (destabilizing) are about half as large in magnitude as the contribution of amide O and are opposite in sign. Table 2 also shows that urea and GB interaction potentials can be used to predict other protein interactions that involve different surface compositions, including prediction of μ23 for the interaction with the surface of a native protein such as BSA and prediction of α-helix unfolding m-values. This same approach is useful to compare urea and GuH+ as denaturants, as described in SI Text.
Table 2.
Predicted contributions to the m-value/RT or μ23/RT for exposure of 1,000 Å2 of protein surface
| Process |
Surface of native protein‡ |
||||||||
| Surface type, i |
Globular protein unfolding* |
α-helix melting† |
|||||||
| ∆ASA | Urea§ | GB§ | ∆ASA | Urea§ | GB§ | ASA | Urea§ | GB§ | |
| Amide O | 120 | −0.10 | 0.34 | 480 | −0.42 | 1.34 | 100 | −0.09 | 0.28 |
| Carboxylate O | 40 | −0.02 | 0.12 | 100 | −0.04 | 0.29 | 160 | −0.06 | 0.46 |
| Hydroxyl O | 30 | −0.01 | 0.0 | 0 | 0 | 0 | 20 | −0.01 | 0.0 |
| Amide N | 50 | −0.02 | −0.10 | 90 | −0.03 | −0.18 | 40 | −0.01 | −0.08 |
| Cationic N | 40 | 0.01 | −0.05 | 0 | 0 | 0 | 130 | 0.02 | −0.16 |
| Aliphatic C | 650 | −0.07 | 0.20 | 330 | −0.04 | 0.10 | 530 | −0.06 | 0.16 |
| Aromatic C | 70 | −0.06 | −0.16 | 0 | 0 | 0 | 20 | −0.02 | −0.05 |
| Predicted m-value/RT or μ23/RT per 1,000 Å2 of surface: | −0.27 | 0.35 | −0.53 | 1.55 | −0.22 | 0.61 | |||
| Experimentally derived value: | −0.31 | 0.34 | −1.01 | ND | −0.21 | 1.31 | |||
*Globular protein m- value/RT are from the average of the Hong et al. protein dataset (13) with the addition of trp cage (30) for urea, and from lacDBD (15) for GB. Both are scaled to 1,000 Å2.
†Average observed α-helix unfolding m-value/RT for urea is calculated by multiplying the average residue urea m-value/RT of (AEAAKA)n peptides [-0.039 M-1; (19)] by 26, the number of residues needed to expose approximately 1,000 Å2 of surface in unfolding this α-helix.
‡Modeled using urea- and GB-BSA interaction data and BSA surface composition from refs. 4 and 18, scaled to 1,000 Å2 of surface.
§Contribution to unfolding m-value/RT or urea-native protein μ23/RT from each surface type (i), calculated from (αi values from Table 1) × ΔASAi.
For the set of well-characterized globular proteins in Table S3, predicted and experimental urea m-values/RT(Δμ23/RT) are compared in Fig. 3. Interaction potentials for these calculations are from Table 1, and values for the amount and composition of the ΔASA are from Table S3, calculated using an extended chain model for the unfolded form. Excellent agreement is obtained in all but a few cases, with no systematic deviation of predicted and observed m-values. The average discrepancy is ± 16%, very similar to that observed in the comparison of predicted and observed values of μ23 for the model compound training set.
Fig. 3.

Plot of predicted vs. observed m-values for effects of urea on protein stability (see Table S3). Urea m-values were calculated using an extended model of the denatured state in urea from Hong et al. (13). (1GSD is not included in the plot because its m-value is significantly larger than the others but is included in Table S3.) Line represents equality of predicted and observed values.
Comparison to Other m-Value Analyses.
A very significant milestone in the analysis of solute effects was the observation that m-values for urea denaturation of globular proteins are approximately proportional to the ΔASA of unfolding (1). This proportionality of urea m-value to ΔASA means that only one (composite) interaction potential, instead of the seven in Table 1, is required to predict a protein unfolding value from structural data, or vice versa. However, this is because the composition of the surface that constitutes the ΔASA of unfolding is invariant (approximately 65% aliphatic hydrocarbon, approximately 17% amide, etc.). This relationship is not applicable to other protein processes, including the conversion of folded or unfolded protein to the highest lying transition state that determines the kinetic m-values, if the composition of the ΔASA is different.
Model compound chemical potential derivatives (μ23) with respect to urea molality, which are the basis for interpreting or predicting urea m-values for any protein process (Eq. 1), are most directly obtained from osmometry (Eq 2). VPO is insufficiently sensitive to use with sparingly soluble model compounds, but in these cases effects of urea on solubility provide a direct determination of μ23 (Eq 3). For all these model compounds (with the exception of most Na+ or K+ carboxylate salts), chemical potential derivatives are negative (Table S1), indicating favorable preferential interactions. Effects of urea on solubilities of more soluble amino acids and peptides have also been determined (21, 31). Although urea increases the solubility of all sparingly or moderately soluble amino acids and peptides ( molal), urea either decreases or does not change the solubility of highly soluble amino acids. Comparison of μ23 values (numerically the same as free energies of transfer from water to 1 M urea) obtained from solubility and osmometry for the most soluble amino acids (Table S4) reveals large systematic differences in six out of eight cases, presumably because of the significance of the nonideality correction (d ln γ2/d ln m2)m3 in these cases (14, 20). In principle, osmometric data in the presence of urea can be used to correct the solubility analysis (20), but where these data are available they provide μ23 directly (from Eq. 2).
Relevance of μ23 Values and Urea Interaction Potentials for Simulating Protein Interactions and Relating Protein Structure to Thermodynamics.
A computational treatment of aqueous urea solutions, developed by refining molecular dynamics simulation parameters until urea–urea and urea–water Kirkwood–Buff (KB) integrals were reproduced (32), was incorporated in simulations to predict changes in urea–protein preferential interaction coefficients and urea m-values for folding/unfolding the trp-cage miniprotein in urea solutions (33). Preferential interactions of urea with side-chain and backbone groups exposed in unfolding were found to contribute 60% and 40% of the urea m-value, respectively. For comparison, urea interaction potentials in Table 1, applied to the ΔASA of unfolding trp cage (Table S4) predict a 55%∶45% division of the destabilization between side chains and backbone. Comparisons of KB integrals for three-component urea (or GB)-model compound simulations with experimentally determined chemical potential derivatives (μ23; see Table S1 and ref. 15) will allow further refinement of the parameters of these simulations; an initial study of this type has been reported (34).
Once interactions of other amides with the set of model compounds studied here are experimentally determined to complement the data reported here for urea, these interactions can be dissected to obtain thermodynamic information about interactions of amide O and amide N moieties of urea and other amides with the various functional groups of proteins. This analysis will fully test the assumption of additivity used to dissect urea-model compound interactions and will allow the contributions of interactions involving amide O and N moieties to the stability of folded proteins and protein complexes to be assessed.
Materials and Methods
Details about materials, experimental procedures (vapor pressure osmometry, solubility, and cmc measurements) and data analysis (determining μ23, surface area calculations) are provided in SI Text.
Supplementary Material
Acknowledgments.
The authors thank R. L. Baldwin and the reviewers for their valuable comments on the manuscript. This research was supported by National Institutes of Health GM 47022.
Footnotes
The authors declare no conflict of interest.
*This Direct Submission article had a prearranged editor.
This article contains supporting information online at www.pnas.org/lookup/suppl/doi:10.1073/pnas.1109372108/-/DCSupplemental.
References
- 1.Myers JK, Pace CN, Scholtz JM. Denaturant m values and heat capacity changes: Relation to changes in accessible surface areas of protein unfolding. Protein Sci. 1995;4:2138–2148. doi: 10.1002/pro.5560041020. [DOI] [PMC free article] [PubMed] [Google Scholar]
- 2.Felitsky DJ, Record MT. Thermal and urea-induced unfolding of the marginally stable lac repressor DNA-binding domain: A model system for analysis of solute effects on protein processes. Biochemistry. 2003;42:2202–2217. doi: 10.1021/bi0270992. [DOI] [PubMed] [Google Scholar]
- 3.Santoro MM, Liu YH, Khan SMA, Hou LX, Bolen DW. Increased thermal-stability of proteins in the presence of naturally occurring osmolytes. Biochemistry. 1992;31:5278–5283. doi: 10.1021/bi00138a006. [DOI] [PubMed] [Google Scholar]
- 4.Felitsky DJ, et al. The exclusion of glycine betaine from anionic biopolymer surface: Why glycine betaine is an effective osmoprotectant but also a compatible solute. Biochemistry. 2004;43:14732–14743. doi: 10.1021/bi049115w. [DOI] [PubMed] [Google Scholar]
- 5.Hong J, et al. Preferential interactions of glycine betaine and of urea with DNA: Implications for DNA hydration and for effects of these solutes on DNA stability. Biochemistry. 2004;43:14744–14758. doi: 10.1021/bi049096q. [DOI] [PubMed] [Google Scholar]
- 6.von Hippel PH, Schleich T. Ion effects on the solution structure of biological macromolecules. Acc Chem Res. 1969;2:257–265. [Google Scholar]
- 7.Baldwin RL. How Hofmeister ion interactions affect protein stability. Biophys J. 1996;71:2056–2063. doi: 10.1016/S0006-3495(96)79404-3. [DOI] [PMC free article] [PubMed] [Google Scholar]
- 8.Pegram LM, et al. Why Hofmeister effects of many salts favor protein folding but not DNA helix formation. Proc Natl Acad Sci USA. 2010;107:7716–7721. doi: 10.1073/pnas.0913376107. [DOI] [PMC free article] [PubMed] [Google Scholar]
- 9.Rees WA, Yager TD, Korte J, von Hippel PH. Betaine can eliminate the base pair composition dependence of DNA melting. Biochemistry. 1993;32:137–144. doi: 10.1021/bi00052a019. [DOI] [PubMed] [Google Scholar]
- 10.Shelton VM, Sosnick TR, Pan T. Applicability of urea in the thermodynamic analysis of secondary and tertiary RNA folding. Biochemistry. 1999;38:16831–16839. doi: 10.1021/bi991699s. [DOI] [PubMed] [Google Scholar]
- 11.Lambert D, Draper DE. Effects of osmolytes on RNA secondary and tertiary structure stabilities and RNA-mg interactions. J Mol Biol. 2007;370:993–1005. doi: 10.1016/j.jmb.2007.03.080. [DOI] [PMC free article] [PubMed] [Google Scholar]
- 12.Knowles DB, LaCroix AS, Deines NF, Shkel I, Record MT. Separation of preferential interaction and excluded volume effects on DNA duplex and hairpin stability. Proc Natl Acad Sci USA. 2011;31:12699–12704. doi: 10.1073/pnas.1103382108. [DOI] [PMC free article] [PubMed] [Google Scholar]
- 13.Hong J, Capp MW, Saecker RM, Record MT. Use of urea and glycine betaine to quantify coupled folding and probe the burial of DNA phosphates in lac repressor-lac operator binding. Biochemistry. 2005;44:16896–16911. doi: 10.1021/bi0515218. [DOI] [PMC free article] [PubMed] [Google Scholar]
- 14.Cannon JG, Anderson CF, Record MT. Urea-amide preferential interactions in water: Quantitative comparison of model compound data with biopolymer results using water accessible surface areas. J Phys Chem B. 2007;111:9675–9685. doi: 10.1021/jp072037c. [DOI] [PubMed] [Google Scholar]
- 15.Capp MW, et al. Interactions of the osmolyte glycine betaine with molecular surfaces in water: Thermodynamics, structural interpretation, and prediction of m-values. Biochemistry. 2009;48:10372–10379. doi: 10.1021/bi901273r. [DOI] [PMC free article] [PubMed] [Google Scholar]
- 16.Courtenay ES, Capp MW, Saecker RM, Record MT. Thermodynamic analysis of interactions between denaturants and protein surface exposed on unfolding: Interpretation of urea and guanidinium chloride m-values and their correlation with changes in accessible surface area (ASA) using preferential interaction coefficients and the local-bulk domain model. Proteins. 2000;41:72–85. doi: 10.1002/1097-0134(2000)41:4+<72::aid-prot70>3.0.co;2-7. [DOI] [PubMed] [Google Scholar]
- 17.Pegram LM, Record MT. Thermodynamic origin of Hofmeister ion effects. J Phys Chem B. 2008;112:9428–9436. doi: 10.1021/jp800816a. [DOI] [PMC free article] [PubMed] [Google Scholar]
- 18.Courtenay ES, Capp MW, Record MT. Thermodynamics of interactions of urea and guanidinium salts with protein surface: Relationship between solute effects on protein processes and changes in water-accessible surface area. Protein Sci. 2001;10:2485–2497. doi: 10.1110/ps.ps.20801. [DOI] [PMC free article] [PubMed] [Google Scholar]
- 19.Scholtz JM, Barrick D, York EJ, Stewart JM, Baldwin RL. Urea unfolding of peptide helices as a model for interpreting protein unfolding. Proc Natl Acad Sci USA. 1995;92:185–189. doi: 10.1073/pnas.92.1.185. [DOI] [PMC free article] [PubMed] [Google Scholar]
- 20.Auton M, Holthauzen LMF, Bolen DW. Anatomy of energetic changes accompanying urea-induced protein denaturation. Proc Natl Acad Sci USA. 2007;104:15317–15322. doi: 10.1073/pnas.0706251104. [DOI] [PMC free article] [PubMed] [Google Scholar]
- 21.Nozaki Y, Tanford C. The solubility of amino acids and related compounds in aqueous urea solutions. J Biol Chem. 1963;238:4074–4081. [PubMed] [Google Scholar]
- 22.Robinson RA, Stokes RH. Activity coefficients in aqueous solutions of sucrose, mannitol, and their mixtures at 25 degrees C. J Phys Chem. 1961;65:1954–1958. [Google Scholar]
- 23.Anderson CF, Record MT. Gibbs-Duhem-based relationships among derivatives expressing the concentration dependences of selected chemical potentials for a multicomponent system. Biophys Chem. 2004;112:165–175. doi: 10.1016/j.bpc.2004.07.016. [DOI] [PubMed] [Google Scholar]
- 24.Nandi PK, Robinson DR. Effects of urea and guanidine hydrochloride on peptide and nonpolar groups. Biochemistry. 1984;23:6661–6668. doi: 10.1021/bi00321a058. [DOI] [PubMed] [Google Scholar]
- 25.Pegram LM, Record MT. Partitioning of atmospherically relevent ions between bulk water and the water/vapor interface. Proc Natl Acad Sci USA. 2006;103:14278–14281. doi: 10.1073/pnas.0606256103. [DOI] [PMC free article] [PubMed] [Google Scholar]
- 26.Record MT, Anderson CF. Interpretation of preferential interaction coefficients of nonelectrolytes and of electrolyte ions in terms of a two-domain model. Biophys J. 1995;68:786–794. doi: 10.1016/S0006-3495(95)80254-7. [DOI] [PMC free article] [PubMed] [Google Scholar]
- 27.Street TO, Bolen DW, Rose GD. A molecular mechanism for osmolyte-induced protein stability. Proc Natl Acad Sci USA. 2006;103:13997–14002. doi: 10.1073/pnas.0606236103. [DOI] [PMC free article] [PubMed] [Google Scholar]
- 28.Sagle LB, et al. Investigating the hydrogen-bonding model of urea denaturation. J Am Chem Soc. 2009;131:9304–9310. doi: 10.1021/ja9016057. [DOI] [PubMed] [Google Scholar]
- 29.Lim WK, Rosgen J, Englander SW. Urea, but not guanidinium, destabilizes proteins by forming hydrogen bonds to the peptide group. Proc Natl Acad Sci USA. 2009;106:2595–2600. doi: 10.1073/pnas.0812588106. [DOI] [PMC free article] [PubMed] [Google Scholar]
- 30.Wafer LNR, Streicher WW, Makhatadze GI. Thermodynamics of the trp-cage miniprotein unfolding in urea. Proteins. 2010;78:1376–1381. doi: 10.1002/prot.22681. [DOI] [PMC free article] [PubMed] [Google Scholar]
- 31.Wang A, Bolen DW. A naturally occurring protective system in urea-rich cells: Mechanism of osmolyte protection of proteins against urea denaturation. Biochemistry. 1997;36:9101–9108. doi: 10.1021/bi970247h. [DOI] [PubMed] [Google Scholar]
- 32.Weerasinghe S, Smith PE. A Kirkwood-Buff derived force field for mixtures of urea and water. J Phys Chem B. 2003;107:3891–3898. [Google Scholar]
- 33.Canchi DR, Garcia AE. Backbone and side-chain contributions in protein denaturation by urea. Biophys J. 2011;100:1526–1533. doi: 10.1016/j.bpj.2011.01.028. [DOI] [PMC free article] [PubMed] [Google Scholar]
- 34.Ma L, Pegram L, Record MT, Cui Q. Preferential interactions between small solutes and the protein backbone: A computational analysis. Biochemistry. 2010;49:1954–1962. doi: 10.1021/bi9020082. [DOI] [PMC free article] [PubMed] [Google Scholar]
Associated Data
This section collects any data citations, data availability statements, or supplementary materials included in this article.