

Abstract
The Drosophila Y chromosome is a degenerated, heterochromatic chromosome with few functional genes. Nonetheless, natural variation on the Y chromosome in Drosophila melanogaster has substantial trans-acting effects on the regulation of X-linked and autosomal genes. However, the contribution of Y chromosome divergence to gene expression divergence between species is unknown. In this study, we constructed a series of Y chromosome introgression lines, in which Y chromosomes from either Drosophila sechellia or Drosophila simulans are introgressed into a common D. simulans genetic background. Using these lines, we compared genome-wide gene expression and male reproductive phenotypes between heterospecific and conspecific Y chromosomes. We find significant differences in expression for 122 genes, or 2.84% of all genes analyzed. Genes down-regulated in males with heterospecific Y chromosomes are significantly biased toward testis-specific expression patterns. These same lines show reduced fecundity and sperm competitive ability. Taken together, these results imply a significant role for Y/X and Y/autosome interactions in maintaining proper expression of male-specific genes, either directly or via indirect effects on male reproductive tissue development or function.
Keywords: evolution, regulatory divergence, male fitness
The Y chromosome in Drosophila melanogaster comprises ∼40 MB of sequence (∼20% of the male genome), but contains fewer than 20 protein-coding genes, most of which are specialized male reproductive genes (1–5). The vast bulk of the chromosome is comprised of large blocks of repetitive sequences, including large microsatellite repeats, transposable element-derived sequence, and bobbed, the Y-linked rDNA array (6). The heterochromatic and gene-poor nature of the Y chromosome is consistent with theoretical models that predict rapid degeneration and specialization for male-specific functions of Y chromosomes in the absence of recombination (7–9). Furthermore, the hemizygous nature of the Y chromosome, combined with the lack of recombination, makes it uniquely susceptible to population genetic processes that reduce genetic variation and limit adaptation (10–13).
As predicted by theory, little or no SNP polymorphism exists in single-copy protein-coding sequences on the Y chromosome (7, 14–16). However, several cytological forms of the Y chromosome segregate in at least some species of Drosophila (17), and molecular evidence also suggests that the Y chromosome is not monomorphic. Variation exists for the size of repetitive DNA blocks (18, 19), and Y-linked genetic variation associates with variation in organismal phenotypes, including thermal tolerance of spermatogenesis (20, 21) and male mating success (22). Nonetheless, direct tests of association between variation at the rDNA locus and phenotypes reveal no significant effect (18) and theoretical predictions suggest that nonneutral variation on the Y chromosome can only be maintained under very restrictive conditions (23, 24). We have previously shown that Y-linked genetic variation segregating within D. melanogaster has transacting effects on the expression of hundreds of autosomal and X-linked genes (25–27), a phenomenon known as Y-linked regulatory variation (YRV). Collectively, these genes are more likely to be male-biased in expression and to diverge in expression between species (25), and are likely mediated at least in part by variation in rDNA sequence on the Y chromosome (28).
Over longer time scales, empirical results suggest the Y chromosome is evolutionarily dynamic. Gene content on the Y chromosome has changed dramatically during the course of Drosophila evolution: only 3 of the 12 Y-linked genes in D. melanogaster that have been studied carefully are Y-linked in all 10 sequenced Drosophila genomes with homologous Y chromosomes (3). Additionally, at least part of the Y-linked gene kl-2 appears to have duplicated in the Drosophila simulans lineage after divergence from its common ancestor with D. melanogaster (16). Repetitive DNA on Drosophila Y chromosomes has also diverged rapidly. The Y-linked rDNA cistrons in D. melanogaster are absent in the D. simulans species complex (29), and both D. melanogaster and D. simulans appear to carry at least one species-specific Y-linked simple-sequence repeat (30, 31).
What, if any, functional consequences arise from this rapid diversification between species is less clear, given the small number of Y-linked genes. Introgressions of Y chromosomes from D. simulans into Drosophila sechellia or between Drosophila mauritiana and D. simulans produce sterile or nearly sterile F2 males (32, 33); however, D. sechellia Y chromosomes can be successfully introgressed into a D. simulans background (31, 32). These males, although not sterile, have lower fecundity after repeated mating to virgin females (33), reduced sperm displacement ability (33), and shorter sperm (34). Although it is clear these phenotypes must ultimately derive from disruptions of interactions between the Y chromosome and the autosomes or X chromosomes, the mechanistic basis for these effects is unknown.
In this study, we constructed an independent set of Y chromosome introgression lines, in which either D. sechellia or D. simulans Y chromosomes were introgressed into a common laboratory D. simulans background. We show that male reproductive phenotypes are disrupted in heterospecific Y chromosome introgressions. We also measured genome-wide gene expression in these introgression lines, and identified a suite of testes-specific genes that are down-regulated in lines with heterospecific Y chromosomes.
Results
Introgression Lines with a D. sechellia Y Chromosome Have Lower Male Reproductive Fitness.
We measured six components of male fitness in males from eight Y introgression lines, all with autosomes and X chromosomes from D. simulans (University of California at San Diego Stock Center Line 14021–0251.092) and carrying either a D. simulans (Cameroon) or a D. sechellia Y chromosome (Y[sim] and Y[sec] lines, respectively). These phenotypes were: male lifetime fecundity, offensive sperm competitive ability, defensive sperm competitive ability, time to copulation, copulation duration, and relative male viability (in two different genetic backgrounds). For each phenotype, we tested for significant differences between males from Y[sim] and Y[sec] lines (see Materials and Methods for details).
Males from Y[sec] lines produce on average only 63% as many offspring as males from Y[sim] lines (D. simulans Y: 220 offspring per male; D. sechellia Y: 140 offspring per male) (Fig. 1A), a significant difference (χ2 = 6.86, df = 1, P value = 0.0088). In sperm competition tests, Y[sec] males sire only 9.4% of offspring when they are the first male to mate (defensive sperm competitive ability, P1) and 67.2% when they are the second male to mate (offensive sperm competitive ability, P2), compared with 21.1% and 87.2% for Y[sim] males (Fig. 1 B and C). In both cases, the effect of species is significant (P1: χ2 = 7.62, df = 1, P value = 0.0058; P2: χ2 = 4.31, df = 1, P value = 0.0379). These results are consistent with and extend earlier reports suggesting defects in reproductive phenotypes of Y chromosome introgression lines (33, 34). We did not find significant differences between Y[sim] and Y[sec] lines for relative male viability [line 092 females: Fisher's Exact Test (FET) P value = 0.547; w501 females: FET P value = 0.252], time to copulation (z-score = −0.79, P value = 0.43) or copulation duration (χ2 = 0.8428, df = 1, P value = 0.3586).
Fig. 1.

Mean values of (A) lifetime male fecundity, (B) defensive sperm competitive ability (P1), and (C) offensive sperm competitive ability (P2) for males carrying either a D. simulans or a D. sechellia Y chromosome. P values are derived from mixed linear models (see Materials and Methods for details), and error bars show the 95% confidence intervals on the means for each species.
Patterns of Gene Expression Depend on the Species of Origin of the Y Chromosome.
We measured whole-genome gene expression, using custom printed D. melanogaster cDNA arrays. After preprocessing and filtering to remove low-quality or divergent probes, we fit a linear contrast using the R/Bioconductor package Limma to test for Y-linked regulatory divergence (YRD) between the four Y[sim] lines and the four Y[sec] lines. We detected differential expression of 122 genes (2.84% of the 4,299 genes analyzed) at a 10% false-discovery rate (FDR); using a 5% or 1% FDR results in significant differential expression of 73 and 12 genes, respectively. Although we discuss the 10% FDR results below, our conclusions are qualitatively identical with more conservative cutoffs. The magnitude of change is not extreme: log2 fold-change ranges from −0.597 to 0.974 (Fig. S1). Differentially regulated genes are widely distributed across the genome, occurring on all major autosomes (excluding the fourth, for which only 19 genes passed QC filtering, and the Y chromosome, for which no probes passed our QC filtering), in proportions not significantly different from those expected by chance (χ2 = 2.88, df = 5, P value = 0.7178) (Fig. S2).
We also fit contrasts for all unique pairwise tests within either Y[sim] or Y[sec] lines and estimated moderated F-statistics to test for intraspecific YRV. Among Y[sim] lines, 83 genes (1.93% of the 4,299 genes analyzed) varied in expression at a 10% FDR. However, there is little evidence for gene-expression variation among Y[sec] lines: we detect differential expression at a 10% FDR of only four genes (CG7953, CG11825, CG10472, and CG5932). The higher amount of gene expression variation among D. simulans Y chromosomes relative to D. sechellia Y chromosomes may be because of the paucity of natural genetic variation in D. sechellia (35) that results from its small population size. Alternatively, the Y[sim] lines may better represent natural segregating variation: Y[sim] chromosomes are derived from recently collected populations, whereas Y[sec] chromosomes are derived from laboratory stocks collected primarily in the 1980s.
Genes Down-Regulated in Y[sec] Lines Relative to Y[sim] Lines Are Testes-Specific.
Several lines of evidence suggest that the genes down-regulated in Y[sec] lines relative to Y[sim] lines are heavily biased toward genes with male-specific reproductive functions. We first compared the proportion of genes that are male-biased in D. simulans, based on D. simulans-specific expression values (36). There is a significant overrepresentation of male-biased genes in the down-regulated class (χ2 = 82.99, df = 2, P value < 2.2 × 10⁻¹⁶) (Fig. 2A): 89.2% of down-regulated genes for which we have D. simulans expression data are male-biased, compared with 24.7% of nonregulated genes and 14.6% of up-regulated genes. We also examined patterns of tissue specificity of expression for these genes using a measure of tissue specificity calculated from D. melanogaster tissue-specific expression data (37), which discriminates clearly between testes-specific and nonspecific genes (Fig. S3) (see Materials and Methods for details). Down-regulated genes have a significant excess of testis-specific genes compared with other genes: 77.4% of down-regulated genes for which we have D. melanogaster tissue-specific expression data are testes-specific, compared with 14.5% of nonregulated genes and only 3.6% of up-regulated genes (χ2 = 165.82, df = 2, P value < 2.2 × 10⁻¹⁶) (Fig. 2B). Overall, genes with testes-specific expression in D. melanogaster, male-biased expression in D. simulans, presence in the D. melanogaster sperm proteome (38), or male-sterile phenotypes (39) represent 83.6% of the total down-regulated gene set but only 28% of the nonregulated set and 23.9% of the up-regulated set (down-regulated vs. nonregulated: FET P value < 2.2 × 10⁻¹⁶; up-regulated vs. nonregulated: FET P value = 0.496).
Fig. 2.

Overrepresentation of male-biased functions among genes down-regulated in introgression lines with heterospecific Y chromosomes. (A) The proportion of genes that are male-biased based on D. simulans expression data for each expression class. (B) The proportion of genes that are testes-specific for each expression class. P values (based on χ2 tests) < 2.2 × 10⁻¹⁶ for both cases.
Little is known about many of the significantly down-regulated genes beyond data from genomic screens: only 23 of the 55 down-regulated genes have any functional annotations in FlyBase. However, comparison of stage-specific expression patterns in D. melanogaster spermatogenesis (40) shows that 39 of 55 down-regulated genes (70.9%) have their highest mRNA levels in the distal region of the testis, which is enriched for postmeiotic cell populations (elongating spermatid cysts and individualized spermatid bundles); only 30.6% and 31.3% of nonsignificant and up-regulated genes, respectively, have their highest mRNA levels in the distal part of the testis (χ2 = 41.2, df = 2, P value = 1.12 × 10⁻⁹). A close examination of those cases for which functional annotations exist supports the hypothesis that it is primarily spermiogenesis/terminal differentiation genes and sperm structural components that are down-regulated in Y[sec] lines. Two of the top five most strongly down-regulated genes are Mst84Da and Mst84Db, which are members of a four-gene cluster (Mst84Dc is also significantly down-regulated; we do not have expression data for Mst84Dd) that, when deleted in D. melanogaster, reduces the number of motile sperm produced by the fly (41). The Mst84D cluster, as well as other down-regulated genes Mst98Cb and Mst77F, are canonical terminal differentiation genes (42). Several important structural constituents of sperm—including S-Lap1, S-Lap4 (43), and Mst98Cb (44)—are also down-regulated in Y[sec] lines. Notably, late-stage spermatogenesis genes appear to be predominant among misexpressed genes in sterile hybrids in both Drosophila (45) and mouse (46).
Genes Up-Regulated in Y[sec] Lines Relative to Y[sim] Lines Are Involved in Metabolic Processes.
Genes that are expressed at a higher level in introgression lines carrying heterospecific Y chromosomes are functionally distinct from down-regulated genes. We analyzed Gene Ontology (GO) categories to test for overrepresentation among both down-regulated and up-regulated subsets. Although there are no GO categories significantly overrepresented among the down-regulated subset (likely because testes-specific genes that have no other functional information are unannotated in GO), we find several GO categories related to oxidative phosphorylation and glucose metabolism overrepresented among the up-regulated set (Table 1 and Fig. S4). In addition, we find a significant overrepresentation of genes specifically expressed in the midgut among the up-regulated gene-set (Fig. 3), although this is not nearly as dramatic an effect as the testis-specificity observed among down-regulated genes. These genes include several maltases (Mal-A1, Mal-A7, Mal-A8), serine-type endopeptidases (CG17571 and CG7542), and a lipase (CG6295).
Table 1.
Selected GO classes significantly overrepresented among genes up-regulated in Y[sec] lines relative to Y[sim] lines
| Category | Description | Term freq (up-regulated) | Term freq (background) | P value (Bonferroni-corrected) |
| Biological process | ||||
| GO:0006006 | Glucose metabolic process | 5/50 (10%) | 10/3348 (0.3%) | 5.83 × 10−05 |
| GO:0006119 | Oxidative phosphorylation | 8/50 (16.0%) | 44/3348 (1.3%) | 6.60 × 10−05 |
| Cellular location | ||||
| GO:0005743 | Mitochondrial inner membrane | 10/50 (20.0%) | 93/3348 (2.8%) | 2.79 × 10−04 |
| Molecular function | ||||
| GO:0004553 | Hydrolase activity, hydrolyzing O-glycosyl compounds | 5/50 (10.0%) | 21/3348 (0.6%) | 4.16 × 10−03 |
Full results are presented as Fig. S4. There are no GO terms significantly enriched among the down-regulated gene class.
Fig. 3.

The proportion of genes that are midgut-specific for each expression class. P value (χ2 test) = 1.187 × 10⁻¹².
Coherent Set of Genes Have Expression Patterns Affected by Y-Linked Variation and Y-Linked Divergence.
Genes with evidence for expression variation in D. sechellia and D. simulans strongly overlap: three of four D. sechellia YRV genes also show evidence for YRV in D. simulans (FET P value: 2.739 × 10⁻⁵). The −log10 P values for variation in D. simulans and D. sechellia are also highly significantly correlated (Spearman's ρ: 0.175, P value < 2.2 × 10⁻¹⁶). There is significant overlap between genes with evidence for YRD and for YRV in either D. simulans or D. sechellia (FET P value: 8.3 × 10⁻¹⁰). There is also significant overlap among genes previously shown to be affected by YRV in D. melanogaster (25) and genes affected by YRD (FET P value: 6.5 × 10⁻¹¹), within-D. simulans YRV (FET P value: 3.97 × 10⁻¹¹), and within-D. sechellia YRV (FET P value: 0.00124). Testis-specific and midgut-specific genes are also overrepresented among the D. simulans YRV gene set (FET P value < 2.2 × 10⁻¹⁶) and the previously published D. melanogaster YRV gene set (FET P value = 2.1 × 10⁻⁹). These findings suggest that the Y chromosome acts to regulate a common set of genes involved in spermatogenesis and metabolic processes across a wide variety of contexts.
Discussion
The Y chromosome, although heterochromatic and gene-poor, is an important regulator of gene expression within species (25, 47), and intraspecific variation on the Y chromosome has been linked to several organismal phenotypes (20–22). Here, we show that interspecific divergence on the Y chromosome is an important component of gene expression and phenotypic evolution. We find that 2% to 3% of the genome is disrupted in expression in Y introgression lines, and that these genes are clustered into very specific functional groups: genes down-regulated in the presence of a heterospecific Y chromosome are testis-specific genes involved in the late stages of spermatogenesis, and genes up-regulated in the presence of a heterospecific Y chromosomes are midgut-specific genes and oxidative phosphorylation genes involved in metabolic processes.
We also find that male reproductive phenotypes are disrupted in heterospecific Y introgression lines: males from Y[sec] lines have significantly reduced lifetime fecundity and sperm competitive ability. It is interesting to note that these phenotypic differences (and the lack of difference in male viability and copulation onset and duration) are consistent with the observed gene expression differences of the genes down-regulated in Y[sec] lines. The gene expression changes point to disruption of sperm formation, potentially affecting sperm number and structure. Likewise, we observed phenotypic differences in the traits most likely to be affected by defects in sperm number and structure, but no differences in other traits that we measured. Heterospecific introgressions may have increased lifespans relative to conspecific introgressions (33), which, when combined with our observation of increased expression of metabolic genes in heterospecific introgressions, suggests the possibility of a trade-off between reproductive and nonreproductive (metabolism, longevity) phenotypes mediated by the Y chromosome.
At least two hypotheses are consistent with the observed association between gene expression and phenotype in heterospecific Y chromosome introgression lines. On the one hand, divergent factors on the Y chromosome could lead to dysfunctional testes, and this gonadal dysfunction could then lead to changes in gene expression, as for example is observed in D. melanogaster/D. simulans hybrids (48). In this case, the gene expression differences we observe could be the consequence of the phenotypic disruption. Alternatively, direct interactions between the Y chromosome and one or more mis-regulated genes could be disrupted in heterospecific introgressions, leading to direct mis-regulation. In this case, the gene expression differences we observe could be the cause of the phenotypic disruption. Disentangling direct and indirect effects, and the direction of causality between expression mis-regulation and phenotypic disruption, especially in interspecific hybrids where gonadal dysfunction is probable, remains a challenge (49), and in this case further work is needed to clarify the mechanistic basis of the associations we observe. However, we note that the consistent overrepresentation of testes- and midgut-biased genes among not only those genes differentially expressed between Y[sim] and Y[sec] lines, but also among genes that vary in expression among Y[sim] lines and among D. melanogaster Y chromosome replacement lines, where gonadal dysfunction is unlikely, argues against gene expression differences as solely a consequence of underlying tissue disruption.
The genes that are down-regulated in males carrying a heterospecific Y chromosome appear to be biased toward a specific subset of testes-expressed genes: terminal differentiation/spermiogenesis genes, and in particular those that function postmeiotically, such as Mst84D, Mst98C, and Mst77F (41, 42, 44, 50, 51). It is becoming increasingly clear that disruption of genes that function postmeiotically plays a major role in hybrid male sterility (52). Cytological characterization of sterile male hybrid testes in D. sechellia × D. simulans F1 offspring reveals significant postmeiotic disruption of spermatogenesis (53), a finding that is consistent with a bias toward underexpression of late-stage genes in sterile F1 hybrid males (45, 54–57). Our observation that Y chromosome introgressions alone are sufficient to recapitulate this underexpression of postmeiotic genes suggests that disruption of Y/X or Y/autosome interactions may play a role in disrupting the proper regulation of terminal differentiation, either directly via divergence of trans-acting regulatory variation on the Y chromosome, or indirectly via divergence of Y-linked functional elements necessary for proper testes development and function.
Of particular interest is the hypothesis that the Y chromosome may act as a partner in one or more Dobzhansky-Muller incompatibilities (DMI) involved in hybrid sterility in Drosophila. Interspecific divergence of heterochromatin is a potential driver of hybrid incompatibilities (52, 58), and it likely plays a role in at least three different hybrid incompatibility systems in Drosophila: Zhr, a D. melanogaster-specific satellite repeat in the centric heterochromatin of the X chromosome that causes hybrid lethality in interaction with an unknown factor or factors in D. simulans (59); D. simulans Lhr, which together with D. melanogaster Hmr forms a lethal DMI, and localizes to centric heterochromatin (60); and Ods, which causes hybrid sterility in crosses between D. simulans and D. mauritiana (61) and interacts with Y chromosome heterochromatin (62). An intriguing possibility is that divergence of Y-linked heterochromatic satellite DNA between D. sechellia and D. simulans leads to disruption of an interaction with an unknown partner that controls proper expression of late-stage spermatogenesis genes.
The implication of these results is that, at least in terms of gene expression in male reproductive tissue, Y/autosome or Y/X chromosome interactions may play a significant role in maintaining appropriate expression levels, either directly or indirectly via the effects of heterospecific Y chromosomes on the function and morphology of reproductive tissues. Our results highlight the role of the Y chromosome as a source of evolutionary important variation that is relevant to male fitness and species divergence.
Materials and Methods
Fly Lines.
Y[sim] lines (lines carrying an extracted Y chromosome from a natural D. simulans population on a laboratory D. simulans background) were created by crossing males from a Cameroon population sample collected by John Pool in 2004 (63) to San Diego Stock Center line 14021–0251.092 with genotype Dsim\g[1]; cn[1]; e[1]; ey[1] (abbreviated as line 092); the full crossing scheme is shown in Fig. S5A. Y[sec] lines (lines carrying an extracted Y chromosome from a D. sechellia stock on the 092 D. simulans background) were created using the same D. simulans background according to the crossing scheme shown in Fig. S5B. This male-parent backcross approach, which leverages multiply marked chromosomes and the absence of recombination in males, assures that no foreign genetic material is segregating in our experimental lines, which previous introgression approaching using repeated backcrossing (33, 64) cannot guarantee. Four D. sechellia Y introgressions (carrying Y chromosomes from stocks 14021–0248.01, 14021–0248.03, 14021–0248.08, 14021–0248.27, abbreviated using the last two digits of the stock center identifier) and four D. simulans extraction lines (carrying Y chromosomes from Cameroon stocks Ya19, Ya23, Ya24, and Ya26) were used for further analysis.
Organismal Phenotypes in Y Introgression Lines.
We measured lifetime male fecundity, relative male viability, offensive sperm competitive ability, defensive sperm competitive ability, time to copulation, and copulation duration across our set of Y introgression lines. Full experimental details are provided in SI Materials and Methods. To test for significant differences between Y[sim] and Y[sec] males, we first transformed phenotypic measures as necessary to improve fit to normality, and then tested for a main effect of Y chromosome species of origin using linear mixed models (fecundity, sperm competitive ability, copulation duration), FET (relative male viability), or Cox proportional hazards mixed models (time to copulation). All statistical analysis was performed in R. Full details of statistical tests are provided in SI Materials and Methods.
RNA Extraction and Microarray Hybridization.
Before RNA extraction, lines were expanded in bottle culture at constant light/25 °C. We froze four biological replicates of 3- to 5-d-old whole males for each Y line at −80 °C, extracted RNA using TRIzol, synthesized cDNA, and hybridized two-color cDNA microarrays using previously described protocols (25). Each of our eight samples was included in four hybridizations, each replicated as a dye swap, for a total of 32 arrays (Fig. S6). We scanned arrays using an Axon 4000B scanner and GenePix 6.0 software, adjusting PMT for each channel separately to obtain a distribution of Cy3/Cy5 ratios with a median close to 1. We inspected each array image and manually excluded poor-quality regions. We also excluded spots that failed to meet the following criteria: 50% of pixels greater than 1 SD above background in at least one channel, median foreground in at least one channel greater than two times the background, and number of foreground pixels greater than 25.
Statistical Analysis of Microarray Data.
Raw microarray data were analyzed with Bioconductor/Limma (65), using the normexp method for background correction (66) and the loess and Aquantile methods for within- and between-array normalization, respectively (67). We only kept probes for which at least 50% of arrays had good quality data, the probe sequence had a single unique hit in the D. simulans genome, and the probe overlapped an annotated gene. In cases where multiple probes map to a single FBgn, we selected a single probe for each FBgn first by selecting the probe present in the highest fraction of isoforms, then by selecting the probe with the fewest total mismatches plus gaps to the D. simulans genome, and finally by selecting the longest probe remaining. In total, we included data from 4,299 probes. All microarray data are deposited at the National Center for Biotechnology Information Gene Expression Omnibus database with accession number GSE31907.
We generated array weights to down-weight lower quality arrays (68), and fit a linear model using Limma method lmfit (69) with a design matrix parameterized using Y[Sec01] as the reference and including a Dye term. To detect expression differences between lines carrying a D. simulans Y and a D. sechellia Y we fit the contrast: [(Sec03 + Sec08 + Sec27)/4] − [(Ya19 + Ya23 + Ya24 + Ya26)/4]. Negative fold-change values represent lower expression in Y[sec] males relative to Y[sim] males. We also tested for within-species variation using F-tests in Limma on the set of nonredundant within-D. simulans and within-D. sechellia contrasts. All P values from Limma are adjusted for multiple testing using an FDR approach (70). We focus on the 10% FDR dataset, but our conclusions are not substantially affected by using a different cutoff.
Gene Expression Datasets.
For gene expression across tissues in D. melanogaster, we use the data available on FlyAtlas (37), downloaded April 2011. We filter the data to include a nonredundant set of adult tissues (brain, eye, thoracicoabdominal ganglion, crop, midgut, hindgut, tubule, ovary, virgin spermatheca, testis, accessory glands, salivary gland, adult fat body, heart, and trachea). For each Affymetrix probe in the FlyAtlas dataset, for each tissue, we set expression level to 0 unless the probe is called as “present” in at least two (of four) arrays, and then average over all probes and arrays for each FBgn to calculate an expression level for each gene in each tissue. We then calculate τ as previously described (71), and calculate tissue specificity for tissue i in a set of tissues n as:
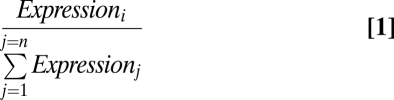 |
This measure of tissue specificity ranges from 0 if a gene is not expressed in tissue i to 1 if a gene is exclusively expressed in tissue i. We define genes as specific to tissue i if the tissue specificity index for tissue i is ≥ 0.90. For sex-specific gene expression in D. simulans, we use genes called as male-biased based on previously published expression levels in males and females after hybridization to custom, species-specific Nimblegen arrays (36).
GO Enrichment Methods.
To detect significant enrichment in GO categories, we use the term-enrichment tool available as part of AmiGO (http://amigo.geneontology.org), excluding terms with “Inferred by electronic annotation” evidence only, using a Bonferroni-corrected P value cutoff of 0.05, and using the set of probes passing our QC filters as the background set.
Supplementary Material
Acknowledgments
We thank Chip Aquadro for providing fly lines; Pema Namgyal for help with phenotyping; and Amanda Larracuente, Julien Ayroles, Mohamed Noor, and Norman Johnson for valuable comments on the manuscript. This work was supported by National Institutes of Health Grants F32 GM086950 (to T.B.S.) and R01 GM084236 (to D.L.H.).
Footnotes
The authors declare no conflict of interest.
Data deposition: The data reported in this paper have been deposited in the Gene Expression Omnibus (GEO) database, www.ncbi.nlm.nih.gov/geo (accession no. GSE31907).
This article contains supporting information online at www.pnas.org/lookup/suppl/doi:10.1073/pnas.1114690108/-/DCSupplemental.
References
- 1.Krsticevic FJ, Santos HL, Januário S, Schrago CG, Carvalho AB. Functional copies of the Mst77F gene on the Y chromosome of Drosophila melanogaster. Genetics. 2010;184:295–307. doi: 10.1534/genetics.109.107516. [DOI] [PMC free article] [PubMed] [Google Scholar]
- 2.Carvalho AB, Dobo BA, Vibranovski MD, Clark AG. Identification of five new genes on the Y chromosome of Drosophila melanogaster. Proc Natl Acad Sci USA. 2001;98:13225–13230. doi: 10.1073/pnas.231484998. [DOI] [PMC free article] [PubMed] [Google Scholar]
- 3.Koerich LB, Wang X, Clark AG, Carvalho AB. Low conservation of gene content in the Drosophila Y chromosome. Nature. 2008;456:949–951. doi: 10.1038/nature07463. [DOI] [PMC free article] [PubMed] [Google Scholar]
- 4.Vibranovski MD, Koerich LB, Carvalho AB. Two new Y-linked genes in Drosophila melanogaster. Genetics. 2008;179:2325–2327. doi: 10.1534/genetics.108.086819. [DOI] [PMC free article] [PubMed] [Google Scholar]
- 5.Carvalho AB, Lazzaro BP, Clark AG. Y chromosomal fertility factors kl-2 and kl-3 of Drosophila melanogaster encode dynein heavy chain polypeptides. Proc Natl Acad Sci USA. 2000;97:13239–13244. doi: 10.1073/pnas.230438397. [DOI] [PMC free article] [PubMed] [Google Scholar]
- 6.Bonaccorsi S, Lohe A. Fine mapping of satellite DNA sequences along the Y chromosome of Drosophila melanogaster: Relationships between satellite sequences and fertility factors. Genetics. 1991;129:177–189. doi: 10.1093/genetics/129.1.177. [DOI] [PMC free article] [PubMed] [Google Scholar]
- 7.Bachtrog D. A dynamic view of sex chromosome evolution. Curr Opin Genet Dev. 2006;16:578–585. doi: 10.1016/j.gde.2006.10.007. [DOI] [PubMed] [Google Scholar]
- 8.Bachtrog D, Charlesworth B. Reduced adaptation of a non-recombining neo-Y chromosome. Nature. 2002;416:323–326. doi: 10.1038/416323a. [DOI] [PubMed] [Google Scholar]
- 9.Bachtrog D. The temporal dynamics of processes underlying Y chromosome degeneration. Genetics. 2008;179:1513–1525. doi: 10.1534/genetics.107.084012. [DOI] [PMC free article] [PubMed] [Google Scholar]
- 10.Kaiser VB, Charlesworth B. Muller's ratchet and the degeneration of the Drosophila miranda neo-Y chromosome. Genetics. 2010;185:339–348. doi: 10.1534/genetics.109.112789. [DOI] [PMC free article] [PubMed] [Google Scholar]
- 11.Bachtrog D. Evidence that positive selection drives Y-chromosome degeneration in Drosophila miranda. Nat Genet. 2004;36:518–522. doi: 10.1038/ng1347. [DOI] [PubMed] [Google Scholar]
- 12.Bachtrog D. Sex chromosome evolution: Molecular aspects of Y-chromosome degeneration in Drosophila. Genome Res. 2005;15:1393–1401. doi: 10.1101/gr.3543605. [DOI] [PMC free article] [PubMed] [Google Scholar]
- 13.Engelstädter J. Muller's ratchet and the degeneration of Y chromosomes: A simulation study. Genetics. 2008;180:957–967. doi: 10.1534/genetics.108.092379. [DOI] [PMC free article] [PubMed] [Google Scholar]
- 14.Zurovcova M, Eanes WF. Lack of nucleotide polymorphism in the Y-linked sperm flagellar dynein gene Dhc-Yh3 of Drosophila melanogaster and D. simulans. Genetics. 1999;153:1709–1715. doi: 10.1093/genetics/153.4.1709. [DOI] [PMC free article] [PubMed] [Google Scholar]
- 15.Kopp A, Frank A, Fu J. Historical biogeography of Drosophila simulans based on Y-chromosomal sequences. Mol Phylogenet Evol. 2006;38:355–362. doi: 10.1016/j.ympev.2005.06.006. [DOI] [PubMed] [Google Scholar]
- 16.Kopp A, Frank AK, Barmina O. Interspecific divergence, intrachromosomal recombination, and phylogenetic utility of Y-chromosomal genes in Drosophila. Mol Phylogenet Evol. 2006;38:731–741. doi: 10.1016/j.ympev.2005.10.006. [DOI] [PubMed] [Google Scholar]
- 17.Dobzhansky T. The Y Chromosome of Drosophila pseudoobscura. Genetics. 1935;20:366–376. doi: 10.1093/genetics/20.4.366. [DOI] [PMC free article] [PubMed] [Google Scholar]
- 18.Lyckegaard EM, Clark AG. Ribosomal DNA and Stellate gene copy number variation on the Y chromosome of Drosophila melanogaster. Proc Natl Acad Sci USA. 1989;86:1944–1948. doi: 10.1073/pnas.86.6.1944. [DOI] [PMC free article] [PubMed] [Google Scholar]
- 19.Clark A, Lyckegaard E. Two neutrality test of Y-linked rDNA variation in Drosophila melanogaster. Evolution. 1990;44:2106–2112. doi: 10.1111/j.1558-5646.1990.tb04315.x. [DOI] [PubMed] [Google Scholar]
- 20.Rohmer C, David JR, Moreteau B, Joly D. Heat induced male sterility in Drosophila melanogaster: adaptive genetic variations among geographic populations and role of the Y chromosome. J Exp Biol. 2004;207:2735–2743. doi: 10.1242/jeb.01087. [DOI] [PubMed] [Google Scholar]
- 21.David JR, et al. Male sterility at extreme temperatures: A significant but neglected phenomenon for understanding Drosophila climatic adaptations. J Evol Biol. 2005;18:838–846. doi: 10.1111/j.1420-9101.2005.00914.x. [DOI] [PubMed] [Google Scholar]
- 22.Chippindale AK, Rice WR. Y chromosome polymorphism is a strong determinant of male fitness in Drosophila melanogaster. Proc Natl Acad Sci USA. 2001;98:5677–5682. doi: 10.1073/pnas.101456898. [DOI] [PMC free article] [PubMed] [Google Scholar]
- 23.Clark AG. Variation in Y chromosome segregation in natural populations of Drosophila melanogaster. Genetics. 1987;115:143–151. doi: 10.1093/genetics/115.1.143. [DOI] [PMC free article] [PubMed] [Google Scholar]
- 24.Clark AG. Two tests of Y chromosomal variation in male fertility of Drosophila melanogaster. Genetics. 1990;125:527–534. doi: 10.1093/genetics/125.3.527. [DOI] [PMC free article] [PubMed] [Google Scholar]
- 25.Lemos B, Araripe LO, Hartl DL. Polymorphic Y chromosomes harbor cryptic variation with manifold functional consequences. Science. 2008;319:91–93. doi: 10.1126/science.1148861. [DOI] [PubMed] [Google Scholar]
- 26.Jiang P-P, Hartl DL, Lemos B. Y not a dead end: Epistatic interactions between Y-linked regulatory polymorphisms and genetic background affect global gene expression in Drosophila melanogaster. Genetics. 2010;186:109–118. doi: 10.1534/genetics.110.118109. [DOI] [PMC free article] [PubMed] [Google Scholar]
- 27.Lemos B, Branco AT, Hartl DL. Epigenetic effects of polymorphic Y chromosomes modulate chromatin components, immune response, and sexual conflict. Proc Natl Acad Sci USA. 2010;107:15826–15831. doi: 10.1073/pnas.1010383107. [DOI] [PMC free article] [PubMed] [Google Scholar]
- 28.Paredes S, Branco AT, Hartl DL, Maggert KA, Lemos B. Ribosomal DNA deletions modulate genome-wide gene expression: “rDNA-sensitive” genes and natural variation. PLoS Genet. 2011;7:e1001376. doi: 10.1371/journal.pgen.1001376. [DOI] [PMC free article] [PubMed] [Google Scholar]
- 29.Lohe AR, Roberts PA. An unusual Y chromosome of Drosophila simulans carrying amplified rDNA spacer without rRNA genes. Genetics. 1990;125:399–406. doi: 10.1093/genetics/125.2.399. [DOI] [PMC free article] [PubMed] [Google Scholar]
- 30.Lohe AR, Brutlag DL. Identical satellite DNA sequences in sibling species of Drosophila. J Mol Biol. 1987;194:161–170. doi: 10.1016/0022-2836(87)90365-2. [DOI] [PubMed] [Google Scholar]
- 31.Lohe AR, Roberts PA. Evolution of DNA in heterochromatin: The Drosophila melanogaster sibling species subgroup as a resource. Genetica. 2000;109:125–130. doi: 10.1023/a:1026588217432. [DOI] [PubMed] [Google Scholar]
- 32.Zeng LW, Singh RS. The genetic basis of Haldane's rule and the nature of asymmetric hybrid male sterility among Drosophila simulans, Drosophila mauritiana and Drosophila sechellia. Genetics. 1993;134:251–260. doi: 10.1093/genetics/134.1.251. [DOI] [PMC free article] [PubMed] [Google Scholar]
- 33.Johnson NA, Hollocher H, Noonburg E, Wu CI. The effects of interspecific Y chromosome replacements on hybrid sterility within the Drosophila simulans clade. Genetics. 1993;135:443–453. doi: 10.1093/genetics/135.2.443. [DOI] [PMC free article] [PubMed] [Google Scholar]
- 34.Joly D, Bazin C, Zeng LW, Singh RS. Genetic basis of sperm and testis length differences and epistatic effect on hybrid inviability and sperm motility between Drosophila simulans and D. sechellia. Heredity. 1997;78:354–362. doi: 10.1038/hdy.1997.58. [DOI] [PubMed] [Google Scholar]
- 35.Legrand D, et al. Species-wide genetic variation and demographic history of Drosophila sechellia, a species lacking population structure. Genetics. 2009;182:1197–1206. doi: 10.1534/genetics.108.092080. [DOI] [PMC free article] [PubMed] [Google Scholar]
- 36.Zhang Y, Sturgill D, Parisi M, Kumar S, Oliver B. Constraint and turnover in sex-biased gene expression in the genus Drosophila. Nature. 2007;450:233–237. doi: 10.1038/nature06323. [DOI] [PMC free article] [PubMed] [Google Scholar]
- 37.Chintapalli VR, Wang J, Dow JAT. Using FlyAtlas to identify better Drosophila melanogaster models of human disease. Nat Genet. 2007;39:715–720. doi: 10.1038/ng2049. [DOI] [PubMed] [Google Scholar]
- 38.Wasbrough ER, et al. The Drosophila melanogaster sperm proteome-II (DmSP-II) J Proteomics. 2010;73:2171–2185. doi: 10.1016/j.jprot.2010.09.002. [DOI] [PubMed] [Google Scholar]
- 39.Connallon T, Clark AG. Association between sex-biased gene expression and mutations with sex-specific phenotypic consequences in Drosophila. Genome Biol Evol. 2011;3:151–155. doi: 10.1093/gbe/evr004. [DOI] [PMC free article] [PubMed] [Google Scholar]
- 40.Vibranovski MD, Lopes HF, Karr TL, Long M. Stage-specific expression profiling of Drosophila spermatogenesis suggests that meiotic sex chromosome inactivation drives genomic relocation of testis-expressed genes. PLoS Genet. 2009;5:e1000731. doi: 10.1371/journal.pgen.1000731. [DOI] [PMC free article] [PubMed] [Google Scholar]
- 41.Kuhn R, et al. A cluster of four genes selectively expressed in the male germ line of Drosophila melanogaster. Mech Dev. 1991;35:143–151. doi: 10.1016/0925-4773(91)90064-d. [DOI] [PubMed] [Google Scholar]
- 42.White-Cooper H. Molecular mechanisms of gene regulation during Drosophila spermatogenesis. Reproduction. 2010;139:11–21. doi: 10.1530/REP-09-0083. [DOI] [PubMed] [Google Scholar]
- 43.Dorus S, Wilkin EC, Karr TL. Expansion and functional diversification of a leucyl aminopeptidase family that encodes the major protein constituents of Drosophila sperm. BMC Genomics. 2011;12:177. doi: 10.1186/1471-2164-12-177. [DOI] [PMC free article] [PubMed] [Google Scholar]
- 44.Schäfer M, Börsch D, Hülster A, Schäfer U. Expression of a gene duplication encoding conserved sperm tail proteins is translationally regulated in Drosophila melanogaster. Mol Cell Biol. 1993;13:1708–1718. doi: 10.1128/mcb.13.3.1708. [DOI] [PMC free article] [PubMed] [Google Scholar]
- 45.Moehring AJ, Teeter KC, Noor MAF. Genome-wide patterns of expression in Drosophila pure species and hybrid males. II. Examination of multiple-species hybridizations, platforms, and life cycle stages. Mol Biol Evol. 2007;24:137–145. doi: 10.1093/molbev/msl142. [DOI] [PubMed] [Google Scholar]
- 46.Good JM, Giger T, Dean MD, Nachman MW. Widespread over-expression of the X chromosome in sterile F1hybrid mice. PLoS Genet. 2010;6:e1001148. doi: 10.1371/journal.pgen.1001148. [DOI] [PMC free article] [PubMed] [Google Scholar]
- 47.Dimitri P, Pisano C. Position effect variegation in Drosophila melanogaster: Relationship between suppression effect and the amount of Y chromosome. Genetics. 1989;122:793–800. doi: 10.1093/genetics/122.4.793. [DOI] [PMC free article] [PubMed] [Google Scholar]
- 48.Ranz JM, Namgyal K, Gibson G, Hartl DL. Anomalies in the expression profile of interspecific hybrids of Drosophila melanogaster and Drosophila simulans. Genome Res. 2004;14:373–379. doi: 10.1101/gr.2019804. [DOI] [PMC free article] [PubMed] [Google Scholar]
- 49.Ortíz-Barrientos D, Counterman BA, Noor MAF. Gene expression divergence and the origin of hybrid dysfunctions. Genetica. 2007;129:71–81. doi: 10.1007/s10709-006-0034-1. [DOI] [PubMed] [Google Scholar]
- 50.Rathke C, et al. Distinct functions of Mst77F and protamines in nuclear shaping and chromatin condensation during Drosophila spermiogenesis. Eur J Cell Biol. 2010;89:326–338. doi: 10.1016/j.ejcb.2009.09.001. [DOI] [PubMed] [Google Scholar]
- 51.Rathke C, et al. Transition from a nucleosome-based to a protamine-based chromatin configuration during spermiogenesis in Drosophila. J Cell Sci. 2007;120:1689–1700. doi: 10.1242/jcs.004663. [DOI] [PubMed] [Google Scholar]
- 52.Presgraves DC. The molecular evolutionary basis of species formation. Nat Rev Genet. 2010;11:175–180. doi: 10.1038/nrg2718. [DOI] [PubMed] [Google Scholar]
- 53.Kulathinal R, Singh R. Cytological characterization of premeiotic versus postmeiotic defects producing hybrid male sterility among sibling species of the Drosophila melanogaster complex. Evolution. 1998;52:1067–1079. doi: 10.1111/j.1558-5646.1998.tb01834.x. [DOI] [PubMed] [Google Scholar]
- 54.Michalak P, Noor MAF. Association of misexpression with sterility in hybrids of Drosophila simulans and D. mauritiana. J Mol Evol. 2004;59:277–282. doi: 10.1007/s00239-004-2622-y. [DOI] [PubMed] [Google Scholar]
- 55.Michalak P, Noor MAF. Genome-wide patterns of expression in Drosophila pure species and hybrid males. Mol Biol Evol. 2003;20:1070–1076. doi: 10.1093/molbev/msg119. [DOI] [PubMed] [Google Scholar]
- 56.Catron DJ, Noor MAF. Gene expression disruptions of organism versus organ in Drosophila species hybrids. PLoS ONE. 2008;3:e3009. doi: 10.1371/journal.pone.0003009. [DOI] [PMC free article] [PubMed] [Google Scholar]
- 57.Haerty W, Singh RS. Gene regulation divergence is a major contributor to the evolution of Dobzhansky-Muller incompatibilities between species of Drosophila. Mol Biol Evol. 2006;23:1707–1714. doi: 10.1093/molbev/msl033. [DOI] [PubMed] [Google Scholar]
- 58.Johnson NA. Hybrid incompatibility genes: Remnants of a genomic battlefield? Trends Genet. 2010;26:317–325. doi: 10.1016/j.tig.2010.04.005. [DOI] [PubMed] [Google Scholar]
- 59.Ferree PM, Barbash DA. Species-specific heterochromatin prevents mitotic chromosome segregation to cause hybrid lethality in Drosophila. PLoS Biol. 2009;7:e1000234. doi: 10.1371/journal.pbio.1000234. [DOI] [PMC free article] [PubMed] [Google Scholar]
- 60.Brideau NJ, et al. Two Dobzhansky-Muller genes interact to cause hybrid lethality in Drosophila. Science. 2006;314:1292–1295. doi: 10.1126/science.1133953. [DOI] [PubMed] [Google Scholar]
- 61.Ting C-T, Tsaur S-C, Wu M-L, Wu C-I. A rapidly evolving homeobox at the site of a hybrid sterility gene. Science. 1998;282:1501–1504. doi: 10.1126/science.282.5393.1501. [DOI] [PubMed] [Google Scholar]
- 62.Bayes JJ, Malik HS. Altered heterochromatin binding by a hybrid sterility protein in Drosophila sibling species. Science. 2009;326:1538–1541. doi: 10.1126/science.1181756. [DOI] [PMC free article] [PubMed] [Google Scholar]
- 63.Pool JE, Aquadro CF. History and structure of sub-Saharan populations of Drosophila melanogaster. Genetics. 2006;174:915–929. doi: 10.1534/genetics.106.058693. [DOI] [PMC free article] [PubMed] [Google Scholar]
- 64.Johnson NA, Perez DE, Cabot EL, Hollocher H, Wu CI. A test of reciprocal X-Y interactions as a cause of hybrid sterility in Drosophila. Nature. 1992;358:751–753. doi: 10.1038/358751a0. [DOI] [PubMed] [Google Scholar]
- 65.Smyth GK. Bioinformatics and Computational Biology Solutions Using R and Bioconductor. NY: Springer; 2005. pp. 397–420. [Google Scholar]
- 66.Ritchie ME, et al. A comparison of background correction methods for two-colour microarrays. Bioinformatics. 2007;23:2700–2707. doi: 10.1093/bioinformatics/btm412. [DOI] [PubMed] [Google Scholar]
- 67.Smyth GK, Speed TP. Normalization of cDNA microarray data. Methods. 2003;31:265–273. doi: 10.1016/s1046-2023(03)00155-5. [DOI] [PubMed] [Google Scholar]
- 68.Ritchie ME, et al. Empirical array quality weights in the analysis of microarray data. BMC Bioinformatics. 2006;7:261. doi: 10.1186/1471-2105-7-261. [DOI] [PMC free article] [PubMed] [Google Scholar]
- 69.Smyth GK. Linear models and empirical bayes methods for assessing differential expression in microarray experiments. Stat Appl Genet Mol Biol. 2004;3:e3. doi: 10.2202/1544-6115.1027. [DOI] [PubMed] [Google Scholar]
- 70.Benjamini Y, Hochberg Y. Controlling the false discovery rate: A practical and powerful approach to multiple testing. J R Stat Soc, B. 1995;57:289–300. [Google Scholar]
- 71.Yanai I, et al. Genome-wide midrange transcription profiles reveal expression level relationships in human tissue specification. Bioinformatics. 2005;21:650–659. doi: 10.1093/bioinformatics/bti042. [DOI] [PubMed] [Google Scholar]
Associated Data
This section collects any data citations, data availability statements, or supplementary materials included in this article.