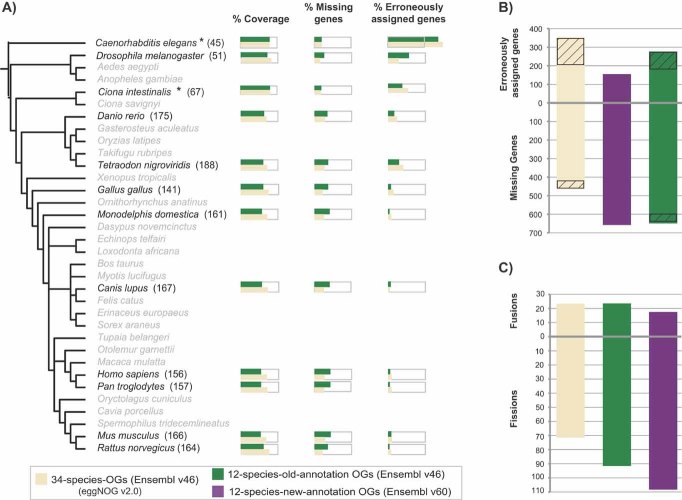
Figure 4.
The impact of species coverage and genome annotation. A: Comparison of the performance of 34-species and 12-species OGs using RefOGs. We measure the percentage of orthologs recovered (coverage), missing genes and erroneously assigned genes for each reference species for those datasets [yellow bar: publicly available OGs in eggNOG (same measurements as Fig. 2) and green bar: customized OGs of the 12 selected species using same genome annotations as the public eggNOG]. The reference species are highlighted by black letters, while the unconsidered species that complete the set of 34 eggNOG species are written in gray letters. Numbers in parentheses show the total number of orthologs per species in the benchmarking set. The gray boxes enclosing the colored bars correspond to 100% coverage. Notice that the coverage is always higher for the 34-species OGs compared to the 12-species OGs except in the cases of C. elegans and Ciona (marked by asterisk), which are separated by long branches in both datasets. B: Comparison of the public eggNOG (yellow bar), 12-species-old-annotation OGs (green bar) and 12-species-new-annotation OGs (purple bar) at the gene level. Hatched boxes label the fraction of mispredicted genes of 34-species- and 12-species-old-annotation datasets that do not exist in Ensembl v60 genome annotations, indicating the high number of errors due to old genome annotations. C: Comparison of public eggNOG (yellow bar), 12-species-old-annotation OGs (green bar) and 12-species-new-annotation OGs (purple bar) at the group level. Notice that the 12-species datasets (either with old or new annotation) always introduce a larger number of fission events than the 34-species OGs, highlighting again the importance of species coverage.

