

Abstract
Conventional tools for measuring dietary exposure have well recognized limitations. Measurement of food-derived metabolites in biofluids provides an alternative approach and our aim was to develop an experimental protocol which ensures that extraneous variability does not obscure metabolic signals from ingested foods. Healthy adults consumed a standardized meal in the evening before each test day and collected pooled overnight urine. On each test day of three different studies, urine was collected in the fasted state and at different time points after consumption of a standardized breakfast. Metabolite fingerprinting of samples using Flow Infusion Electrospray-Ionization Mass Spectrometry followed by multivariate data analysis showed strong discrimination between overnight, fasting and postprandial samples, in each study separately and when data from the three studies were pooled. Such differences were robust and highly reproducible within individuals on separate occasions. Urine volume was an efficient data normalization factor for metabolite fingerprinting data. Postprandial urines had a stable chemical composition over a period of 2–4 h after eating a standardized breakfast, suggesting that there is a flexible time window for urine collection. Fasting urine samples provided a stable baseline for universal comparisons with postprandial samples. A dietary exposure biomarker discovery protocol was validated by demonstrating that top-ranked signals discriminating between fasting and 2–4 h postprandial urine samples could be linked to metabolites abundant in some components of the standardized breakfast. We conclude that the protocol developed will have value in the search for biomarker leads of dietary exposure.
Electronic supplementary material
The online version of this article (doi:10.1007/s11306-011-0289-0) contains supplementary material, which is available to authorized users.
Keywords: Dietary exposure, Metabolomics, Fasting metabolite profile, Postprandial metabolite profile, Test meal paradigm, Multivariate data analysis
Introduction
Conventional tools for measuring dietary exposure, which is an essential component of much health-related research, are difficult to validate, are subject to participant bias and depend upon food composition tables for estimation of intakes of energy, nutrients and other food constituents (Bingham 2002). Since foods contain thousands of metabolites and give rise to further metabolites following food ingestion, digestion, absorption and metabolism, the metabolites in body fluids are a potentially rich source of information about dietary exposure (Penn et al. 2010). It has been proposed recently that metabolomics methodology, which allows the comprehensive analysis of the small molecule composition of accessible human biofluids (Bollard et al. 2005; Walsh et al. 2006; Maher et al. 2007; Holmes et al. 2008; Favé et al. 2009; Llorach et al. 2009; Scalbert et al. 2009) may provide more objective information in attempts to evaluate recent or habitual dietary intake (Holmes et al. 2008; Favé et al. 2009; Scalbert et al. 2009; Penn et al. 2010). Particularly, methods utilizing mass spectrometry (Major et al. 2006; Beckmann et al. 2008) are now relatively routine and certain techniques are becoming high throughput, with potential for automation in the future (Beckmann et al. 2008).
The development of metabolomics approaches for dietary assessment in humans faces a major issue i.e., the substantial inter- and intra-individual variability in human metabolite profiles (Assfalg et al. 2008). Several factors contribute to intra-individual variability including diurnal changes (Walsh et al. 2006), hormonal status (Bollard et al. 2005) and stage in the menstrual cycle for women of reproductive age (Wallace et al. 2010). Inter-individual variability may result from easily recorded factors such as gender, age and adiposity (Kochhar et al. 2006; Gu et al. 2009; Winnike et al. 2009; Rasmussen et al. 2011) or from less well-characterized habitual dietary patterns and other environmental and cultural influences (Lenz et al. 2003; Holmes et al. 2008). Less obvious sources of variance, which relate to individual behaviors and which are more challenging to detect, include the timing of last meal in relation to biofluid collection, the volume of fluid intake (deRooij et al. 1996; Schneider et al. 2003; Mullen et al. 2004), inflammatory status (Chen et al. 2008) and unreported non-compliance with study protocols in terms of use of medication, alcohol consumption or fasting requirements. These difficulties highlight the need for the development of robust experimental protocols to minimize their potential confounding effects if metabolomics approaches for assessing dietary exposure are to realize their promise (Walsh et al. 2006; Kussmann et al. 2008; Rasmussen et al. 2011).
To address this issue, there is a need for systematic investigation of experimental protocols for volunteer characterization and handling and for biofluid collection and processing in nutritional metabolomics studies. Some potential confounding factors such as peri-intervention food intakes can be controlled, and this has proven useful in studies of the urinary metabolome (Walsh et al. 2006; Winnike et al. 2009). However there are no standardized protocols for such studies and different investigators have adopted very different strategies, ranging from the collection of information on food intakes (Wang et al. 2005; Walsh et al. 2007; van Velzen et al. 2009) and the specification of a list of allowed/forbidden foods (Walsh et al. 2007; van Velzen et al. 2009) to the use of fully controlled meal provisions (Stella et al. 2006; Rezzi et al. 2007) and the use of deionized water in metabolic suites (Stella et al. 2006). Although protocols for blood collection (particularly fasting bloods) and processing to produce plasma and serum components are reasonably well standardized, there is no consensus on protocols for urine sample collection in human metabolomics studies. Investigators have collected spot urine samples, including the first void in the morning (Walsh et al. 2007), a random sample late in the morning (Wang et al. 2005), or several spontaneous samples at various times up to 48 h after treatment (van Velzen et al. 2009). Other investigators have collected 24 h urine samples on each day of a clinical trial (Rezzi et al. 2007) or on three occasions after each treatment period (Stella et al. 2006). Thus, there is a need to establish standardized sampling protocols which will help ensure that nutritional metabolomics data are robust and to facilitate comparison of results between studies.
The objective of this study, which constitutes the first phases of the MEtabolomics to characterize Dietary Exposure (MEDE) Study (Favé et al. 2009), was to develop a standardized protocol for nutritional metabolomics investigations which would minimize confounding factors including inter- and intra-individual variability and to assess its suitability for monitoring metabolic changes in response to dietary exposure. It was expected that the provision of a standardized evening meal low in plant polyphenols on the previous day would stabilize the urine metabolome and aid discovery of metabolite signals characteristic of the specific foods ingested, as described in previous reports (Walsh et al. 2006; Llorach et al. 2009; Winnike et al. 2009; Llorach-Asuncion et al. 2010). High throughput metabolomic fingerprinting (Beckmann et al. 2008) based on Flow Infusion Electrospray Ionization-Mass Spectrometry (FIE-MS) was used to evaluate the reproducibility of urine composition in three groups of volunteers exposed to a standardized acute dietary intervention. We were particularly concerned to determine whether urine collected in a specific behavioral period could be used as a ‘standardized baseline’ comparator against which chemical changes associated with specific dietary intake could be assessed. Thus, a practical aspect of this study was to determine an appropriate timing of sampling to optimize the information content and modeling characteristics of spot urine metabolite fingerprints. Key to protocol validation was confirmation that data mining identified metabolite signals associated with specific components of the standard breakfast.
Subjects and methods
Ethical approval and subject recruitment
This project was approved by the Newcastle and North Tyneside 2 Research Ethics Committee (reference number 07/H0907/136) and registered with the Newcastle upon Tyne Hospitals NHS Foundation Trust, UK (registration number 4392). The volunteers were recruited through word of mouth and by advertisement in Newcastle University. They were assessed for suitability via a screening questionnaire which included the following exclusion criteria: aged under 18 years old, for women being pre-menopausal, having a Body Mass Index (BMI) <18.5 or >30 kg/m2, being a smoker, non milk drinker and/or non fish eater, having a history of substance abuse or alcoholism (alcohol consumption higher than 30 units/week), being allergic to any test food, suffering from any significant health problem and/or planning to change dietary or physical activity habits. The volunteers were recruited at an induction visit to the Clinical Research Facility (CRF) (Royal Victoria Infirmary, Newcastle upon Tyne, UK), where they gave written consent to participate, after a detailed explanation of the study protocol.
Study design
The study was designed to help stabilize ‘background’ metabolite profiles of volunteers subjected subsequently to a nutritional intervention study (Fig. 1). Volunteers attended either one (Study 1; 12 participants) or two identical experimental days (Study 2 [12 participants] and Study 3 [24 participants]), which were held several weeks apart. On the day before a test day, volunteers were asked to minimize physical activity and to avoid alcohol consumption. They were provided with a standardized evening meal to consume between 18:00 and 20:00. This evening meal was designed to be acceptable to a wide range of volunteers, as ‘metabolomically’ neutral as possible (i.e., relatively low in fruits, vegetables and wholegrain foods to minimize confounding with later dietary interventions) and easy to replicate on many occasions over a 2 years study period. We supplied a ready-prepared meal (450 g) consisting of a chicken breast with carrots, peas and chunks of roasted potatoes in an onion gravy, one 75 g chocolate éclair and one 0.5 l bottle of still mineral water to be consumed entirely with the meal. Volunteers were provided with a second bottle of still mineral water (0.5 l) to be consumed ad lib until arrival at the CRF on the morning of the study day, and water intake was recorded. Volunteers voided urine before consumption of the standardized evening meal and they collected all urine produced from then until arrival in the CRF the following morning. On each study day, volunteers came to the CRF after a 12 h (minimum) overnight fast. After measurement of anthropometric variables, fasting urine and blood samples were collected. Volunteers received a standardized breakfast and further urine samples were collected after 3 h (Study 1), 2, 4, 6 and 8 h (Study 2) and 1.5, 3 and 4.5 h (Study 3). The standard breakfast consisted of 200 ml orange juice, 190 ml tea with 14 ml of skimmed milk and 12 g of sugar, a 35 g butter croissant and 25 g corn flakes with 125 g of semi skimmed milk (1.7% fat). Study 2 volunteers received a standardized light lunch 4 h after the breakfast which provided a second meal challenge. This light lunch consisted of two poached free range eggs (2 × ~50 g), two slices of pre-packed sliced white bread (2 × 36 g) and one 500 ml bottle of still mineral water. Urine samples were frozen immediately at −20°C and moved to −80°C within 24 h. Full details of the light lunch items are presented in electronic supplementary material (Data S-1).
Fig. 1.
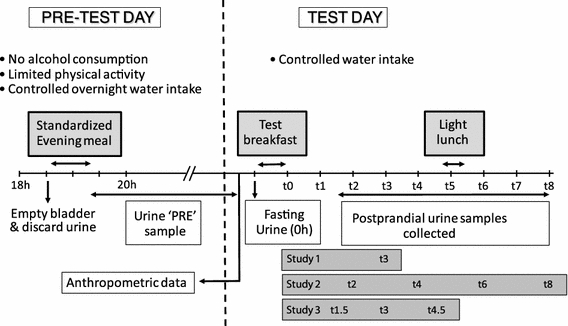
Schematic representation of the design of the MEDE Studies. On pre-test day, volunteers were specified to empty their bladder and discard their urine before consuming their standardized evening meal between 18 and 20 h, then to collect and pool all urine produced after consumption of the evening meal, up to and including the morning void before attending the Clinical Research Facility (‘PRE’ sample). On test day morning, anthropometric data were recorded, the fasting urine samples (0 h) were collected, then the standardized breakfast was served, and the fed biofluids samples were collected 3 h (Study 1) or 2, 4, 6 and 8 h (Study 2) or after 1.5, 3, and 4.5 h (Study 3) after the volunteers had finished their meal (assigned as t1.5–t8 for postprandial samples in the figure)
Urine collection
A number of carefully characterized urine samples were collected from each volunteer. The first sample, identified as the ‘PRE’ sample, was a pool of all urine produced after consumption of the evening meal and up to, and including, the morning void before attending the CRF. Volunteers were provided with a plastic 500 ml jug and plastic bottle into which to decant urine which was kept at room temperature and without any preservative until brought to the CRF. Further collections of urine were made in the CRF in (1) the fasting state i.e., before consumption of the standardized breakfast and (2) at pre-defined intervals after the standardized breakfast. All urine samples were processed according to the same protocol: the urine volume was measured and sub-samples were decanted into several pre-labeled 1.5 ml Micro tubes and pre-labeled 40 ml Falcon® tubes. These sub-samples were frozen immediately at −20°C before being moved to −80°C storage within 24 h. Full details of all laboratory consumables, which were purchased in batches, are presented in electronic supplementary material (Data S-2).
Collection and statistical analysis of metadata
Metadata were collected to characterize the volunteers and as aids to interpretation of inter- and intra-individual differences in metabolomic profiles. These metadata were organized into 4 categories (Tables S-1 to S-4 in electronic supplementary material): (1) anthropometry, (2) nutritional and inflammatory status, (3) lifestyle, and (4) eating/drinking/urination behaviors and measured as follows:
Anthropometric characteristics (measured by a single investigator) included height (using a telescopic measuring rod (SECA, Birmingham, UK)), body mass and body fat content (bio-impedance weighting scale (TANITA, Middlesex, UK)), waist and hips circumferences (measuring tape with automatic roll-up (SECA, Birmingham, UK)) and blood pressure (ambulatory oscillometric device (Welch Allyn, Buckinghamshire, UK)).
Fasting and postprandial plasma samples were analyzed for glucose concentration. Fasting plasma samples were analyzed for selenium concentration, fasting serum samples for lipids (triglycerides, total, HDL, LDL, and non-HDL cholesterol, and total/HDL cholesterol ratio), high sensitivity C-reactive protein (hsCRP), insulin and vitamin B12 concentrations, and fasting red cells for folate concentration.
Habitual diet was characterized using the validated Food Frequency Questionnaire (FFQ) employed by the EPIC Study (Bingham et al. 1997) which was modified slightly to include a few additional foods consumed frequently in the North East of England. Habitual physical activity was characterized using a Physical Activity Questionnaire (PAQ) adapted from that of Wareham et al. (2003) and measured using an ActiGraph™ accelerometer device with an ActiGraph Interface Unit and the ActiSoft software. Accelerometers were worn for the 5 days prior to each study day.
Volunteers were provided with a form to report starting and finishing times for their evening meal, as well as the times of urine collection. Overnight water consumption was recorded, and overnight, fasting and postprandial urine samples were analyzed for creatinine, sodium and potassium concentrations.
Statistical analysis of metadata was performed using the SPSS Software to calculate averages and SEM, to check the data distribution (Shapiro–Wilk test), and to investigate potential differences between the two studies (Study 1 and Study 2) and gender effects (t-test for normally distributed data, and Mann–Whitney test for non-normally distributed data). The coefficients of variation (CV) were also calculated for both studies together.
Acquisition of mass spectrometry data
Although metabolite fingerprinting using a high accurate mass Fourier-Transform Ion Cyclotron Resonance Mass-Spectroscopy (FT-ICR-MS) instrument offers a direct opportunity for m/z annotation (Southam et al. 2007), it is considerably less sensitive than nominal mass fingerprinting on a linear ion trap and, as a result, after time consuming and complex data pre-processing, signal intensity can be at baseline in almost half of the mass bins in FT-ICR-MS data. In contrast the continuous data stream in FIE-MS (Beckmann et al. 2008) avoids any in-filling of zeros which occurs automatically in FT-ICR-MS during raw data acquisition. From a practical perspective, the minimal data pre-processing requirement, much lower cost and overall speed of nominal mass fingerprinting on an ion trap provides an excellent first pass tool for data acquisition that is particularly suited to large samples sets (>100). After data modeling and feature selection, any potentially explanatory nominal mass bins could then be investigated further by targeted analysis using an ultra high mass accuracy LC-FT-ICR-MS instrument.
FIE-MS metabolite fingerprinting
FIE-MS was carried out as described previously (Beckmann et al. 2008) with modifications to accommodate urine and blood samples. Samples from Studies 1, 2 and 3 were analyzed independently several months apart, taking care to randomize at all stages. Aliquots of thawed urine (50 μl) were diluted in 450 μl of pre-chilled methanol/water [3.5/1]. Aliquots of thawed plasma (200 μl) were diluted in 1,520 μl of pre-chilled methanol/chloroform [4/1] and remained in a single phase. Samples were vortexed, shaken for 15 min at 4°C and then centrifuged for 5 min at 14,000×g. For FIE-MS analysis, supernatant (60 μl) was transferred to HPLC crimp cap glass vials containing a 200 μl micro glass insert. The vial caps were crimped and then stored at 4°C for same day analysis. Vials were randomized before injection using an autosampler (tray temperature: 15°C). The diluted samples (20 μl) were injected into a flow of 60 μl/min water–methanol (70:30 v/v) using a Surveyor liquid chromatography system (Thermo Scientific, Waltham, MA, USA). For each sample, data were acquired in alternating positive and negative ionization profile modes and over four scan ranges (15–110 m/z; 100–220 m/z; 210–510 m/z; 500–1,200 m/z) on a LTQ linear ion trap (Thermo Electron Corporation, San Jose, CA, US), with an acquisition time of 5 min in a single data acquisition experiment. Raw infusion profiles were exported and mass spectra of all analytical runs per sample were combined in a single intensity matrix (over all four scan ranges, unless stated otherwise) for each ionization mode. The resulting mass spectrum for each analysis was calculated as the mean of 20 scans about the apex of the infusion profile. Raw data dimensionality was reduced by electronically extracting signals with ±0.1 Da mass accuracy but data are expressed only as nearest integer to identify target nominal mass bins for accurate mass analysis by FT-ICR-MS. Data were Log10 transformed and normalized to total ion count (TIC) before analysis (Beckmann et al. 2008), or normalized using volunteer metadata as stated in the text.
Analysis of nominal mass bins by FT-ICR-MS and signal annotation
Selected variables revealed by FIE-MS data mining were investigated further using targeted Nano-Flow (TriVersa NanoMate, Advion BioSciences Ltd, UK) LTQ-FT-ICR-MS Ultra (where Ultra referred to a high-sensitivity ICR-cell). For each sample class, three pools of urine samples from randomized groups of volunteers were prepared as used for FIE-MS and reconstituted in methanol/water (80/20, v/v). For each spray on the TriVersa Nanomate, a sample volume of 13.0 μl was used and 2 μl of air was aspirated after the sample. The gas pressure was maintained between 0.2 and 0.6 psi, with the voltage at 1.4–1.7 kV (generally higher for negative ionization mode) to achieve currents at 80–120 nA and −100 to −60 nA in positive and negative ionization mode, respectively. Operating the FT-ICR-MS in narrow mode, a resolution of 100,000 was chosen and the mass range was scanned for 1 min. A minimum of three biological replicates per class or treatment containing the specific selected mass were required for successful accurate mass verification. The system was calibrated routinely with LTQ FT calibration solution prepared according to the instrument instructions.
For metabolite signal identification, the accurate mass values were then queried against MZedDB, an interactive accurate mass annotation tool we have developed recently, which can be used directly to tentatively annotate signals by means of neutral loss and/or adduct formation rules (Draper et al. 2009).
For further metabolite signal identification FIE-MSn was employed. For FIE-MSn analysis, the scan window was set for 20 scans, with an isolation width of 1 m/z and normalized collision energy of 40 V. The activation coefficient ‘Q’ of 0.250 was chosen and an activation time of 30 ms, with wideband activation turned on and source fragmentation of 20 V. Mass range settings were dependent upon molecular weight of the target ion. Chemical standards were obtained commercially at highest purity and solvents were of HPLC–MS grade. Standards were prepared by dissolving 1 mg of the metabolite standard in 1 ml of extraction solvent or in methanol/water (80/20, v/v) if necessary.
Statistical analysis of FIE-MS data
Clustering and classification methods
All data mining was carried out using the FIEmspro workflow validated previously in Aberystwyth (Enot et al. 2008) and accessible at URL http://users.aber.ac.uk/jhd/. Principal Components Analysis (PCA) was employed to examine data clustering without any pre-definition of sample class membership and was used to reduce the dimensionality with minimal information loss. Linear Discriminant Analysis (LDA)—a supervised method which uses sample class label information—was used to find the linear combination of variables for best separating two or more classes of metabolite fingerprints. Following LDA, plots of the first two Discriminant Functions (DFs) were used to visualize the goodness of class separation. The LDA Eigenvalue (Tw), defined as the ratio of the between- and within-group standard deviations on the discriminant variables, was used to evaluate the performance of LDA. The larger the Eigenvalue, the greater the discriminatory power of the model. Discrimination was considered poor for Eigenvalues <1, weak for Eigenvalues between 1 and 2, and good for Eigenvalues >2 (Enot et al. 2008). Two additional classification algorithms, Random Forest (RF) and Support Vector Machine (SVM), were also employed in the present study. The four mass ranges (i.e., 15–110 m/z; 100–220 m/z; 210–510 m/z; 500–1,200 m/z) were initially modeled independently and in all combinations. Preliminary data analysis experiments revealed that inclusion of masses >m/z 510 reduced classification accuracy and contributed little to modeling power when several diverse classes of urine samples were analyzed. Preliminary sample classification was thus based on the mass range m/z 15–510 in a merged data matrix which omitted the highest mass range. Unless stated otherwise, feature selection was based on the analysis of fingerprint data representing the full mass range (m/z 15–1,200).
Assessment of classification robustness
Several performance assessments for classification (Enot et al. 2008) of metabolite fingerprints were used in the present study including (1) classification accuracy rate (ACC), defined as the proportion of correctly classified data points among all data points where accuracy values range from 0 to 1 (1 equates to perfect classification), (2) the area under the Receiver Operating Characteristic (ROC) curve (AUC) which aggregates performance across the entire range of trade-offs between true positive rate and false positive rate and ranges from 0.5 (indicating random performance) to 1.0 (denoting perfect classification) and (3) classification margin which is defined as the proportion of votes for the correct class minus the maximum proportion of votes for the other classes—the larger the margin, the more confidence in the classification. Average margin values larger than 0.3 indicate adequate classification in metabolomics experiments (Enot et al. 2008).
Feature selection
Feature selection techniques were applied to mass spectrometry data to select the mass signals which were responsible for discriminating between different sample classes. Three methods viz. RF Importance Scores, AUC and the Welch’s t-test, were used in feature selection (Enot et al. 2008). Randomized re-sampling strategies including bootstrapping and cross-validation methods were applied in the process of classification and feature selection to counteract the effect of any unknown, structured variance in the data. In the following data analysis, 100 bootstraps were used for all classification and feature selection.
Results and discussion
Impact of inter-individual variability on modeling characteristics of urine FIE-MS fingerprint data
To develop standardized study protocols, we used three studies of healthy adult volunteers with samples collected and analyzed in batches over a 2 years period. In Studies 2 and 3, each volunteer was studied on two occasions at least a week apart. This experimental design provided an opportunity to assess the reproducibility of protocols and likely generalizability of results. Throughout the entire project, non-targeted metabolite fingerprinting by FIE-MS provided a robust, high throughput metabolomics approach to compare compositional differences in urine samples using powerful multivariate data classification methods. Initial experiments aimed to examine the influence of various anthropometric factors, nutritional and inflammation status, lifestyle and behavioral attributes on the robustness of metabolomics data modeling. The means and coefficients of variation (CVs) for all volunteer characteristics are presented in Tables S-1 to S-4 (in electronic supplementary material). Urine samples (fasting, overnight and post-prandial) from three different volunteer studies were used to generate FIE-MS fingerprints, in both negative and positive ionization mode. The impact on metabolome profile of inter-individual variability in volunteer characteristics was investigated by PC-LDA on data representing urine samples, using for class labeling individual, gender, age and a range of other metadata factors (Table 1). To do so, data were classified in at least two groups for each factor. For some factors, groups were obvious: each volunteer for ‘individual’, male and female for ‘gender’, or normal weight (BMI < 25) and overweight (BMI > 25) for ‘BMI’. For others involving volumes or concentration measures, we chose ranges to define the groups. Table 1 summarizes Eigenvalues for up to the top three DFs associated in each PC-LDA model. The strongest discriminating factors proved to be the timing of urine collection in relation to meal consumption, individual and urine volume, in both ionization modes.
Table 1.
Influence of experimental factors on robustness of data modeling after PC-LDA of urine samples
| Class labeling | Positive mode | Negative mode | ||||
|---|---|---|---|---|---|---|
| (Tw values) | (Tw values) | |||||
| DF1 | DF2 | DF3 | DF1 | DF2 | DF3 | |
| Time point | 4.61 | 0.60 | N/A | 3.95 | 0.92 | N/A |
| Individual | 3.32 | 2.94 | 2.30 | 10.38 | 7.74 | 5.85 |
| Urine volume | 2.50 | 0.59 | 0.36 | 3.52 | 0.76 | 0.43 |
| Creatinine | 3.12 | 0.84 | 0.40 | 3.98 | 0.72 | 0.46 |
| Potassium | 1.44 | 0.63 | N/A | 1.29 | 0.55 | N/A |
| Evening meal duration time | 0.58 | 0.39 | N/A | 0.73 | 0.58 | N/A |
| Gender | 1.22 | N/A | N/A | 2.21 | N/A | N/A |
| HDL cholesterol | 0.75 | N/A | N/A | 1.06 | N/A | N/A |
| Sodium | 1.54 | 0.45 | N/A | 1.49 | 0.63 | N/A |
| Body fat content | 1.10 | 0.69 | 0.51 | 1.40 | 1.03 | 0.67 |
| CRP | 1.03 | 0.73 | 0.48 | 1.35 | 1.11 | 0.69 |
| Age | 1.60 | 0.86 | N/A | 4.88 | 1.83 | N/A |
| Habitual physical activity | 1.18 | 0.99 | 0.65 | 1.73 | 1.49 | 1.10 |
| Pre-test day physical activity | 1.14 | 0.84 | N/A | 3.05 | 2.06 | N/A |
| Habitual alcohol intake | 1.64 | 0.58 | N/A | 2.28 | 1.23 | N/A |
| BMI | 0.60 | N/A | N/A | 1.38 | N/A | N/A |
| Water intake | 0.80 | 0.51 | N/A | 1.23 | 0.72 | N/A |
Principal components-linear discriminant analysis (PC-LDA) of data acquired by flow infusion electrospray ionization mass spectrometry (FIE-MS) of urine samples collected from 12 individuals from Study 2. Samples were collected ‘fasting’, after a 12 h (minimum) fast, and at 2 and 4 h, after the consumption of the standardized breakfast. Tw, DF Eigenvalues. Different class structures were applied, as indicated in the table
CRP Serum C-reactive protein, HDL High-density lipoprotein, N/A not applicable
Data normalization is a key part of any data pre-processing. As a default we implemented previously validated software routines (Enot et al. 2008) which incorporate logarithmic (Log10) transformation of mass spectrometry data followed by data normalization using sample total ion count (TIC). This benchmark method was compared with the use of normalization factors selected from the metadata collected in this study on Log10 transformed FIE-MS data. Our assessment of the impact of each normalization process was based on its effect on PC-LDA discrimination (using Eigenvalues of the first two DFs between fasting and 2 and 4 h postprandial samples) and effect on Random Forest classification robustness (using classification margin values and classification accuracy between fasting and 2 h postprandial samples only) as summarized in Table S-5. Since creatinine concentration is used commonly for data normalization (Saude et al. 2007) in many quantitative clinical biochemical assays, we considered modeling performance using this factor for data normalization. With the possible exception of urine volume, normalization approaches using different meta-data factors failed to improve data modeling characteristics (Table S-5).
Considerable effort was invested in the collection of metadata to assess the impact of volunteer behavior on data quality. Despite the fact that many subject characteristics (metadata) had relatively high CVs, this inter-individual variability had little impact on metabolomics data modeling characteristics and it did not have value for normalization of raw metabolite fingerprint data. Using NMR, Saude et al. (2007) quantified the variability of 24 metabolites in spot urines collected either ‘mid- morning’ or mid-afternoon (without any control of behavioral activity or diet prior to sampling) and, as expected, reported very large inter-sample variance. Saude et al. (2007) used the concentration of creatinine as a normalization factor in an attempt to compensate for the effect of liquid consumption and subsequent urine volume on metabolite concentrations and concluded that that subject hydration was not a major factor contributing to variance. However, although such an approach assumes correctly that creatinine from endogenous sources is excreted into urine at an approximately constant rate throughout the day (Bingham and Cummings 1985), it fails to take into account the contribution that recent dietary intake of meat-based foods makes to urinary creatinine output (Stella et al. 2006; Walsh et al. 2006), which presents a problem when trying to use creatinine as a normalization factor for postprandial spot urine samples. This fact was recognized by Walsh et al. (2006) who used Pareto-scaled data without log transformation and showed that creatinine concentrations differed significantly between night and morning samples. Unsurprisingly, creatinine concentrations were less variable when diet was controlled. Our results support the cautionary advice given by Walsh et al. (2006) on the use of creatinine as a general normalization factor in urine metabolomics. In the present study, urine volume was one of the few behavior-based variables that impacted adversely on metabolomics data quality and variance in urine volume can be reduced by controlling water intake. In contrast, the present study showed that several other volunteer characteristics including gender, age and physical activity did not affect greatly assessment of dietary exposure using metabolomics approaches. However, for metabolite fingerprinting of urine by FIE-MS in the negative mode high Tw values from the PC-LDA analysis showed that there was an influence of gender which we are investigating further.
Urine metabolite fingerprints are consistent with a standardized volunteer handling procedure
PC-LDA was used to compare urine samples (Fig. 2) collected before (PRE and fasting) and after consumption of the standardized breakfast, from all studies, separately (Fig. 2a, b and c) and together (Fig. 2d). A clear discrimination in metabolite fingerprints between the three classes of urine samples from Study 1 and Study 3 volunteers (Fig. 2a, c) was observed. These results suggest that the metabolites in urine samples collected in each class (i.e., PRE, fasting and after breakfast) were either very different in metabolite content or that the concentrations of the metabolites were very different from those measured in urine samples collected at the other pre-determined times of the feeding cycle. Similar to our findings from Study 1 and Study 3, there was good discrimination between PRE, fasting and postprandial urine samples for volunteers in Study 2 (Fig. 2b). Importantly, and in addition, metabolite fingerprints from urine samples taken on two independent test days (A and B in Study 2) clustered well, indicating that the protocols which we adopted for volunteer handling minimized extraneous variation between repeat study days within each subject. The values obtained for three independent measures of modeling robustness (classification accuracy, margin, and AUC value) after using the classification algorithms Random Forest (RF) and Support Vector Machine (SVM) to compare metabolite fingerprints of fasting urine samples and post-prandial urine samples collected after consumption of the standardized breakfast are represented in Figs. S-1 and S-2 (in electronic supplementary material). These data indicate that margin values in all pair-wise comparisons were between 0.5 and 0.9 and thus well above the 0.3 threshold for adequate separation (Enot et al. 2008). Similarly both AUC values and classification accuracies (ACC) were extremely high, providing further confidence that all the models were very robust.
Fig. 2.
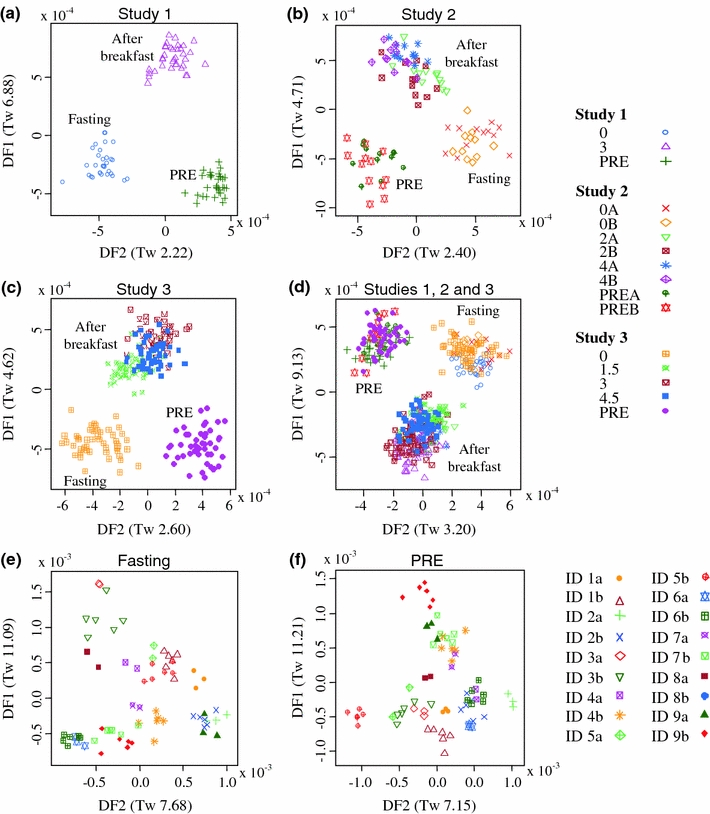
Discrimination of behavioral phase and individual urine samples following analysis by metabolite fingerprinting. Flow Infusion Electrospray-ionization Mass Spectrometry (FIE-MS) data (negative mode; m/z 15–600) derived from analysis of urine samples were subjected to Principal Components-Linear Discriminant Analysis; a Study 1, b Study 2, c Study 3 and d all studies together. Classes are labeled with symbols according to the timing of urine collection in relation to meal consumption. Urine collections: the pre-test day evening/night urine samples collected in Study 1 and 3 (‘PRE’), and in Study 2 on visit A and B (‘PREA’ and ‘PREB’, respectively); the fasting spot urine samples collected after a 12 h (minimum) fast in Study 1 and Study 3 (‘0’), and in Study 2 on visit A and B (‘0A’ and ‘0B’, respectively); the postprandial urine samples collected after the consumption of the standardized breakfast at 3 h in Study 1 (3 h); at 2 and 4 h in Study 2 (where A denoted the first visit and B denoted the second visit) and at 1.5, 3 and 4.5 h in Study 3. PC-LDA performed on FIE-MS fingerprints (negative ion mode, 100-510 m/z) of fasting (e) and ‘PRE’ (f) urine samples of nine volunteers who attended 2 of the 3 studies, using volunteer identification (ID 1–9) and Study (labeled as a or b) as the class structure. Eigenvalues (Tw values) for discriminant functions (DF) are given in brackets
Five volunteers took part in both Study 1 and Study 3 whilst there were four volunteers in common between Study 2 and Study 3. This overlap between studies provided an opportunity to examine the reproducibility of fasting and PRE urine samples on multiple visits for nine volunteers in a PC-LDA. Good sample discrimination by individual volunteer was evident in the majority of fasting samples (Fig. 2e) whilst PRE samples from different visits grouped well in seven of the nine volunteers (Fig. 2f). With each volunteer acting as their individual control, this result suggests that a small number of ‘fasting’ spot urine samples could be used to provide a stable baseline for universal comparisons to examine dietary exposure, to obtain biomarker leads indicative of specific food types.
For a specific type of biological sample to have value for assessment of recent dietary exposure it is important to be able to identify characteristic metabolite changes against a potentially large background of variance in metabolite signals. In this study we focused on protocol components which addressed the control of unwanted variance associated with measurements made on urine. This biofluid is of interest since it can be collected non-invasively and may have particular utility in epidemiological (and other larger) studies. Recent studies using spot urines (Gika et al. 2007; Dunn et al. 2008) demonstrated good metabolite stability in the absence of preservatives for 20–24 h provided that samples were chilled to 4°C. Further work by Maher et al. (2007) using NMR demonstrated that urine displayed minimal changes in metabolite composition, even after 24 h at room temperature. Particularly relevant to future studies is the fact that the metabolite patterns in PRE urine collected without preservatives or refrigeration in the MEDE study could not be discriminated from equivalent PRE urine samples derived from a completely different study of volunteers also exposed to the same pre-evening meal in the GrainMark study (www.grainmark.org) in which samples were stored in a cool pack for up to 12 h (data not shown). These observations suggest that the volunteer handing and sampling methods outlined in the present study are robust and may have value in larger-scale nutrition studies. Specifically, the collection of a spot urine similar to the PRE sample described in the present study is minimally intrusive for study participants (e.g., compared with the collection of 24 h urine) but provides useful information on recent dietary exposure. However, it is accepted that the provision of a standardized meal on the evening before sampling increases costs and adds complexity to study logistics and its potential value in reducing intra- and inter-person variability needs to be explored further.
The standardized evening meal may confer a stable baseline for detection of metabolome differences following acute dietary exposure
If the changes in urine metabolite fingerprint associated with exposure to the standardized evening meal and standardized breakfast were consistent between the repeated studies, then it would be expected that the data features responsible for the discrimination of the different sample types should also be conserved. Thus, for all three Studies we compared the mass signals (in both ionization modes) responsible for discrimination between the fasting and the PRE urine samples (Table S-6 and S7 in electronic supplementary material). A combination of three methods for feature selection (RF Importance Scores, AUC and the Welch’s t-test) was used to produce an average rank for all features (m/z values) based on the statistics generated by each approach (Enot et al. 2008). To maximize predictability, re-sampling using bootstrapping was applied. For positive mode it can be seen that there are 13 discriminatory metabolite signals (shown in bold) common to all three studies and eight common signals for negative mode. These data confirm the supposition that the ‘PRE’ samples are compositionally consistent both within and between studies with the caveat that Studies 2 and 3 had four volunteers in common. Despite the impact of individual habitual diet prior to the evening meal, this observation further validates the suggestion that such an overnight pool may have value for monitoring general dietary exposure.
Metabolite signals responsible for the discrimination between fasting from ‘PRE’ urine samples within each study would be expected to be derived from specific components of the evening meal that are excreted both before and after the influence of fermentation by colonic microbes. A correlation analysis was performed on the top 35 nominal mass (1 amu) discriminatory signals for each study to determine the relationship between the positive ion mode m/z signals. Similar correlations between signals were seen for each study (data not shown) and the mathematical relationship between masses suggested the presence of possible isotopes (difference of 1 amu m/z) and salt adducts (Na adduct +22 amu, K adduct +38 amu, compared with [M + H]1+) in the top explanatory signals. These high ranked mass bins were investigated in detail by Ultra-high mass resolution mass spectrometry using FT-ICR-MS. Table 2 summarizes the accurate mass FT-ICR-MS analysis of the top 10 explanatory mass bins in ‘PRE’ samples. Querying the identity of the accurate mass signals against MZedDB (Draper et al. 2009) suggested that three of the top four explanatory signals distinguishing ‘PRE’ urine from fasting urine were ionization products of the dipeptide, anserine, a metabolite present at high concentration in chicken breast meat (Aristoy and Toldra 2004; Yeum et al. 2010) and known to be excreted, largely without biotransformation, in humans (Yeum et al. 2010). FIE-MS2 was employed to provide further confirmation that these observed signals were adducts and isotopes of anserine (Fig. 3a–c). Chicken breast was the meat component of the standardized evening meal consumed by study participants. Although we have no direct evidence that data modeling characteristics were improved by adoption of a standardized evening meal (Walsh et al. 2006; Llorach et al. 2009; Winnike et al. 2009; Llorach-Asuncion et al. 2010), the analysis of ‘PRE’ urine samples confirmed that the foods chosen were low in phytochemicals, particularly polyphenols, which can often dominate urine metabolite fingerprints. The box-plots in Fig. 3d and e show that the two highest ranked positive signals (m/z 241 and m/z 242) are both increased in the ‘PRE’ urine samples and decreased in the fasting ones. Phenylacetylglutamine was also identified tentatively as a signal explanatory of chemical differences between fasting and ‘PRE’ urine samples (Table 2). The discovery of phenylacetylglutamine in ‘PRE’ urine might be partially explained by the action of colonic microflora on protein-derived phenylalanine following exposure to the high protein content of the standardized evening meal (Clayton et al. 2009), but could also reflect the microbial fermentation of aromatic components from previous dietary phytochemical intake (Holmes et al. 2008), or from the chocolate component of the evening meal chocolate éclair (Rezzi et al. 2007). Despite the fact that spectra were aggregated into nominal mass bins, this rapid metabolite fingerprinting method highlighted very efficiently potential explanatory mass bins that could be investigated further by targeted accurate mass analysis. These observations provide a clear validation of the biological link between recent dietary exposure and the conclusions derived from modeling of metabolite fingerprint data.
Table 2.
FT-ICR-MS analysis of positive ionization signals in nominal mass bins representing the top 10 features discriminating a‘PRE’ from bfasting urine samples in three replicated studies
| Nominal mass | Average rank | cMajor detected signal in FT-ICR-MS | Putative metabolite (1 ppm) | Ionisation product |
|---|---|---|---|---|
| 241 | 1 | 241.12958 | Anserine | [M + H]1+ |
| 242 | 2 | 242.13293 | Anserine | 13C isotope of [M + H]1+ |
| 361 | 3 | 361.32742 | 13C isotope of m/z 360 | ? |
| 263 | 4 | 263.11159 | Anserine | [M + Na]1+ |
| 113 | 5 | No signal | ? | ? |
| 213 | 6 | 212.99970 | Uric acid | [M + 2Na–H]1+ |
| 341 | 7 | 341.03038 | Phenylacetylglutamine | [M + 2 K–H]1+ |
| 160 | 8 | 160.09674 | 4-Hydroxy-proline betaine | [M + H]1+ |
| 285 | 9 | 285.09363 | Anserine | [M + 2Na–H]1+ |
| 360 | 10 | 360.32407 | ? | ? |
a‘PRE’, pool of the pre-test day over-night urine voids
bFasting, spot urine sample after a 12 h (minimum) fast
cThe tentatively identified metabolite is generally the most abundant signal
Fig. 3.
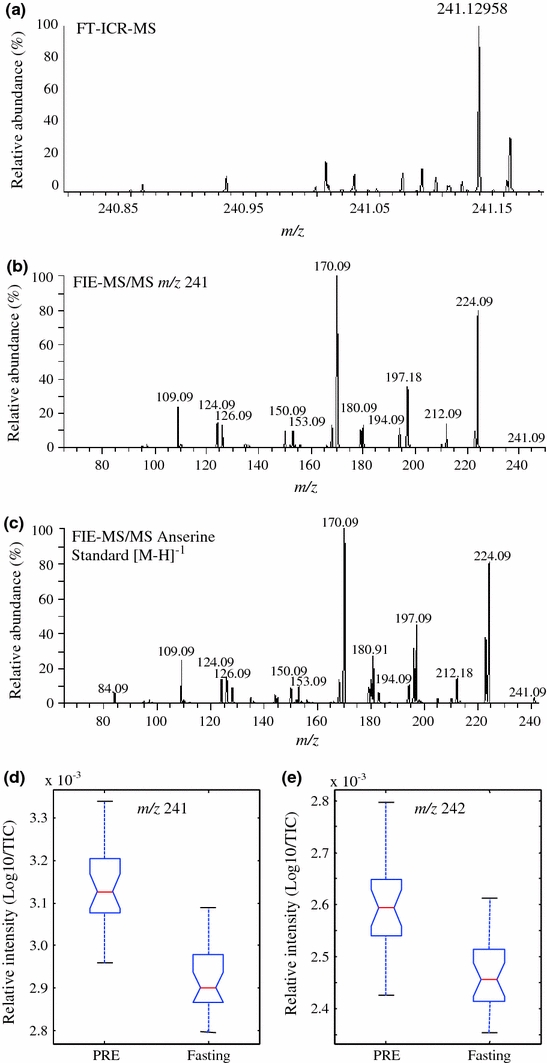
Identification of anserine (calculated accurate mass m/z 241.12952 [M + H]1+) and signal levels in ‘PRE’ and fasting urine samples. a FT-ICR-MS accurate mass window of masses from m/z 240.80 to 241.20 in a fasting urine sample pool; b FIE-MS2 of mass bin m/z 241 from a fasting urine sample pool; c FIE-MS2 of an authentic sample of synthetic Anserine [M + H]1+. Box plots of explanatory metabolite signals with the mass to charge ratio (m/z) 241 d and isotopic signal m/z 242 e where the box indicates the interquartile range; the horizontal bar, the median; vertical bars, the maximum and minimum values up to 1.5× interquartile range; ‘PRE’, the pool of the pre-test day over-night urine voids; ‘Fasting’, the spot urine sample (0 h) collected after a 12 h (minimum) fast (n = 12 volunteers, P < 0.005 for both, (d) and (e), Welch’s t-test)
Urine composition is consistent in a time window of 2–4 h after breakfast consumption
Postprandial spot urine samples were collected 3 h (Study 1), 2, 4, 6 and 8 h (Study 2) and 1.5, 3 and 4.5 h (Study 3) after the standardized breakfast. A light lunch was consumed 4 h after the test breakfast by the Study 2 volunteers only. To decide the optimum time to collect a representative postprandial urine after exposure to the standard breakfast (i.e., producing strong models in terms of validation characteristics), the ‘explanatory’ mass signals discriminating fasting urine samples from postprandial ones were selected, using RF, AUC and the Welch’s t-test. Examination of the average rank order of signals presented in Table S-8 and S-9 revealed that postprandial urine composition was very consistent between 2 and 4 h when ≥20 of the top 30 features were common between three or more time points for the positive and negative ionization mode data. The list of explanatory masses from the 1.5 and 8 h urine collections (timed from the end of the consumption of the standardized breakfast) shared fewer of these common signals in both ionization modes. Although it is possible that the 8 h urine samples will contain metabolites derived from the light lunch, it is expected that postprandial samples collected at this time will also contain metabolites derived from colonic fermentation of the breakfast. Although the observed nutrikinetic behavior (van Velzen et al. 2009) is specific to the standardized breakfast used in the present report, we suggest that sampling postprandial urines within a specific time window might prove beneficial, particularly in large scale dietary intervention studies attempting to link dietary chemistry exposure to desirable health outcomes. In this context, the need for behavioral constraints and the normalizing impact of a standardized evening meal on the day prior to sampling remain to be investigated.
Validation of methodology by analysis of expected orange juice signals in postprandial urine samples
Orange juice, a component of the standardized breakfast, is rich in phytochemicals including the flavonoid glycosides hesperidin (hesperetin-7-rutinoside) and narirutin (naringenin-7-rutinoside) (Kawaii et al. 1999; Brett et al. 2009). The absorption of hesperidin and narirutin takes place in the colon only after hydrolysis by rhamnosidases originating from microflora and so provides distinctive urinary excretion markers to indicate the onset of colonic fermentation. Dietary flavonoid glycosides appear subsequently in plasma/urine as glucuronidated and sulfonated conjugates of the flavonoid aglycone, due to the action of phase II conjugating and detoxifying enzymes (Bokkenheuser et al. 1987; Choudhury et al. 1999; Rechner et al. 2004; Brett et al. 2009). Consequently mass bins expected to contain glucuronidated and sulfonated hesperetin and naringenin signals were analyzed using FT-ICR-MS to determine whether the effects of colonic fermentation could be identified. As expected, signals typical of hesperetin and naringenin in the glucuronidated and sulfonated forms were found only in 6 and 8 h postprandial urines with a trace amount of naringenin monoglucuronide present in some samples at 4 h (Table 3). Signal identities were further confirmed by comparison of FIE-MS2 and FIE-MS3 spectra with those derived from analysis of chemical standards. As an example, the analysis of hesperetin sulfate [m/z 318 [M – H]1−) in urines from a pool of four randomly selected volunteers is shown in Fig. S-3 (in electronic supplementary material). These data suggest that urine samples collected up to 4.5 h after consumption of the standard breakfast will contain only few (if any) detectable metabolites resulting from biotransformations by colonic microbes. Indeed in ongoing work (unpublished) we have already shown that urine sampling prior to the onset of colonic fermentation can provide robust dietary exposure biomarker leads for several different foods of high public health importance. However, it is likely that many food components would also give rise to additional colonic biotransformation products with potential value as intake biomarkers, but differences in bacterially derived metabolites resulting from the diversity in human colonic microflora populations (Wikoff et al. 2009) may further complicate their utility as biomarkers.
Table 3.
Accurate mass analysis by FT-ICR-MS of glucuronidated and sulfonated hesperetin and naringenin in ‘PRE’, fasting and postprandial urine samples from Study 2
| Expected metabolite signal | Theoretical mass | Accurate mass detected by FT-ICR-MS analysis | |||||
|---|---|---|---|---|---|---|---|
| PREa | Fastingb | Postprandial samplesc | |||||
| 2 h | 4 h | 6 h | 8 h | ||||
| Hesperetin sulfate [M − H]1− | 381.02858 | N/D | N/D | N/D | N/D | 381.02854 (Δppm 0.10) | 381.02848 (Δppm 0.26) |
| Hesperetin-monoglucuronide [M − H]1− | 477.10385 | N/D | N/D | N/D | N/D | 477.10382 (Δppm 0.07) | 477.10384 (Δppm 0.02) |
| Naringenin monoglucuronide [M − H]1− | 447.09329 | N/D | N/D | N/D | Trace | 447.09336 (Δppm 0.16) | 447.09318 (Δppm 0.24) |
a‘PRE’, pool of the pre-test day over-night urine voids
bFasting, spot urine sample after a 12 h (minimum) fast
cUrine samples (h postprandial) after the standardized breakfast
N/D not detected, Δppm part-per-million difference compared with the theoretical mass
Investigation of explanatory mass bins discriminating 2–3 h postprandial urines from fasting urine samples highlights proline betaine derived from standard breakfast
The top 30 positive ion mode features responsible for discrimination between fasting and 2–3 postprandial spot urine samples from Studies 1, 2 and 3 are shown in Fig. 4a. The explanatory mass signals common to all three comparisons are color coded. The Random Forest (RF) algorithm provides the most robust classifier and as a ‘rule of thumb’ we have shown, using a range of other FIE-MS data sets, that the threshold for significance in a pair-wise analysis lies within an Importance Score range of 0.0015–0.003 (Enot et al. 2008). In the present data set, the curve inflection occurring at ~0.002 showed that the top 15–20 of >1,000 m/z signals provided most (80%) of the explanatory power of recent dietary exposure (Fig. 4b). A correlation analysis was performed on the top signals for each study separately to determine the relationship between the positive ion mode m/z signals. Several signals were found to be strongly correlated and the mathematical relations between masses suggested the presence of both isotopes and salt adducts in the top ranked explanatory signals (Fig. 4c). These highly ranked nominal mass bins were investigated in detail by FT-ICR-MS analysis.
Fig. 4.
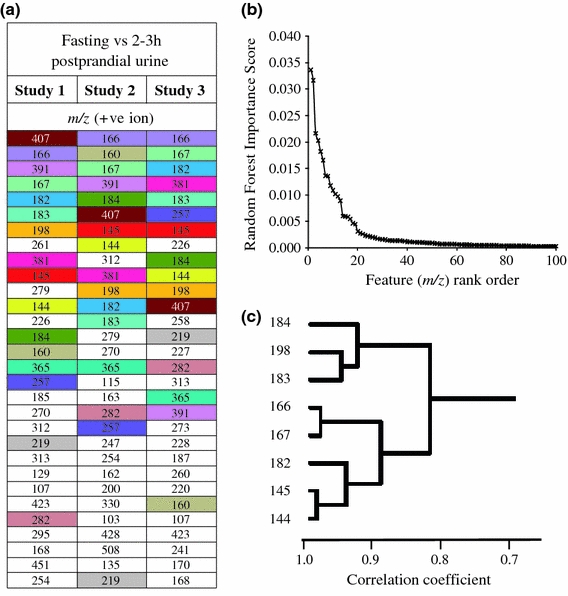
Overview of signals discriminating 2 and 3 h postprandial urine samples from fasting urines. a Top 30 signals in flow infusion electrospray-ionization mass spectrometry (FIE-MS) data (positive ion; m/z 15–1,200) responsible for discriminating postprandial urine samples taken after the consumption of the standardized breakfast (3 h from Study 1 and Study 3 and 2 h from Study 2) from ‘fasting’ urine samples. Signals are color-coded to compare average relative ranking in each Study after applying a combination of three machine learning methods; Random Forest, area under the receiver operating curve (AUC) and Welch’s t-test (see also Table S-8/9 for details). b Random Forest Importance Scores of the pair-wise comparion between FIE-MS data of fasting and 3 h postprandial urine samples (Study 3) plotted against feature rank order. c Correlation cluster of the top features discriminating fasting from postprandial urine collected 3 h after consuming the standard breakfast (Study 3)
Querying the accurate mass signals against MZedDB (Draper et al. 2009) suggested that the majority of the explanatory signals were ionization products and isotopes of proline betaine and a related metabolite, hydroxy-proline betaine (Table 4). These results were further confirmed using FIE-MS2 and will be reported elsewhere (Lloyd et al. 2011). The fact that several of the explanatory mass bins contained isotopes, salt adducts or different biotransformation products of proline betaine, provided confidence of a statistically significant relationship between the ingested food (orange juice in the standard breakfast) and this urinary biomarker. There was a rapid rise in the level of all signals associated with proline betaine and hydroxy-proline betaine as early as 2 h after consumption of the standardized breakfast (Fig. 5). This result is in accord with Atkinson et al. (2007) who demonstrated, using LC–MS techniques, that urinary proline betaine increased markedly after drinking orange juice, peaking at 2 h after consumption.
Table 4.
Many explanatory mass signals discriminating fasting from 2 to 3 h post-test breakfast urines are ionization products of proline betaine and 4-hydroxy-proline betaine
| m/z a | Rankb | Detected massc | Putative metabolite | Ionization product | Theoretical mass | Δppmd |
|---|---|---|---|---|---|---|
| 166 | 1 | 166.08377 | Proline betaine | [M + Na]1+ | 166.08385 | 0.49 |
| 167 | 2 | 167.08713 | Proline betaine | 13C isotope of [M + Na]1+ | 167.08721 | 0.48 |
| 182 | 3 | 182.05772 | Proline betaine | [M + K]1+ | 182.05779 | 0.36 |
| 183 | 4 | 183.06109 | Proline betaine | 13C isotope of [M + K]1+ | 183.06114 | 0.29 |
| 145 | 5 | 145.10518 | Proline betaine | 13C isotope of [M + H]1+ | 145.10526 | 0.55 |
| 144 | 8 | 144.10187 | Proline betaine | [M + H]1+ | 144.10191 | 0.22 |
| 184 | 10 | 184.05585 | Proline betaine | 41K isotope of [M + K]1+ | 184.05591 | 0.30 |
| 198 | 6 | 198.05269 | 4-hydroxy-proline betaine | [M + K]1+ | 198.05270 | 0.18 |
| 160 | 15 | 160.09674 | 4-hydroxy-proline betaine | [M + H]1+ | 160.09682 | 0.51 |
a m/z, nominal mass detected using Flow Infusion Electrospray-ionization Mass Spectrometry (FIE-MS)
bRank calculated from the average ranking in three replicated studies (1, 2 and 3)
cAccurate mass detected using Fourier-Transform Ion Cyclotron Resonance Mass-Spectroscopy (FT-ICR-MS)
dΔppm, part-per-million difference compared with the theoretical mass
Fig. 5.
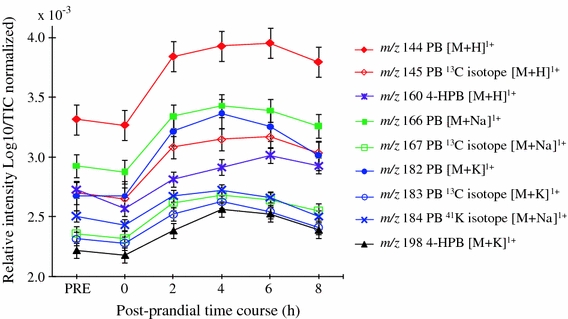
Flow Infusion Electrospray ionization Mass Spectrometry intensity plots of ions indicative of proline betaine and 4-hydroxy-proline betaine in a urine time course. PB proline betaine, 4-HPB 4-hydroxy-proline betaine; Log10/TIC, normalization using sample total ion count (TIC) and logarithmic transformation of data; ‘PRE’, pool of the pre-test day over-night urine voids; ‘0’, fasting spot urine sample after a 12 h (minimum) fast; ‘2’, ‘4’, ‘6’ and ‘8’, postprandial urine samples (with a light lunch consumed after the 4 h sample collection)
Conclusion
We developed well characterized, practical (i.e., acceptable to volunteers and researchers) and reproducible protocols for volunteer handling and sampling in human nutrition studies; the SOP is available on the NuGO website (http://www.nugo.org/sops/40878/41026). Using this protocol we demonstrated that metabolite profiles of urine collected at different times of the day, viz. overnight, fasted before the standardized breakfast and at intervals after the standardized breakfast, were distinctly different. Such differences were robust and highly reproducible within individuals on separate occasions (weeks or months apart). We suggest that if food components are consumed habitually then either overnight pools or postprandial urine samples (in a 2–4 h time window after a main meal) collected on random days could prove highly informative of general diet. This procedure would have minimal interference with the volunteer’s normal daily activities. Indeed, by substitution of one component of the standard breakfast (i.e., cornflakes) with different foods deemed of high public health significance we have evidence that metabolite fingerprinting can efficiently highlight metabolites which are associated with specific dietary components and that may be used as targets for the future development of biomarkers of dietary exposure (Lloyd et al. 2011).
Electronic supplementary material
Below is the link to the electronic supplementary material.
Acknowledgments
We thank the volunteers for their commitment, the Clinical Research Facility Centre for their premises and nursing support, Claire Kent, Heather Gifford, Julie Coaker and Linda Penn for their practical support, Marks & Spencer for donating the chocolate éclairs, and Chris Seal and his team (Newcastle University) for discussions and preliminary experiments which helped to validate the volunteer handling procedures. This research project was supported by the UK Food Standards Agency (Project N05073)
Open Access
This article is distributed under the terms of the Creative Commons Attribution Noncommercial License which permits any noncommercial use, distribution, and reproduction in any medium, provided the original author(s) and source are credited.
Footnotes
Gaëlle Favé, Manfred Beckmann contributed equally to the project.
References
- Aristoy MC, Toldra F. Histidine dipeptides HPLC-based test for the detection of mammalian origin proteins in feeds for ruminants. Meat Science. 2004;67:211–217. doi: 10.1016/j.meatsci.2003.10.008. [DOI] [PubMed] [Google Scholar]
- Assfalg M, Bertini I, Colangiuli D, et al. Evidence of different metabolic phenotypes in humans. Proceedings of the National Academy of Sciences of the United States of America. 2008;105:1420–1424. doi: 10.1073/pnas.0705685105. [DOI] [PMC free article] [PubMed] [Google Scholar]
- Atkinson W, Downer P, Lever M, et al. Effects of orange juice and proline betaine on glycine betaine and homocysteine in healthy male subjects. European Journal of Nutrition. 2007;46:446–452. doi: 10.1007/s00394-007-0684-5. [DOI] [PubMed] [Google Scholar]
- Beckmann M, Parker D, Enot DP, et al. High-throughput, nontargeted metabolite fingerprinting using nominal mass flow injection electrospray mass spectrometry. Nature Protocols. 2008;3:486–504. doi: 10.1038/nprot.2007.500. [DOI] [PubMed] [Google Scholar]
- Bingham SA. Biomarkers in nutritional epidemiology. Public Health Nutrition. 2002;5:821–827. doi: 10.1079/PHN2002368. [DOI] [PubMed] [Google Scholar]
- Bingham SA, Cummings JH. Urine nitrogen as an independent validatory measure of dietary-intake—A study of nitrogen-balance in individuals consuming their normal diet. The American Journal of Clinical Nutrition. 1985;42:1276–1289. doi: 10.1093/ajcn/42.6.1276. [DOI] [PubMed] [Google Scholar]
- Bingham SA, Gill C, Welch A, et al. Validation of dietary assessment methods in the UK arm of EPIC using weighed records, and 24-hour urinary nitrogen and potassium and serum vitamin C and carotenoids as biomarkers. International Journal of Epidemiology. 1997;26:S137–S151. doi: 10.1093/ije/26.suppl_1.S137. [DOI] [PubMed] [Google Scholar]
- Bokkenheuser VD, Shackleton CHL, Winter J. Hydrolysis of dietary flavonoid glycosides by strains of intestinal bacteroides from humans. Biochemical Journal. 1987;248:953–956. doi: 10.1042/bj2480953. [DOI] [PMC free article] [PubMed] [Google Scholar]
- Bollard ME, Stanley EG, Lindon JC, et al. NMR-based metabonomic approaches for evaluating physiological influences on biofluid composition. NMR in Biomedicine. 2005;18:143–162. doi: 10.1002/nbm.935. [DOI] [PubMed] [Google Scholar]
- Brett GM, Hollands W, Needs PW, et al. Absorption, metabolism and excretion of flavanones from single portions of orange fruit and juice and effects of anthropometric variables and contraceptive pill use on flavanone excretion. British Journal of Nutrition. 2009;101:664–675. doi: 10.1017/S000711450803081X. [DOI] [PMC free article] [PubMed] [Google Scholar]
- Chen C, Shah YM, Morimura K, et al. Metabolomics reveals that hepatic stearoyl-CoA desaturase 1 downregulation exacerbate inflammation an acute colitis. Cell Metabolism. 2008;6:135–147. doi: 10.1016/j.cmet.2007.12.003. [DOI] [PMC free article] [PubMed] [Google Scholar]
- Choudhury R, Chowrimootoo G, Srai K, Debnam E, Rice-Evans CA. Interactions of the flavonoid naringenin in the gastrointestinal tract and the influence of glycosylation. Biochemical and Biophysical Research Communications. 1999;265:410–415. doi: 10.1006/bbrc.1999.1695. [DOI] [PubMed] [Google Scholar]
- Clayton TA, Baker D, Lindon JC, Everett JR, Nicholson JK. Pharmacometabonomic identification of a significant host-microbiome metabolic interaction affecting human drug metabolism. Proceedings of the National Academy of Sciences of the United States of America. 2009;106:14728–14733. doi: 10.1073/pnas.0904489106. [DOI] [PMC free article] [PubMed] [Google Scholar]
- deRooij BM, Boogaard PJ, Rijksen DA, Commandeur JNM, Vermeulen NPE. Urinary excretion of N-acetyl-S-allyl-l-cysteine upon garlic consumption by human volunteers. Archives of Toxicology. 1996;70:635–639. doi: 10.1007/s002040050322. [DOI] [PubMed] [Google Scholar]
- Draper J, Enot DP, Parker D, et al. Metabolite signal identification in accurate mass metabolomics data with MZedDB, an interactive m/z annotation tool utilising predicted ionisation behaviour ‘rules’. BMC Bioinformatics. 2009;10:227. doi: 10.1186/1471-2105-10-227. [DOI] [PMC free article] [PubMed] [Google Scholar]
- Dunn WB, Broadhurst D, Ellis DI, et al. A GC-TOF-MS study of the stability of serum and urine metabolomes during the UK Biobank sample collection and preparation protocols. International Journal of Epidemiology. 2008;37(Suppl 1):i23–i30. doi: 10.1093/ije/dym281. [DOI] [PubMed] [Google Scholar]
- Enot DP, Lin W, Beckmann M, et al. Preprocessing, classification modeling and feature selection using flow injection electrospray mass spectrometry metabolite fingerprint data. Nature Protocols. 2008;3:446–470. doi: 10.1038/nprot.2007.511. [DOI] [PubMed] [Google Scholar]
- Favé G, Beckmann ME, Draper JH, Mathers JC. Measurement of dietary exposure: A challenging problem which may be overcome thanks to metabolomics? Genes and Nutrition. 2009;4:135–141. doi: 10.1007/s12263-009-0120-y. [DOI] [PMC free article] [PubMed] [Google Scholar]
- Gika HG, Theodoridis GA, Wingate JE, Wilson ID. Within-day reproducibility of an HPLC-MS-Based method for metabonomic analysis: Application to human urine. Journal of Proteome Research. 2007;6:3291–3303. doi: 10.1021/pr070183p. [DOI] [PubMed] [Google Scholar]
- Gu HW, Pan ZZ, Xi BW, et al. H-1 NMR metabolomics study of age profiling in children. NMR Biomedicine. 2009;22:826–833. doi: 10.1002/nbm.1395. [DOI] [PMC free article] [PubMed] [Google Scholar]
- Holmes E, Loo RL, Stamler J, et al. Human metabolic phenotype diversity and its association with diet and blood pressure. Nature. 2008;453:396–400. doi: 10.1038/nature06882. [DOI] [PMC free article] [PubMed] [Google Scholar]
- Kawaii S, Tomono Y, Katase E, Ogawa K, Yano M. Quantitation of flavonoid constituents in Citrus fruits. Journal of Agricultural and Food Chemistry. 1999;47:3565–3571. doi: 10.1021/jf990153+. [DOI] [PubMed] [Google Scholar]
- Kochhar S, Jacobs DM, Ramadan Z, et al. Probing gender-specific metabolism differences in humans by nuclear magnetic resonance-based metabonomics. Analytical Biochemistry. 2006;352:274–281. doi: 10.1016/j.ab.2006.02.033. [DOI] [PubMed] [Google Scholar]
- Kussmann M, Rezzi S, Daniel H. Profiling techniques in nutrition and health research. Current Opinion in Biotechnology. 2008;19:83–99. doi: 10.1016/j.copbio.2008.02.003. [DOI] [PubMed] [Google Scholar]
- Lenz EM, Bright J, Wilson ID, Morgan SR, Nash AFP. A H-1 NMR-based metabonomic study of urine and plasma samples obtained from healthy human subjects. Journal of Pharmaceutical and Biomedical Analysis. 2003;33:1103–1115. doi: 10.1016/S0731-7085(03)00410-2. [DOI] [PubMed] [Google Scholar]
- Llorach R, Urpi-Sarda M, Jauregui O, Monagas M, Andres-Lacueva C. An LC-MS-based metabolomics approach for exploring urinary metabolome modifications after cocoa consumption. Journal of Proteome Research. 2009;8:5060–5068. doi: 10.1021/pr900470a. [DOI] [PubMed] [Google Scholar]
- Llorach-Asuncion R, Jauregui O, Urpi-Sarda M, Andres-Lacueva C. Methodological aspects for metabolome visualization and characterization: A metabolomic evaluation of the 24 h evolution of human urine after cocoa powder consumption. Journal of Pharmaceutical and Biomedical Analysis. 2010;51:373–381. doi: 10.1016/j.jpba.2009.06.033. [DOI] [PubMed] [Google Scholar]
- Lloyd A. J., Beckmann M., Favé G., Mathers J. C. & Draper J. (2011). Habitual exposure to dietary citrus is correlated with the level of proline betaine in fasting urine samples. British Journal of Nutrition, Under Revision, BJN-2010-015910R (in press).
- Maher AD, Zirah SFM, Holmes E, Nicholson JK. Experimental and analytical variation in human urine in H-1 NMR spectroscopy-based metabolic phenotyping studies. Analytical Chemistry. 2007;79:5204–5211. doi: 10.1021/ac070212f. [DOI] [PubMed] [Google Scholar]
- Major HJ, Williams R, Wilson AJ, Wilson ID. A metabonomic analysis of plasma from Zucker rat strains using gas chromatography/mass spectrometry and pattern recognition. Rapid Communications in Mass Spectrometry. 2006;20:3295–3302. doi: 10.1002/rcm.2732. [DOI] [PubMed] [Google Scholar]
- Mullen W, Boitier A, Stewart AJ, Crozier A. Flavonoid metabolites in human plasma and urine after the consumption of red onions: Analysis by liquid chromatography with photodiode array and full scan tandem mass spectrometric detection. Journal of Chromatography A. 2004;1058:163–168. [PubMed] [Google Scholar]
- Penn L, Boeing H, Boushey CJ, et al. Assessment of dietary intake: NuGO symposium report. Genes and Nutrition. 2010;5:205–213. doi: 10.1007/s12263-010-0175-9. [DOI] [PMC free article] [PubMed] [Google Scholar]
- Rasmussen L, Savorani F, Larsen T, et al. Standardization of factors that influence human urine metabolomics. Metabolomics. 2011;7:71–83. doi: 10.1007/s11306-010-0234-7. [DOI] [Google Scholar]
- Rechner AR, Smith MA, Kuhnle G, et al. Colonic metabolism of dietary polyphenols: Influence of structure on microbial fermentation products. Free Radical Biology and Medicine. 2004;36:212–225. doi: 10.1016/j.freeradbiomed.2003.09.022. [DOI] [PubMed] [Google Scholar]
- Rezzi S, Ramadan Z, Martin FPJ, et al. Human metabolic phenotypes link directly to specific dietary preferences in healthy individuals. Journal of Proteome Research. 2007;6:4469–4477. doi: 10.1021/pr070431h. [DOI] [PubMed] [Google Scholar]
- Saude EJ, Adamko D, Rowe BH, Marrie T, Sykes BD. Variation of metabolites in normal human urine. Metabolomics. 2007;3:439–451. doi: 10.1007/s11306-007-0091-1. [DOI] [Google Scholar]
- Scalbert A, Brennan L, Fiehn O, et al. Mass-spectrometry-based metabolomics: Limitations and recommendations for future progress with particular focus on nutrition research. Metabolomics. 2009;5:435–458. doi: 10.1007/s11306-009-0168-0. [DOI] [PMC free article] [PubMed] [Google Scholar]
- Schneider H, Ma L, Glatt H. Extractionless method for the determination of urinary caffeine metabolites using high-performance liquid chromatography coupled with tandem mass spectrometry. Journal of Chromatography B Analytical Technologies in the Biomedical and Life Sciences. 2003;789:227–237. doi: 10.1016/S1570-0232(03)00065-5. [DOI] [PubMed] [Google Scholar]
- Southam AD, Payne TG, Cooper HJ, et al. Dynamic range and mass accuracy of wide-scan direct infusion nanoelectrospray Fourier transform ion cyclotron resonance mass spectrometry-based metabolomics increased by the spectral stitching method. Analytical Chemistry. 2007;79:4595–4602. doi: 10.1021/ac062446p. [DOI] [PubMed] [Google Scholar]
- Stella C, Beckwith-Hall B, Cloarec O, et al. Susceptibility of human metabolic phenotypes to dietary modulation. Journal of Proteome Research. 2006;5:2780–2788. doi: 10.1021/pr060265y. [DOI] [PubMed] [Google Scholar]
- van Velzen EJJ, Westerhuis JA, van Duynhoven JPM, et al. Phenotyping tea consumers by nutrikinetic analysis of polyphenolic end-metabolites. Journal of Proteome Research. 2009;8:3317–3330. doi: 10.1021/pr801071p. [DOI] [PubMed] [Google Scholar]
- Wallace M, Hashim Y, Wingfield M, et al. Effects of menstrual cycle phase on metabolomic profiles in premenopausal women. Human Reproduction. 2010;25:949–956. doi: 10.1093/humrep/deq011. [DOI] [PubMed] [Google Scholar]
- Walsh MC, Brennan L, Malthouse JPG, Roche HM, Gibney MJ. Effect of acute dietary standardization on the urinary, plasma, and salivary metabolomic profiles of healthy humans. The American Journal of Clinical Nutrition. 2006;84:531–539. doi: 10.1093/ajcn/84.3.531. [DOI] [PubMed] [Google Scholar]
- Walsh MC, Brennan L, Pujos-Guillot E, et al. Influence of acute phytochemical intake on human urinary metabolomic profiles. The American Journal of Clinical Nutrition. 2007;86:1687–1693. doi: 10.1093/ajcn/86.5.1687. [DOI] [PubMed] [Google Scholar]
- Wang YL, Tang HR, Nicholson JK, et al. A metabonomic strategy for the detection of the metabolic effects of chamomile (Matricaria recutita L.) ingestion. Journal of Agricultural and Food Chemistry. 2005;53:191–196. doi: 10.1021/jf0403282. [DOI] [PubMed] [Google Scholar]
- Wareham NJ, Jakes RW, Rennie KL, et al. Validity and repeatability of a simple index derived from the short physical activity questionnaire used in the European Prospective Investigation into Cancer and Nutrition (EPIC) study. Public Health Nutrition. 2003;6:407–413. doi: 10.1079/PHN2002439. [DOI] [PubMed] [Google Scholar]
- Wikoff WR, Anfora AT, Liu J, et al. Metabolomics analysis reveals large effects of gut microflora on mammalian blood metabolites. Proceedings of the National Academy of Sciences of the United States of America. 2009;106:3698–3703. doi: 10.1073/pnas.0812874106. [DOI] [PMC free article] [PubMed] [Google Scholar]
- Winnike JH, Busby MG, Watkins PB, O’Connell TM. Effects of a prolonged standardized diet on normalizing the human metabolome. The American Journal of Clinical Nutrition. 2009;90:1496–1501. doi: 10.3945/ajcn.2009.28234. [DOI] [PMC free article] [PubMed] [Google Scholar]
- Yeum KJ, Orioli M, Regazzoni L, et al. Profiling histidine dipeptides in plasma and urine after ingesting beef, chicken or chicken broth in humans. Amino Acids. 2010;38:847–858. doi: 10.1007/s00726-009-0291-2. [DOI] [PubMed] [Google Scholar]
Associated Data
This section collects any data citations, data availability statements, or supplementary materials included in this article.