

Abstract
Background & objectives:
Peak bone mass, a major determinant of osteoporosis is influenced by genetic, nutritional, lifestyle and hormonal factors. This study was designed to evaluate the impact of sports training on dietary intake and bone mineral and metabolic parameters in young healthy Indian females.
Methods:
Healthy female college going students (N=186, sportswomen, 90; controls 96) in the age group of 18-21 yr, residing in New Delhi (India) were evaluated for anthropometry, biochemistry (serum total and ionic calcium, phosphorus, total alkaline phosphatase, 25-hydroxyvitamin D & parathyroid hormone), diet, physical activity and lifestyle. Bone mineral density (BMD) at hip, forearm and lumbar spine were studied using central DXA.
Results:
Sports related physical activity (3 vs. 0 h/day, P<0.001) and direct sunlight exposure (120 vs. 30 min/day, P<0.001) were significantly higher in sportswomen than in controls with sedentary lifestyle. Significantly higher intake of all macronutrients (energy, protein, carbohydrates and fat) and dietary calcium was noted in the diets of sportswomen. Mean serum 25(OH)D levels were significantly higher (53.0±18.9 vs. 12.9±7.7 nmol/l; P<0.001) while PTH (35.3±17.6 vs. 51.7±44.9 pg/ml; P<0.001) and ALP levels (194.0±51.0 vs. 222.1±51.4 IU/l; P<0.001) were significantly lower in sportswomen when compared to controls. No significant difference was found in ionized calcium and inorganic phosphorus in the two groups. Significantly higher (P<0.001) total BMD and BMD at all sites except femur neck were found in sportswomen than controls (P<0.001).
Interpretation & conclusions:
Physical activity, optimal nutrition and adequate sun exposure are vital for attaining peak bone mass.
Keywords: Bone mineral density, nutrition, physical activity, sun exposure, sportswomen
Adolescence, characterized by changes in height, weight and body composition, is also a crucial period for bone mineral accrual1. Approximately 40 per cent of peak bone mass is accumulated during adolescence which protects against post menopausal osteoporosis2. Therefore, optimizing peak bone mass in early adulthood is thought to reduce the risk of osteoporosis by offsetting bone losses later in life.
About 50-70 per cent of the variance in peak bone mass within a population is determined by genetic factors3,4. Other potential determinants which interact with genetic factors to influence bone mass include gender, diet, physical activity, sun exposure, and hormonal factors5,6.
There is a marked variation in bone mineral density (BMD) among women from different ethnic groups. Thus, women of European origin have been observed to have lower BMD at different skeletal sites compared to their African-American counterparts7,8 but a higher BMD than those of Far East Asian origin9. Among environmental factors, nutrition and vitamin D status play a crucial role in acquisition of bone mineral density10,11. Also, there is evidence to suggest that physical activity during adolescence and early adulthood is a key determinant of peak bone mass12–14. A positive association between bone mineral status and daily participation in high-impact physical activity has also been reported15,16.
In view of limited information on Indians, we decided to study the effect of sports training and nutrition on BMD in a group of post-pubertal women, i.e., an age group during which bone mass is still being accumulated. To meet this objective sportswomen involved in regular moderate to high level physical activity were compared with age matched sedentary controls.
Material & Methods
Population and sample collection: The study included 186 female subjects (90-sportswomen; 96-controls), aged 18-21 yr, from different colleges affiliated to the University of Delhi (DU). A study subject was defined as a sportswoman, if she represented either her college or the State of Delhi in competitions for either individual or team sports. A subject was selected as a control if she was involved in less than 150 min of physical activity per week, including any walking involved to reach the college. Purposive sampling technique was used to select the subjects. Sportswomen from four colleges of the University – Gargi College for Women, Kamala Nehru College, Jesus and Mary College and Mata Sundri College - were contacted through the Director of Sports, University of Delhi. Initially, the sample consisted of 107 subjects, of which 17 girls dropped out. Finally, 90 subjects who gave their informed consent to participate, were recruited for detailed anthropometric, biochemical, dietary, lifestyle and BMD assessment. To formulate the control group, 117 girls were approached from a single college – Sur Homeopathic Medical College; 21 girls were eliminated since they did not provide consent. Hence, a sample of 96 controls underwent detailed assessment. The study protocol was approved by the Institutional Ethics Committee of the Institute of Nuclear Medicine and Allied Sciences (INMAS), New Delhi.
The sample size was calculated with an estimated difference of 5 per cent between the two groups at lumbar spine. Lumbar spine BMD of 25 controls was initially measured and based on an anticipated 5 per cent excess BMD in sportswomen we arrived at a sample size of 99 subjects in each group (80% power).
Under anthropometric assessment height and weight recordings were done on the same day on which BMD was measured. Height was recorded without shoes; using a wall stadiometer to the nearest 1 mm. Subjects were weighed using a clinical balance to the nearest 0.1 kg, wearing light clothing and without shoes. BMI was calculated as weight (in kg) / height (in m2). Every morning, the scale and stadiometer were calibrated with standard weight and height respectively. Subjects with systemic illness, symptoms of chronic hepatic or renal disorder, endocrine disorders and drugs affecting bone mineral health were excluded from the study.
Analytical methods: Blood samples were collected from subjects in the fasting state at 0800 h without venostasis under basal conditions for estimation of total serum calcium, serum ionic calcium phosphorus, total alkaline phosphatase (ALP), 25-hydroxyvitamin D (25-OHD) and immunoreactive parathyroid hormone (PTH). Serum was centrifuged at 4°C for 15 min at 1200 g and divided into five aliquots, which were refrigerated. Serum Ca, ionic Ca, P and ALP were estimated on the same day, and the remaining aliquots were stored at -20°C until PTH and 25(OH) D were estimated.
Serum Ca and P (Roche Diagnostics 902, Mannheim, Germany) were measured by colorimetric method (Hitachi, Automated Biochemistry Analyzer); ionic calcium by ion selective electrode method (Roche Diagnostics, AVL 9180 electrolyte analyzer) and ALP was measured by liquid kinetic method (Roche Diagnostics 902, Mannheim, Germany). PTH was assayed by electrochemiluminescence method (Elecsys 2010, Roche Diagnostics, Mannheim, Germany) and serum 25(OH)D was measured by radioimmunoassay (Diasorin, Stillwater, MN, USA).
The normal laboratory range for serum Ca was 2.20-2.55 mmol/l (8·8-10·2 mg/dl) and for serum P was 0.86-1.44 mmol/l (2·7-4·5 mg/dl), according to the kit manufacturers. The normal laboratory range for ionic calcium was 1.1-1.3 mmol/l and for serum alkaline phosphatase at 37°C was 100-275 IU/l in adults. The normal serum concentrations of 25(OH)D and PTH were 22.4-93.6 nmol/l (9.0-37.6 ng/ml) and (10-66 pg/ml), respectively. The lowest concentration of 25 (OHD) measurable by this kit, defined as the lowest quantity differentiated from zero at 2 standard deviations (SDs) below the mean counts per min of the zero standard, is 3.74 nmol/l. Vitamin D deficiency was classified based on the measurement of serum 25(OH)D concentration, as recommended by Lips17. Serum 25(OH)D concentrations of 25-50 nmol/l, 12.5-25.0 nmol/l, and less than 12.5 nmol/l were classified as mild, moderate, and severe hypovitaminosis D, respectively.
Dietary information was collected using well-established 24-h dietary recall. Dietary assessment of energy, protein, carbohydrate, total fat, dietary fibre, phytate, oxalate, calcium (dairy and non-dairy) and phosphorous was calculated using Nutritive Value of Indian Foods18. A self-designed and structured questionnaire was prepared by the investigator to elicit information regarding physical activity and lifestyle profile which included style of dress during college and practice hours, direct sunlight exposure, surface area of the body exposed to sunlight daily, time spent outdoors, time spent in sports practice sessions (outdoor), and sunscreen usage. Direct sunlight exposure was assessed by documenting average duration of exposure and percentage of the body exposed daily19.
The 24-h recall and questionnaire was pre-tested on five girls before finalization and administration.
Bone density expressed in g/cm2 at anteroposterior (AP) lumbar spine (L1-L4), femur (femoral neck) and forearm (total, ultra distal and 33% radius) was measured using the Prodigy Oracle (GE Lunar Corp., Madison, WI, USA) according to standard protocol. Quality control procedures were carried out in accordance with the manufacturer's recommendations. Instrument variation was determined regularly by a daily calibration procedure using a phantom supplied by the manufacturer and mean coefficient of variation was <0.5 per cent. As per the International Society for Clinical Densitometry (ISCD) recommendations20, short term precision study was performed by making duplicate measurements in 30 volunteers at each region of interest, repositioning the subject after each scan. The mean coefficients of variation were 0.62, 0.41, 0.65 per cent, and 0.84 per cent at femoral neck, total femur, lumbar spine, and 33 per cent radius, respectively.
Data analysis: Statistical analysis was carried out using STATA 9.0 (College Station, Texas, USA). Data were presented as mean ± SD/median (range) as appropriate. Anthropometric, dietary, biochemical and BMD parameters were compared between the groups using Student's t test or Wilcoxon rank sum test as appropriate. Analysis of covariance (ANCOVA) was used to compare the BMD values between the groups adjusting for anthropometric, dietary and biochemical parameters. The results were reported as adjusted mean (95% C.I.). P<0.05 was considered significant.
Results
Anthropometric and dietary parameters: There was no significant difference in the mean age, height, weight, BMI between the sportswomen and controls (Table I). The presence of underweight, overweight and obesity was 7.8, 6.6, and 3.3 per cent respectively, in sportswomen, whereas it was 16.7, 7.3 and 3.1 per cent in controls. All girls in both the groups reported normal menstruating pattern.
Table I.
Baseline characteristics, biochemical and dietary parameters of the sports girls and controls
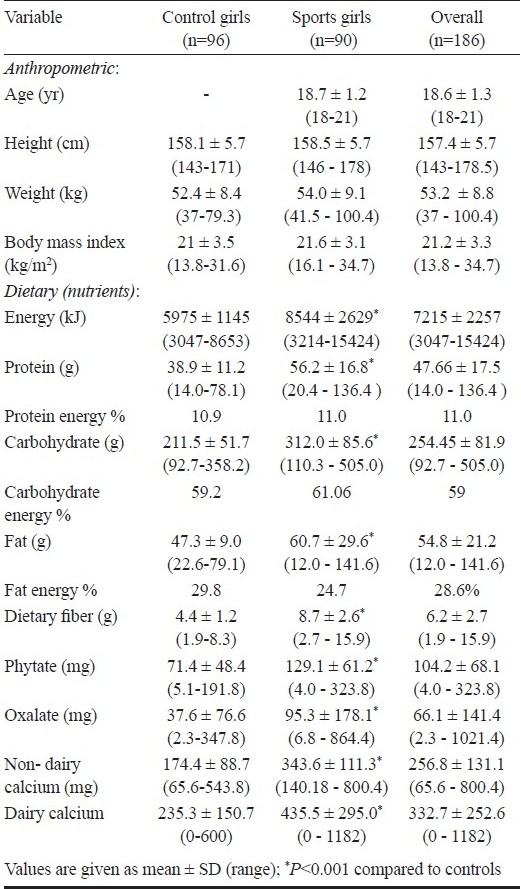
Diets of sportswomen showed significantly (P<0.001) higher intake of all nutrients i.e., macronutrients (energy, protein, fat, carbohydrate and fat) and other constituents (fibre, phytate and oxalate) compared to control (Table I). Forty seven per cent sportswomen met daily recommended dietary allowance (RDA) for energy as suggested by the Indian Council of Medical Research18 as compared to only 2.1 per cent controls. The percentage of energy contribution from protein, fat, and carbohydrate was within the reference range. Although the fat intake of sports girls was high, the per cent energy contribution from fat was less than that observed in controls (Table I). Mean total calcium intake of the control subjects (409.7 ± 172.5 mg/day) was significantly less than that of sportswomen (779.1 ± 324.5 mg/day, P<0.001). Seventy six per cent of sportswomen met the RDA for calcium in contrast to 1 per cent of control subjects. Also the mean dietary calcium intake of the controls was far less than the WHO (2004)21 and US (1997)22 recommendations which lie in the range of 600-1300 and 500-1300 mg/day, respectively. However, the mean intake of sportswomen was found to be within the international recommendations.
Physical activity and lifestyle parameters: Twenty five per cent of the sportswomen played volleyball, 18.7 per cent took part in athletics and 11 per cent of the subjects took part in hockey and football. Other sports played included athletics, aerobics and basketball, etc.
The sportswomen had participated in regular physical training sessions for last 3 to 4 yr prior to recruitment in the study. The selected sportswomen were involved in regimented sports practice for a mean of 3 h/day. In contrast, the control subjects followed a sedentary lifestyle and were not engaged in either leisure time physical activity or regular sports.
During college hours, sports subjects wore clothes wherein the body surface area exposure was limited to 15 per cent which increased to 45 per cent during practice sessions. However, the control subjects had maximum of 15 per cent body surface exposed throughout the day. A significant difference was seen in the duration of daily sun exposure between 0900-1600 h, (2 h for sportswomen and ½ h for control subjects). Around 60 per cent of sports subjects and 70 per cent of the controls did not use a sunscreen which may interfere with vitamin D synthesis.
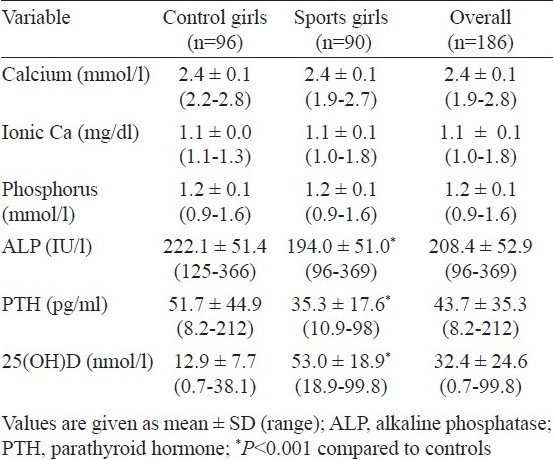
Biochemical and hormonal parameters: Serum 25(OH)D was significantly higher while PTH and ALP levels were significantly (P<0.001) lower in sports women when compared with age matched controls (Table II). No significant difference was noted in serum total calcium and ionic calcium between the two groups. Further 2 (2.2%) sportswomen and 89 (92.7%) controls had serum 25(OH)D concentration <9 ng/ml i.e. below the lower limit of the normal range recommended by the manufacturer. Normal, mild and moderate hypovitaminosis D was observed in 51.6, 45.1 and 3.3 per cent sportswomen, respectively. In contrast, none of the controls had a normal vitamin D while 17.3, 38.5 and 54.2 per cent had mild, moderate and severe hypovitaminosis D, respectively.
Table II.
Baseline biochemical and hormonal parameters of sports girls and controls
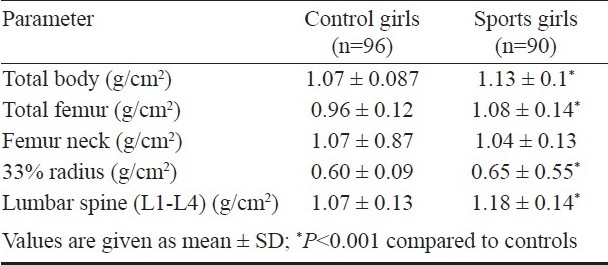
Bone mineral density (BMD) parameters: Total BMD as well as BMD at all skeletal sites except femur neck were significantly (P<0.001) higher in sports women in comparison to controls. BMD in sportswomen was higher than that in controls by 5, 13.1, 10.3 and 9.2 per cent at total body, total hip, lumbar spine and 33 per cent radius respectively. This difference persisted after adjustment for anthropometric, biochemical, hormonal and nutritional parameters at total hip and lumbar spine (Table IV). No significant association was found between BMD and either biochemical or hormonal parameters.
Table IV.
BMD parameters of the subjects after adjusting for height, weight, serum calcium, phosphorus, alkaline phosphatase, 25(OH)D, PTH and dietary intake of energy (total calories), protein and calcium
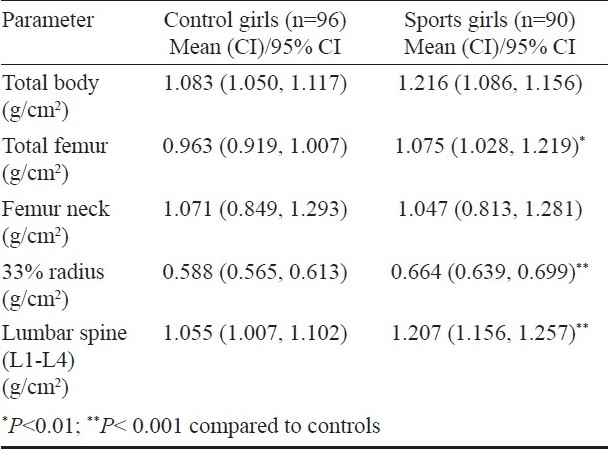
Table III.
Bone mineral density (BMD) parameters of the sports girls and controls
Discussion
Peak bone mass is a key determinant of skeletal health throughout life17. Approximately 60 per cent of the risk of osteoporosis can be explained by the amount of bone mineral achieved by early adulthood, and the subsequent bone loss accounts for the remaining risk. The attainment of peak bone mass is influenced by genetic and environmental factors5,6. In view of the fact that physical activity and nutrition are considered to be key determinants for acquisition of bone mass23, the effect of these two parameters on BMD was studied by selecting physically active sportswomen and sedentary controls from different colleges of Delhi.
Physical activity during the pubertal years has been shown to positively influence adult bone health24. Several reports suggest that regular physical activity contributes significantly to gain in BMD, beginning in the prepubertal years. The present study clearly highlights that sportswomen who have undergone at least three years of regular physical training, had significantly higher total BMD and BMD at femur, 33 per cent radius and lumbar (L1-L4) skeletal sites when compared to controls. This is consistent with results from both cross-sectional and short-term follow up studies in past, reporting higher BMD values of physically active gymnasts or sportswomen when compared to controls25,26. The higher 25(OH)D levels in sportswomen can be explained by the longer duration of sun exposure. While higher 25(OH)D levels over a period of time may contribute to the higher BMD in sportswomen, the present study did not show this and a few other cross-sectional studies have also not reported an association between 25(OH)D concentration and BMD27,28.
A significantly higher intake of energy and macronutrients was noted among the sportswomen when compared to controls. These findings are in agreement with other studies reporting nutrient intake in sportswomen as compared to their sedentary counterparts26,28. The higher protein intake of sportswomen as compared to controls may be a factor responsible for higher BMD in these subjects as also reported by other researchers29. Studies in various ethnic populations have observed a positive role of calcium in bone mass accrual and attainment of peak bone mass formation30,31. A higher daily calcium intake (both dairy and non-dairy) was noted in the diets of sportswomen in contrast to controls. The calcium intake of sportswomen was higher than the Indian RDA18 (500 mg/day) but less than the WHO21 (2004; 600-1300 mg/day) and U.S.22 (1997; 500-1300 mg/day) recommendations. Contrary to the findings of the present study, various authors have reported no significant differences in the mean daily calcium intakes among physically active women and controls26.
Some investigators have reported that physical activity is a more critical variable for attaining optimal BMD than dietary calcium intake13,23. However, the increased BMD of adult Hutterite women (a communal population involved in agriculture in America) which demonstrated a strong positive correlation between “current hours of feet” and “colony workload” with BMD, testifies to the important interaction between nutrition and physical activity for skeletal health32.
Ethnic and genetic factors are said to account for as much as 50-70 per cent of the variance in peak bone mass, with Asians having low peak bone mass as compared to Caucasians, while blacks having the highest bone mineral density33. Indians have also been reported to have low BMD compared to Caucasians34. Several reasons like short stature, high prevalence of hypovitaminosis D and traditional Indian vegetarian diets which are deficient in vitamin D and protein, may be responsible for lower BMD values reported in Indians.
In the current study, it was found that sportswomen not only had higher BMD than control subjects but also higher than other Indian34, Chinese, Japanese (data provided by the densitometer manufacturer) and US white Caucasian35 young adult populations. Interestingly, BMDs for the controls in the present study were also found to be higher than USA and Japanese subjects.
In conclusion, our results suggested that healthy Indian sportswomen with good nutrition, better bone biochemical parameters, adequate sun exposure and physical activity from younger age had higher BMD when compared to age matched sedentary controls. This suggests that consistent with other reports, lifestyle, physical activity and sun exposure are key determinants responsible for better bone mineral mass and serum vitamin D levels too36. Thus, it can be summarized that leading an active lifestyle which includes daily physical activity, leading to greater sun exposure along with good nutrition to attain peak bone mass.
Acknowledgments
The study was supported in part by research grants from the Institute of Nuclear Medicine and Allied Sciences (INMAS), New Delhi.
References
- 1.Kun Z, Greenfield H, Xueqin D, Fraser DR. Improvement of bone health in childhood and adolescence. Nutr Res Rev. 2000;14:119–52. doi: 10.1079/NRR200120. [DOI] [PubMed] [Google Scholar]
- 2.Matkovic V, Jelic T, Wardlaw GM, Ilich JZ, Goel PK, Wright JK, et al. Timing of peak bone mass in Caucasian females and its implication for the prevention of osteoporosis.Inference from a cross-sectional model. J Clin Invest. 1994;93:799–808. doi: 10.1172/JCI117034. [DOI] [PMC free article] [PubMed] [Google Scholar]
- 3.Kelly PJ, Morrison NA, Sambrook PN, Nguyen TV, Eisman JA. Genetic influences on bone turnover, bone density and fracture. Eur J Endocrinol. 1995;133:265–71. doi: 10.1530/eje.0.1330265. [DOI] [PubMed] [Google Scholar]
- 4.Ferrari S, Rizzoli R, Slosman D, Bonjour JP. Familial resemblance for bone mineral mass is expressed before puberty. J Clin Endocrinol. 1998;83:358–61. doi: 10.1210/jcem.83.2.4583. [DOI] [PubMed] [Google Scholar]
- 5.Heaney RP, Abrams S, Dawson-Hughes B, Looker A, Marcus R, Matkovic V, et al. Peak bone mass. Osteoporos Int. 2000;11:985–1009. doi: 10.1007/s001980070020. [DOI] [PubMed] [Google Scholar]
- 6.Saggese G, Baroncelli GI, Bertelloni S. Osteoporosis in children and adolescents: diagnosis, risk factors, and prevention. J Pediatr Endocrinol Metab. 2001;14:833–59. doi: 10.1515/jpem.2001.14.7.833. [DOI] [PubMed] [Google Scholar]
- 7.Cundy T, Cornish J, Evans MC, Gamble G, Stapleton J, Reid IR. Sources of interracial variation in bone mineral density. J Bone Miner Res. 1995;10:368–73. doi: 10.1002/jbmr.5650100306. [DOI] [PubMed] [Google Scholar]
- 8.Aloia JF, Vaswani A, Yeh JK, Flaster E. Risk for osteoporosis in black women. Calcif Tissue Int. 1996;59:415–23. doi: 10.1007/BF00369203. [DOI] [PubMed] [Google Scholar]
- 9.Bachrach LK, Hastie T, Wang MC, Narasimhan B, Marcus R. Bone mineral acquisition in healthy Asian, Hispanic, black and Caucasian youth: a longitudinal study. J Clin Endocrinol Metab. 1999;84:4702–12. doi: 10.1210/jcem.84.12.6182. [DOI] [PubMed] [Google Scholar]
- 10.Marwaha RK, Sripathy G. Vitamin D & bone mineral density of healthy school children in northern India. Indian J Med Res. 2008;127:239–44. [PubMed] [Google Scholar]
- 11.Rizzoli R. Nutrition: Its role in bone health. Best Pract Res Clin Endocrinol Metab. 2008;22:813–29. doi: 10.1016/j.beem.2008.08.005. [DOI] [PubMed] [Google Scholar]
- 12.Valimaki MJ, Karkkainen M, Lamberg-Allardt C, Laitinen K, Alhava E, Heikkinen J, et al. Exercise, smoking, and calcium intake during adolescence and early adulthood as determinants of peak bone mass.Cardiovascular Risk in Young Finns Study Group. BMD J. 1994;309:230–1. doi: 10.1136/bmj.309.6949.230. [DOI] [PMC free article] [PubMed] [Google Scholar]
- 13.Welten DC, Kemper HC, Post GB, Van Mechelen W, Twisk J, Lips P, et al. Weight-bearing activity during youth is a more important factor for peak bone mass than calcium intake. J Bone Miner Res. 1994;9:1089–96. doi: 10.1002/jbmr.5650090717. [DOI] [PubMed] [Google Scholar]
- 14.Bass S, Pearce G, Bradney M, Hendrick E, Delmas PD, Harding A, et al. Exercise before puberty may confer residual benefits in bone density in adulthood: studies in active prepubertal and retired female gymnasts. J Bone Miner Res. 1998;13:500–7. doi: 10.1359/jbmr.1998.13.3.500. [DOI] [PubMed] [Google Scholar]
- 15.Gustavsson A, Thorsen K, Nordstrom P. A 3-year longitudinal study of the effect of physical activity on the accrual of bone mineral density in healthy adolescent males. Calcif Tissue Int. 2003;73:108–14. doi: 10.1007/s00223-002-2026-1. [DOI] [PubMed] [Google Scholar]
- 16.Ginty F, Rennie KL, Mills L, Stear S, Jones S, Prentice A. Positive, site-specific associations between bone mineral status, fitness and time spent at high impact activities in 16–18 year-old boys. Bone. 2005;36:101–10. doi: 10.1016/j.bone.2004.10.001. [DOI] [PubMed] [Google Scholar]
- 17.Lips P. Vitamin D deficiency and secondary hyperparathyroidism in the elderly: consequences for bone loss and fractures and therapeutic implications. Endocr Rev. 2001;22:477–501. doi: 10.1210/edrv.22.4.0437. [DOI] [PubMed] [Google Scholar]
- 18.Nutrient requirements and recommended dietary allowances for Indians. New Delhi: ICMR; 1990. Indian Council of Medical Research (ICMR) [Google Scholar]
- 19.Tyler MB. Burn. In: Mann CV, Russel RCG, Williams NS, editors. Bailey and Love's short practice of surgery. 24th ed. London: Chapman and Hall; 2004. pp. 226–78. [Google Scholar]
- 20. [accessed on May 24, 2007]. Available from: http://www.iscd.org .
- 21.Human energy requirements. Report of a Joint FAO/WHO/UNU Expert Consultation, 17-24 October 2001. Rome, Italy: FAO; 2004. Oct 17-24, FAO. Food and Nutrition Technical Report Series. [Google Scholar]
- 22.Food and Nutrition Board. Institute of Medicine (IOM) Washington, DC: National Academy Press; 1997. Dietary reference intakes for calcium, magnesium, phosphorus and vitamin D, and fluoride. [Google Scholar]
- 23.Bonjour JP, Carrie AL, Ferrari S, Calvien H, Slosman D, Theintz G, et al. Calcium-enriched foods and bone mass growth in prepubertal girls: a randomized, double-blind, placebo-controlled trial. J Clin Invest. 1997;99:1287–94. doi: 10.1172/JCI119287. [DOI] [PMC free article] [PubMed] [Google Scholar]
- 24.Uusi-Rasi K, Sievanen H, Pasanen M, Oja P, Vuori I. Associations of calcium intake and physical activity with bone density and size in premenopausal and postmenopausal women: A peripheral quantitative computed tomography study. J Bone Miner Res. 2002;17:544–52. doi: 10.1359/jbmr.2002.17.3.544. [DOI] [PubMed] [Google Scholar]
- 25.Taaffe DR, Robinson TL, Snow CM, Marcus R. High-impact exercise promotes bone gain in well-trained female athletes. J Bone Miner Res. 1997;12:255–60. doi: 10.1359/jbmr.1997.12.2.255. [DOI] [PubMed] [Google Scholar]
- 26.Nurmi-Lawton JA, Baxter-Jones AD, Mirwald RL, Bishop JA, Taylor P, Cooper C, et al. Evidence of sustained skeletal benefits from impact-loading exercise in young females: a 3-year longitudinal study. J Bone Miner Res. 2004;19:314–22. doi: 10.1359/JBMR.0301222. [DOI] [PubMed] [Google Scholar]
- 27.Tandon N, Marwaha RK, Kalra S, Gupta N, Dudha A, Kochupillai N. Bone mineral parameters in healthy young Indian adults with optimal vitamin D availability. Natl Med J India. 2003;16:298–302. [PubMed] [Google Scholar]
- 28.Marwaha RK, Tandon N, Shivprasad C, Kanwar R, Mani K, Aggarwal R, et al. Peak bone mineral density of physically active healthy Indian men with adequate nutrition and no known current constraints to bone mineralization. J Clin Densitom. 2009;12:314–21. doi: 10.1016/j.jocd.2009.05.004. [DOI] [PubMed] [Google Scholar]
- 29.Bonjour JP. Dietary protein: an essential nutrient for bone health. J Am Coll Nutr. 2005;24(Suppl):526S–36S. doi: 10.1080/07315724.2005.10719501. [DOI] [PubMed] [Google Scholar]
- 30.Halioua L, Anderson JJ. Lifetime calcium intake and physical activity habits: independent and combined effects on the radial bone of healthy premenopausal Caucasian women. Am J Clin Nutr. 1989;49:534–41. doi: 10.1093/ajcn/49.3.534. [DOI] [PubMed] [Google Scholar]
- 31.Hirota T, Nara M, Ohguri M, Manago E, Hirota K. Effect of diet and lifestyle on bone mass in Asian young women. Am J Clin Nutr. 1992;55:1168–73. doi: 10.1093/ajcn/55.6.1168. [DOI] [PubMed] [Google Scholar]
- 32.Wosje KS, Binkley TL, Fahrenwald NL, Specker BL. High bone mass in a female Hutterite population. J Bone Miner Res. 2000;15:1429–36. doi: 10.1359/jbmr.2000.15.8.1429. [DOI] [PubMed] [Google Scholar]
- 33.Russell-Aulet M, Wang J, Thornton JC, Colt EW, Pierson RN., Jr Bone mineral density and mass in a cross-sectional study of white and Asian women. J Bone Miner Res. 1993;8:575–82. doi: 10.1002/jbmr.5650080508. [DOI] [PubMed] [Google Scholar]
- 34.Makker A, Mishra G, Singh BP, Tripathi A, Singh MM. Normative bone mineral density data at multiple skeletal sites in Indian subjects. Arch Osteoporos. 2008;3:25–37. [Google Scholar]
- 35.Mazess RB, Barden H. Bone density of the spine and femur in adult white females. Calcif Tissue Int. 1999;65:91–9. doi: 10.1007/s002239900663. [DOI] [PubMed] [Google Scholar]
- 36.Akiko H, Yuko M, Remi Y, Yoshiko O, Satoshi S, Tatsuhiko K, et al. The contribution of physical activity to bone mass density in Japanese young women. Med Sci Sports Exerc. 2005;37:S178. [Google Scholar]