

Abstract
Objective:
To compare the performance of waist circumference (WC) and waist-to-hip ratio (WHR) in predicting the presence of cardiovascular risk factors (hypertension and generalized obesity) in an apparently healthy population.
Materials and Methods:
We recruited 898 apparently healthy subjects (318 males and 580 females) of the Igbo ethnic group resident in Enugu (urban), Southeast Nigeria. Data collection was done using the World Health Organization Stepwise approach to Surveillance of risk factors (STEPS) instrument. Subjects had their weight, height, waist and hip circumferences, systolic and diastolic blood pressures measured according to the guidelines in the step 2 of STEPS instrument. Generalized obesity and hypertension were defined using body mass index (BMI) and JNC 7 classifications, respectively. Quantitative and qualitative variables were analyzed using t-test and Chi-square analysis, respectively, while the performance of WC and WHR was compared using the Receiver Operating Characteristic (ROC) analysis. P value was set at <0.05.
Results:
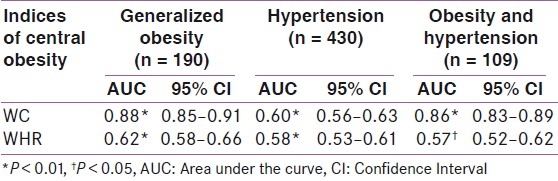
The mean age of the subjects was 48.7 (12.9) years. Central obesity was found in 76.9% and 66.5% of subjects using WHR and WC, respectively. WC had a significantly higher area under the curve (AUC) than WHR in all the cardiovascular risk groups, namely, generalized obesity (AUC = 0.88 vs. 0.62), hypertension alone (AUC = 0.60 vs. 0.53), and both generalized obesity and hypertension (AUC = 0.86 vs. 0.57).
Conclusion:
WC performed better than WHR in predicting the presence of cardiovascular risk factors. Being a simple index, it can easily be measured in routine clinic settings without the need for calculations or use of cumbersome techniques.
Keywords: Cardiovascular risk factors, central obesity, Nigerians, Receiver Operating Characteristic, waist circumference
INTRODUCTION
Obesity is a worldwide epidemic characterized by excess adipose tissue. The prevalence of obesity is on the increase globally, both in developed and developing nations. In the United States, it is estimated that approximately 64.5% of adults can be classified as overweight or obese individuals.[1] In addition to the morbidity associated with obesity, approximately 325,000 deaths in the United States each year among nonsmokers are attributable to obesity.[2] Bakari et al.[3] evaluated obesity rates using body mass index (BMI) and waist-to-hip ratio (WHR) among type 2 diabetic Hausa-Fulanis. Among this group, 35% and 5% were overweight and obese, respectively, whereas 95% had central obesity when gender-specific WHR was used. Similarly, Ofoegbu et al.,[4] in a study on type 2 diabetic patients in Enugu, Southeast Nigeria, reported central obesity [determined by waist circumference (WC)] in 22.8% of the subjects studied. The use of different indices to determine or measure obesity clearly explains why the prevalence rates of obesity differ globally. Among 6208 type 2 diabetic subjects seen in India, over 50% were found to be overweight or obese when BMI of >25 kg/m2 was used, whereas 59.66% and 95.57% of men and women, respectively, had central obesity when gender-specific WHR cut-off points of >0.95 and >0.85, respectively, were used.[5]
Insulin resistance with compensatory hyperinsulinemia has been suggested to underlie the clustering of cardiovascular risk factors, including glucose intolerance, hypertension, elevated serum triglycerides, low serum high density lipoprotein cholesterol and central obesity.[6] Central obesity has been shown to worsen the degree of insulin resistance. In the EarlyBird Study,[7] WC correlated significantly with HOMA-IR in both genders, while BMI correlated significantly with HOMA-IR in girls only. Similarly, WC seems to be particularly associated with the risk for non-communicable diseases as shown by many other studies.[8–10] Recently, the International Diabetes Federation (IDF) proposed the use of ethnic-specific cut-off values for WC, having made it a compulsory criterion in its definition of the metabolic syndrome.[11]
Several indices such as WC, WHR, waist to height ratio (WHtR) and sagittal abdominal diameter (SAD) have been used as clinical measures of central obesity.[12,13] Magnetic resonance imaging (MRI) and computed tomography (CT) are however considered the gold standard methods for determining the quantity of subcutaneous abdominal adipose tissue (SAAT) and intra-abdominal adipose tissue (IAAT).[14] This gold standard, however, cannot be routinely used in a clinic setting to measure these indices. This therefore highlights the need for developing surrogate clinical measures like WC and WHR. WC is a simple and valid measure that may be used independently as an estimate of abdominal fat and it has been found to be more strongly associated with cardiovascular health risk.[13,15]
In this study, we compared the performances of two measures of central obesity, namely, WC and WHR, in predicting the presence of cardiovascular risk markers in an apparently healthy Nigerian population.
MATERIALS AND METHODS
This study was a cross-sectional descriptive survey of the inhabitants of Enugu (urban). Enugu has been a capital city for long. It was formerly the capital of the former eastern Nigeria and is currently the capital city of Enugu State.. The state is one of the five states in the southeast geopolitical zone of Nigeria. It is geographically located between longitude 7°26” E and 7°30” E and latitude 6°25” N and 6°28” N. Enugu city is predominantly an urban Christian community with a population of 722,664 people out of the total population of 3,257,298 for the whole state (2006 population census figure).[16] It is located within the tropical rain forest region of Nigeria. Its work force consists mainly of civil servants, business men, industrialists, farmers and students. The town is richly endowed with large deposits of coal which served as a major revenue source for Nigeria before the era of oil boom.
Ethical clearance for the study was obtained from the Ethics Committee of the University of Nigeria Teaching Hospital (UNTH), and consent was obtained from all the participants.
Materials
The subjects comprised apparently healthy individuals (not known hypertensive or diabetic patients) who were residents of Enugu (urban). A total of 1000 subjects aged 18–70 years and who were of the Igbo tribe were recruited through a multi-stage sampling procedure. Subjects who were physically challenged (either wheelchair bound or unable to stand) and female subjects who were pregnant, based on their date of last menstrual period, were excluded.
In stage one, five areas of the town, namely, Emene, Abakpa, Trans-Ekulu, Asata and Ogui layout, were selected by simple random sampling (using the balloting technique). In the second stage, 200 participants were selected from among those who reported and got registered on the day of recruitment in each of the five areas. This was also done by simple random sampling using a table of random numbers. These subjects were invited for registration following health awareness campaigns executed in some of the churches within the five selected areas. All the subjects selected were then interviewed by trained medical personnel. Those who were not selected were not interviewed but had their anthropometric indices measured and medical advice given based on the individual's cardiovascular risk status. A total of 898 subjects (318 males and 580 females) were used for analysis after cleaning up of the data.
Data collection and physical measurements were based on World Health Organization (WHO)'s STEPS instrument.[17] STEPS is an acronym for the WHO Stepwise approach to Surveillance of risk factors. It is a simple, standardized method for collecting and analyzing data for chronic disease risk factors in WHO member countries. It involves a sequential process which starts with gathering information on key behavioural risk factors (Step 1) and then moving to simple physical measurements (Step 2). The physical measurements undertaken included height (measured to the nearest 0.1 cm), weight (recorded to the nearest 0.1 kg), WC and hip circumference (recorded to the nearest 0.1 cm) using non-stretching flexible linear tapes, and blood pressure (recorded to the nearest whole number in mmHg) using mercury sphygmomanometers (Accosons, Essex, England).
The landmark for the measurement of WC was the midpoint between the lowest rib and the iliac crest, as recommended by WHO.[17] Measurement was done at the end of expiration, with the arms by the side and patient standing with the feet together. Hip circumference was measured at the maximum circumference of the buttocks. Both WC and hip circumference were measured in privacy with the subject in light clothing. Subject's height and weight were measured without headgears and footwears. Blood pressure was measured with the subject in the sitting position. The 1st and 5th korotkoff sounds were used to mark the systolic blood pressure (SBP) and diastolic blood pressure (DBP) respectively. Average of two readings of SBP and DBP was used.
Definition of risk factors
Generalized obesity was defined as BMI ≥30 kg/m2,[18] while central obesity was defined according to the International Diabetes Federation (IDF) ethnic-specific criteria[11] as WC ≥94 cm and ≥80 cm for males and females, respectively. Blood pressure was classified using the JNC 7 classification.[19] Risk category was defined using the hypertensive category (SBP ≥ 140 mmHg and/or DBP ≥90 mmHg). Hypertension and generalized obesity were predicted as cardiovascular risk factors.[20]
Statistical analyses
Comparison of means between two groups was done using the independent t-test while test of association/independence between categorical variables was performed using Chi-square test of independence. The Receiver Operating Characteristic (ROC) analysis was used to compare the performance of WC and WHR (measures of central obesity) as determined by the area under the curve (AUC).[21] Data analysis was conducted using Statistical Package for Social Sciences for windows (SPSS) version 10 (Chicago, IL, USA).
RESULTS
The general characteristics of the 898 subjects are shown in Table 1. Males were older than females and had higher WHR and DBP, whereas females had higher WC, BMI and SBP. The gender differences observed in all the variables except for SBP and DBP were significant [Table 1].
Table 1.
General characteristics of the subjects
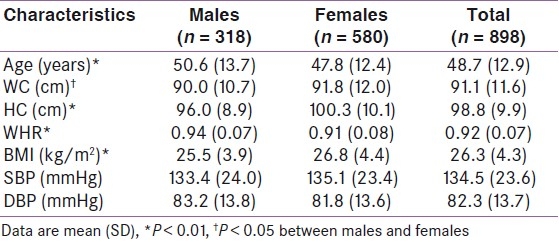
Central obesity was more prevalent when WHR (76.9%) was used than when WC (66.5%) was used. Chi-square analysis showed that central obesity determined using both WHR (χ2 (1) = 5.15; P < 0.05) and WC (χ2 (1) = 185.6; P < 0.01) was associated with gender, with obesity being commoner in the females. Generalized obesity was found in 190 (21.2%) subjects, while 339 (37.8%) were overweight [Figure 1]. Six (0.7%) persons were undernourished (BMI < 18.5 kg/m2). The rest comprising 363 subjects had normal BMI.
Figure 1.
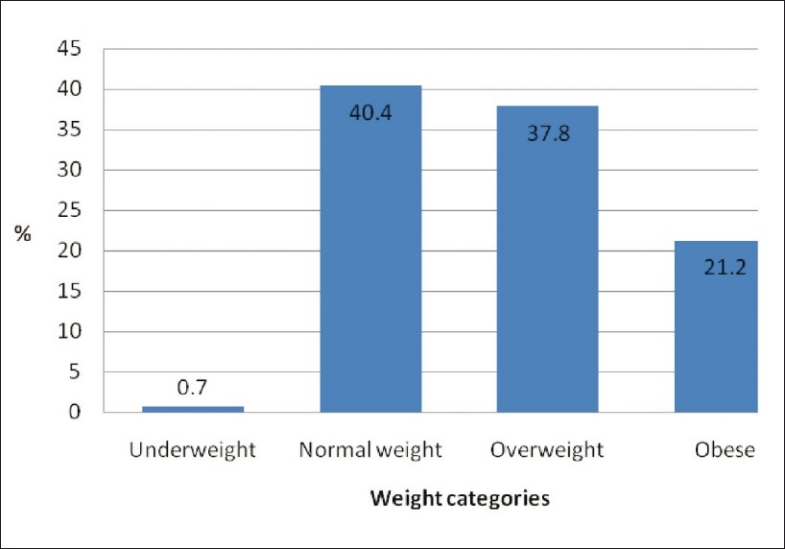
Weight categorization among the subjects according to body mass index
Using the JNC 7 classification, 430 (47.9%), 324 (36.1%) and 144 (16%) subjects were classified as having hypertension, pre-hypertension and normal blood pressure, respectively. Greater proportion (42.7%) of individuals had hypertension when SBP was used alone compared to 30.8% when DBP was used (χ2 (1) = 9.2; P = 0.0024).
Performance of the indices of central obesity
The AUC showing the performances of WC and WHR in predicting the presence of cardiovascular risk (generalized obesity, hypertension and both obesity and hypertension) is shown in Figures 2–4, respectively. The AUC were significant compared to null hypothesis true area of 0.5.
Figure 2.
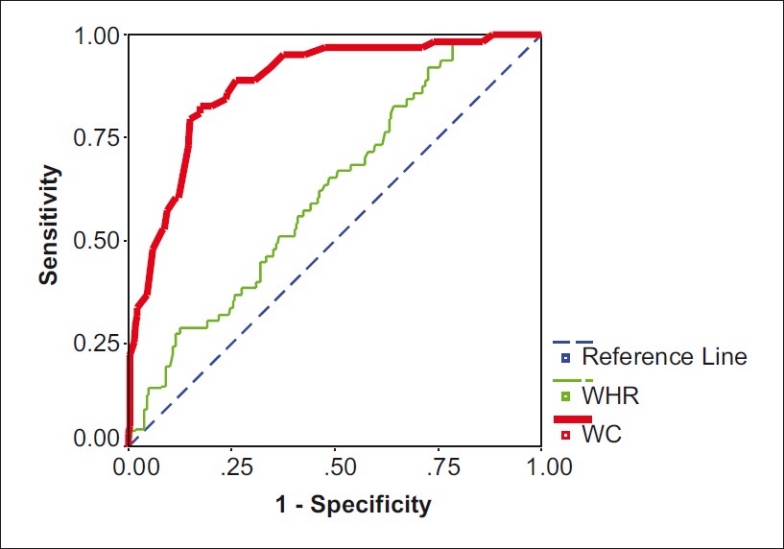
Receiver Operating Characteristic curve for waist circumference and waist-to-hip ratio for generalized obesity
Figure 4.
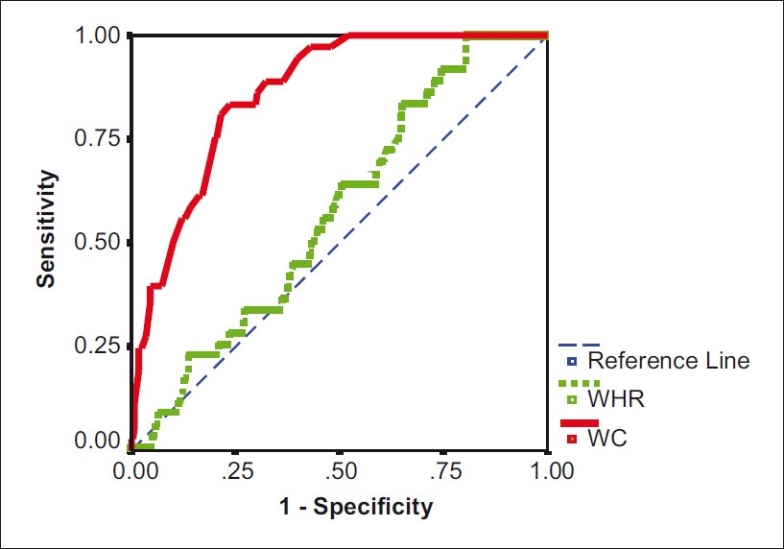
Receiver Operating Characteristic curve for waist circumference and waist-to-hip ratio for obesity and hypertension
Figure 3.
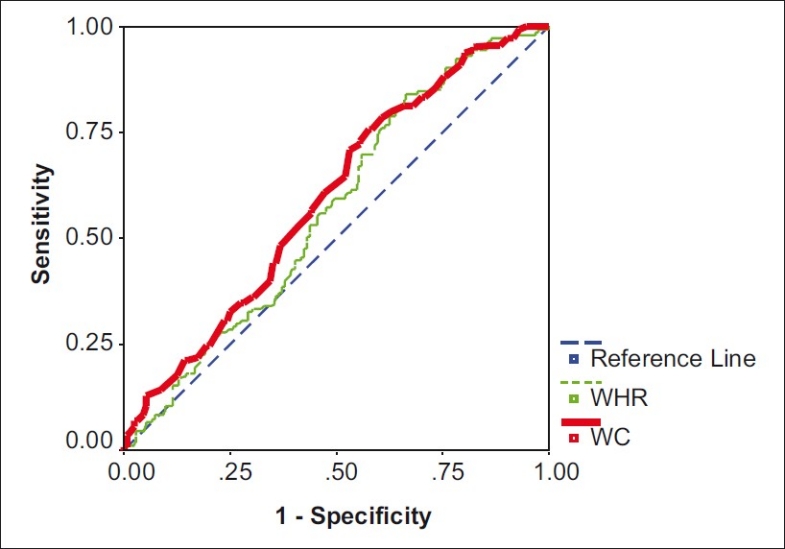
Receiver Operating Characteristic curve for waist circumference and waist-to-hip ratio for hypertension
The values of the AUC for each of the indices for generalized obesity, hypertension and hypertension/obesity are summarized in Table 2. Based on its higher AUC, WC performed better than WHR in predicting all the various cardiovascular risk factors.
Table 2.
Areas under the curve for predicting the presence of obesity, hypertension, and obesity/hypertension
DISCUSSION
In this study, the performances of WC and WHR were compared using ROC analysis. ROC curves are frequently used in several medical disciplines such as biomedical informatics, clinical chemistry and radiology.[21] The ROC curve plots sensitivity versus (1 – specificity) of a test as the threshold varies over its entire range. Each data point on the plot represents a particular setting of the threshold, and each threshold setting defines a particular set of true-positive (TP), false-positive (FP), true-negative (TN) and false-negative (FN) frequencies, and consequently a particular pair of sensitivity and (1 – specificity) values.[22] It was originally developed for radar applications in the 1940s, but ROC analysis became widely used in medical diagnostics, where complex and weak signals needed to be distinguished from a noisy background.[23] The area under an ROC curve is equal to the probability that a randomly selected positive case will receive a higher score than a randomly selected negative case. ROC curves can be interpreted either graphically or numerically. The ROC curve area is a good summary measure of test accuracy because it does not depend on the prevalence of disease or the cut points used to derive the curve. It is however suggested that once a test has been able to classify patients as either having a disease or not, the performance of the test for particular uses such as diagnosis or screening needs to be evaluated. As regards its use when comparing the accuracies of two tests as in this study, caution should be exercised as the ROC curve area may be misleading if the curves cross each other.[24,25] In such a case, some considerations are required before arriving at any conclusion.
This study revealed that WC had higher AUCs compared to WHR in subjects who were classified as having generalized obesity alone, hypertension alone or both. The higher AUCs therefore suggest that WC may be more useful and reliable than WHR in predicting the presence of generalized obesity and hypertension or cardiovascular risk. In a similar study by Pouliot et al.,[13] sagittal abdominal diameter (SAD) was identified to be better than other clinical measures or determinants of abdominal obesity. However, SAD is technically more difficult and more time consuming to measure. WC among the various measures of central adiposity is very easy to measure and perhaps more time saving in a routine clinic setting. It is neither cumbersome at all compared to the gold standards (CT, MRI) nor labourious requiring further measurements and calculations. The simplicity of its measurement and its relation to both body weight and fat distribution as a major advantage over BMI and waist-to-hip circumference ratio was highlighted by Lean et al.[15] Studies have shown that anthropometric measures, such as BMI, WHR, and WC cut-off levels, are not comparable across different racial populations.[11,26] Apart from the fact that WC is a good indicator of both the degree of obesity and the accumulation of visceral adipose tissue, the threshold values of WC corresponding to critical amounts of visceral adipose tissue do not appear to be influenced by sex or by the degree of obesity.[13,27] Taylor et al.,[28] in a screening for regional fat distribution among adult women, found that WC significantly classified the subjects better than WHR. Al-Sendi et al.[29] also reported that WC is useful in identifying children (12–17 years of age) at risk of developing hypertension. Among 768 middle-aged men from the Olivetti Heart Study, WC was the strongest predictor of blood pressure, and also was related to heart rate, insulin concentrations, and insulin sensitivity.[30] In this study, the AUCs for both WC and WHR for the subjects who had only hypertension were smaller when compared to those represented by obesity alone and by both obesity and hypertension. This can be explained by the fact that BMI is better related to body fat than hypertension though they can cluster in a single individual. This association is evidenced by the degree of relationships shown by the correlation coefficients (not shown in the results). Though the AUCs were smaller in the hypertension group, WC still performed better than WHR in this group.
With respect to gender comparisons, females had a higher mean WC and BMI values, whereas the reverse was the case for WHR. The presence of larger hip circumference in females is a likely explanation for this. This pattern had earlier been observed among diabetic patients in the same ethnic region of Nigeria and in Cuban female scholars.[4,31] Hormonal differences particularly involving the adrenal and sex steroids have also been noted to influence body fat distribution.[32–34] These gender patterns also appear to be established in childhood, especially with pubertal development.[35] Though the role of obesity as a health hazard in adults has been well recognized, its presence in adolescence has been associated with obesity in adulthood, thus emphasizing the importance of early detection and intervention directed at its treatment to avert the long-term consequences of obesity and development of cardiovascular diseases.[36]
Adipose tissue is mostly distributed as subcutaneous fat (≈85% of total adipose tissue mass) and then a smaller amount as intra-abdominal fat (≈15%) in lean and obese persons.[37] The relative contribution of intra-abdominal fat mass to total body fat is influenced by sex, age, race-ethnicity, physical activity, and total adiposity. The term “visceral fat” is commonly used to describe intra-abdominal fat, and intra-abdominal fat is made up of both intraperitoneal fat (mesenteric and omental fat), directly draining into the portal circulation, and retroperitoneal fat, draining into the systemic circulation. Currently, there is no universally accepted site for measuring intra-abdominal (IAAT) and subcutaneous adipose (SAAT) tissue distributions. This remains a source of variation in data obtained from different studies and needs to be harmonized for effective comparison of data. Abdominal circumference as measured by WC, actually measures the fat contributed by subcutaneous tissue which is under the skin of the abdomen and that deposited intra-abdominally. Both SAAT and IAAT have been found to correlate with insulin resistance.[38]
Despite the obvious strengths of WC over WHR and BMI, it is to be noted that adoption of different landmarks for its measurement may pose some limitations on the comparison of WC data generated from different studies.[39] Though some studies on WC involving subjects of African descent have been reported, characterization of WC among African populations still appears to be deficient, especially as it relates to diagnostic indices and threshold values.[11,40]
CONCLUSION
WC provides a unique indicator of body fat distribution, which can identify patients who are at increased risk of central obesity-related cardiometabolic disease, above and beyond the measurement of BMI. From this study, WC is more useful than WHR in predicting the presence of cardiovascular risk factors. Being a simpler index to measure, less time consuming and devoid of any calculations, we propose that clinicians will find WC a reliable means of assessing individuals’ cardiovascular risk status especially in a busy routine clinic setting.
Footnotes
Source of Support: Nil
Conflict of Interest: None declared.
REFERENCES
- 1.Flegal KM, Carroll MD, Ogden CL, Johnson CL. Prevalence and trends in obesity among US adults, 1999-2000. JAMA. 2002;288:1723–7. doi: 10.1001/jama.288.14.1723. [DOI] [PubMed] [Google Scholar]
- 2.Allison DB, Fontaine KR, Manson JE, Stevens J, Vanitallie TB. Annual deaths attributable to obesity in the United States. JAMA. 1999;282:1530–8. doi: 10.1001/jama.282.16.1530. [DOI] [PubMed] [Google Scholar]
- 3.Bakari AG, Onyemelukwe GC. Indices of obesity among type 2 diabetic Hausa-Fulani Nigerians. Int J Diabetes Metab. 2005;13:28–9. [Google Scholar]
- 4.Ofoegbu EN, Igweh JC, Ucheya RE. Anthropometrics, awareness, prevalence and pattern of obesity in Nigerian type 2 diabetic patients. J Exp Clin Anat. 2005;4:24–8. [Google Scholar]
- 5.Agrawal RP, Sharma S, Sharma S, Mathur KC, Kochar DK, Panwar RB. Pattern of obesity and abdominal adiposity in North West India. Int J Diabetes Dev Ctries. 2004;24:79–83. [Google Scholar]
- 6.Reaven GM. Banting lecture 1988: Role of insulin resistance in human disease. Diabetes. 1988;37:1595–607. doi: 10.2337/diab.37.12.1595. [DOI] [PubMed] [Google Scholar]
- 7.Murphy MJ, Metcalf BS, Voss LD, Jeffery AN, Kirkby J, Mallam KM, et al. Girls at five are intrinsically more insulin resistant than boys: The programming hypotheses revisited-The EarlyBird Study (EarlyBird 6) Pediatrics. 2004;113:82–6. doi: 10.1542/peds.113.1.82. [DOI] [PubMed] [Google Scholar]
- 8.Kruger HS, Venter CS, Vorster HH. Obesity in African women in the North West Province, South Africa is associated with an increased risk of Non-Communicable Diseases: The THUSA Study. Br J Nutr. 2001;86:733–40. doi: 10.1079/bjn2001469. [DOI] [PubMed] [Google Scholar]
- 9.Siani A, Cappuccio FP, Barba G, Trevisan M, Farinaro E, Lacone R, et al. The relationship of waist circumference to blood pressure: The Olivetti Heart Study. Am J Hypertens. 2002;15:780–6. doi: 10.1016/s0895-7061(02)02976-x. [DOI] [PubMed] [Google Scholar]
- 10.Zhu S, Wang Z, Heshka S, Heo M, Faith MS, Heymsfield SB. Waist circumference and obesity-associated risk factors among whites in the third National Health and Nutrition Examination Survey: Clinical action thresholds. Am J Clin Nutr. 2002;76:743–9. doi: 10.1093/ajcn/76.4.743. [DOI] [PubMed] [Google Scholar]
- 11.The IDF Backgrounder 1. Brussels: IDF; 2005. [Last accessed in 2005 May]. International Diabetes Federation. The IDF Consensus Worldwide Definition of the Metabolic Syndrome. Available from: http://www.idf.org/webdata/docs/idf_metasyndrome_definition.pdf . [Google Scholar]
- 12.Sayeed MA, Mahtab H, Latif ZA, Khanam PA, Ahsan KA, Banu A, et al. Waist-To-Height ratio: A better obesity index than body mass index and waist to hip ratio for predicting diabetes, Hypertension and lipidaemia. Bangladesh Med Res Counc Bull. 2003;29:1–10. [PubMed] [Google Scholar]
- 13.Pouliot MC, Despres JP, Lemieux S, Moorjani S, Bouchard C, Tremblay A, et al. Waist circumference and abdominal sagittal diameter: Best simple anthropometric indexes of abdominal visceral adipose tissue accumulation and related cardiovascular risk in men and women. Am J Cardiol. 1994;73:460–8. doi: 10.1016/0002-9149(94)90676-9. [DOI] [PubMed] [Google Scholar]
- 14.Shen W, Wang Z, Punyanita M, Lei J, Sinav A, Kral JG, et al. Adipose tissue quantification by imaging methods: A proposed classification. Obes Res. 2003;11:5–16. doi: 10.1038/oby.2003.3. [DOI] [PMC free article] [PubMed] [Google Scholar]
- 15.Lean ME, Han TS, Morrison CE. Waist Circumference as a measure for indicating need for weight management. BMJ. 1995;311:158–61. doi: 10.1136/bmj.311.6998.158. [DOI] [PMC free article] [PubMed] [Google Scholar]
- 16.Vol. 94. Federal Republic of Nigeria, Lagos: Official Gazette; 2007. Legal notice on publication of the details of the breakdown of the national and state provisional totals 2006 census; pp. 175–98. [Google Scholar]
- 17.20 Avenue Appia, 1211 Geneva 27, Switzerland: World Health Organization; [Last accessed on 2006 Apr 1]. World Health Organization. WHO STEP wise approach to chronic disease risk factor surveillance- Instrument v2.0. Department of Chronic Diseases and Health Promotion. Available from: http://www.who.int/chp/steps . [Google Scholar]
- 18.Grundy SM, Cleeman JI, Daniels SR, Donato KA, Eckel RH, Franklin BA, et al. Diagnosis and management of the metabolic syndrome.An American Heart Association / National Heart, Lung, and Blood Institute Scientific Statement. Circulation. 2005;112:2735–52. doi: 10.1161/CIRCULATIONAHA.105.169404. [DOI] [PubMed] [Google Scholar]
- 19.Chobanian AV, Bakris G, Black HR, Cushman C, Green LA, Izzo A, Jr, et al. National High Blood Pressure Education program coordinating committee. Seventh report of the joint national committee on prevention, detection, evaluation and treatment of high blood pressur. Hypertension. 2003;42:1206–52. doi: 10.1161/01.HYP.0000107251.49515.c2. [DOI] [PubMed] [Google Scholar]
- 20.Ardern CI, Janssen I, Ross R, Katzmarzyk PT. Development of health-related waist circumference thresholds within BMI categories. Obes Res. 2004;12:1094–103. doi: 10.1038/oby.2004.137. [DOI] [PubMed] [Google Scholar]
- 21.Zweig M, Campbell G. Receiver-Operating Characteristic (ROC) Plots: A fundamental evaluation tool in clinical medicine. Clin Chem. 1993;39:561–77. [PubMed] [Google Scholar]
- 22.Lasko TA, Bhagwat JG, Zou KH, Ohno-Machado L. The use of receiver operating characteristic curves in biomedical informatics. J Biomed Inform. 2005;38:404–15. doi: 10.1016/j.jbi.2005.02.008. [DOI] [PubMed] [Google Scholar]
- 23.Lusted LB. Signal detectability and medical decision making. Science. 1971;171:1217–9. doi: 10.1126/science.171.3977.1217. [DOI] [PubMed] [Google Scholar]
- 24.Obuchowski NA. Receiver operating characteristic curves and their use in radiology. Radiology. 2003;229:3–8. doi: 10.1148/radiol.2291010898. [DOI] [PubMed] [Google Scholar]
- 25.Metz CE. Receiver operating characteristic analysis: A tool for the quantitative evaluation of observer performance and imaging systems. J Am Coll Radiol. 2006;3:413–22. doi: 10.1016/j.jacr.2006.02.021. [DOI] [PubMed] [Google Scholar]
- 26.McKeigue PM, Pierpont T, Ferrie JE, Marmot MG. Relationship of glucose intolerance to body fat pattern in South Asians and Europeans. Diabetologia. 1992;35:785–91. doi: 10.1007/BF00429101. [DOI] [PubMed] [Google Scholar]
- 27.Lemieux S, Prudhomme D, Bouchard C, Tremblay A, Despreas JP. A single threshold value of waist girth identifies normal-weight and overweight subjects with excess visceral adipose tissue. Am J Clin Nutr. 1996;64:685–93. doi: 10.1093/ajcn/64.5.685. [DOI] [PubMed] [Google Scholar]
- 28.Taylor RW, Keil D, Gold EJ, Williams SM, Goulding A. Body mass index, waist girth, and waist-to-hip ratio as indexes of total and regional adiposity in women: Evaluation using receiver operating characteristic curves. Am J Clin Nutr. 1998;67:44–9. doi: 10.1093/ajcn/67.1.44. [DOI] [PubMed] [Google Scholar]
- 29.Al-Sendi AM, Shetty P, Musaiger AO, Myatt M. Relationship between body composition and blood pressure in Bahraini adolescents. Br J Nutr. 2003;90:837–44. doi: 10.1079/bjn2003963. [DOI] [PubMed] [Google Scholar]
- 30.Siani A, Cappuccio FP, Barba G, Trevisan M, Farinaro E, Lacone R, et al. The relationship of waist circumference to blood pressure: The Olivetti Heart Study. Am J Hypertens. 2002;15:780–6. doi: 10.1016/s0895-7061(02)02976-x. [DOI] [PubMed] [Google Scholar]
- 31.Martinez E, Devesa M, Bacallao J, Amador M. Percentiles of the waist-hip ratio in Cuban scholars aged 4.5 to 20.5 years. Int J Obes Relat Metab Disord. 1994;18:557–60. [PubMed] [Google Scholar]
- 32.Rask E, Walker BR, Söderberg S, Livingstone DE, Eliasson M, Johnson O, et al. Tissue-specific changes in peripheral cortisol metabolism in obese women: Increased adipose 11b-hydroxysteroid dehydrogenase type 1 activity. J Clin Endocrinol Metab. 2002;87:3330–6. doi: 10.1210/jcem.87.7.8661. [DOI] [PubMed] [Google Scholar]
- 33.Oltmanns KM, Dodt B, Schultes B, Raspe HH, Schweiger U, Born J, et al. Cortisol correlates with metabolic disturbances in a population study of type 2 diabetic patients. Eur J Endocrinol. 2006;154:325–31. doi: 10.1530/eje.1.02074. [DOI] [PubMed] [Google Scholar]
- 34.Rosmond R, Dallman MF, Björntorp P. Stress-related cortisol secretion in men: Relationships with abdominal obesity and endocrine, metabolic and hemodynamic abnormalities. J Clin Endocrinol Metab. 1998;83:1853–9. doi: 10.1210/jcem.83.6.4843. [DOI] [PubMed] [Google Scholar]
- 35.Moreno LA, Fleta J, Mur L, Rodriguez G, Sarria A, Bueno M. Waist circumference values in Spanish children – Gender related differences. Eur J Clin Nutr. 1999;53:429–33. doi: 10.1038/sj.ejcn.1600769. [DOI] [PubMed] [Google Scholar]
- 36.Plourde G. Impact of obesity on glucose and lipid profiles in adolescents at different age groups in relation to adulthood. BMC Fam Pract. 2002;3:18–31. doi: 10.1186/1471-2296-3-18. [DOI] [PMC free article] [PubMed] [Google Scholar]
- 37.Abate N, Garg A, Peshock RM, Stray-Gundersen J, Grundy SM. Relationships of generalized and regional adiposity to insulin sensitivity in men. J Clin Invest. 1995;96:88–98. doi: 10.1172/JCI118083. [DOI] [PMC free article] [PubMed] [Google Scholar]
- 38.Tulloch-Reid MK, Hanson RL, Sebring NJ, Reynolds JC, Premkumar A, Genovese DJ, et al. Both subcutaneous and visceral adipose tissue correlate highly with insulin resistance in African-Americans. Obes Res. 2004;12:1352–9. doi: 10.1038/oby.2004.170. [DOI] [PubMed] [Google Scholar]
- 39.Wang J, Thornton JC, Bari S, Williamson B, Gallagher D, Heymsfield SB, et al. Comparisons of waist circumferences measured at 4 sites. Am J Clin Nutr. 2003;77:379–84. doi: 10.1093/ajcn/77.2.379. [DOI] [PubMed] [Google Scholar]
- 40.Alberti KG, Zimmet P, Shaw J. IDF Epidemiology Task Force Consensus Group.The metabolic syndrome-A new worldwide definition. Lancet. 2005;366:1059–62. doi: 10.1016/S0140-6736(05)67402-8. [DOI] [PubMed] [Google Scholar]