

Abstract
Objective
We test whether a disparity by socioeconomic status (SES) (represented by educational attainment) in overweight has emerged among men or women during a recent 17 year period in China.
Methods
Data from the China Health and Nutrition Survey (CHNS), a panel study including 7,314 women and 6,492 men, are used to longitudinally track the BMI and odds of overweight by educational attainment among Chinese adults (baseline age 18–50) from 1989 to 2006 to determine whether individuals of low (<primary school) versus high (>secondary school) educational attainment experienced a disproportionately faster increase in BMI or odds of overweight (BMI≥25) over time. The unadjusted mean BMI and prevalence of overweight by education are presented. Sex-stratified, random-effects models are used to estimate the associations and interactions by birth cohort are included.
Findings
Overweight prevalence has doubled for women and tripled for men. Among women in 1989, the odds of overweight was not different for those of high versus low educational attainment; however, by 2006, odds of overweight were significantly lower for those with the highest education in both the younger (OR= 0.22; CI 0.11, 0.42) and older (OR=0.27; CI 0.10, 0.72) birth cohorts. The reverse trend is seen for men, who also begin with no difference in odds of overweight by SES, but by 2006, the odds ratio for the highest versus lowest education group was OR 3.4 (CI 1.82, 6.18).
Conclusions
Over 17 years, low SES has become associated with higher BMI and odds of overweight among Chinese women, while high SES remains a risk factor for overweight among Chinese men.
Keywords: Overweight, Obese, Health Status Disparities, Socioeconomic Factors, Developing Countries, China, China Health and Nutrition Survey
INTRODUCTION
Once considered diseases of affluence, the prevalence of non-communicable chronic health conditions, including overweight, has increased substantially in many low-and middle-income countries (1–3). As chronic conditions increase in these countries, it is imperative to examine how the social distribution of these conditions may be changing. Populations with low socioeconomic status (SES) within transitional countries, who have traditionally suffered disproportionately from communicable disease and undernutrition (4), may eventually come to experience the highest risk of these chronic conditions (5, 6).
In the face of changing disease burdens, one hypothesized mechanism by which new health disparities may emerge is that higher SES populations adjust their preferences, choices and behaviors based on new medical knowledge, treatment or stigma (7), while lower SES populations face more constraints in making the same health-preserving adjustments (8, 9). This process of emerging and widening disparities under such conditions has been referred to as a “social shaping of disease” (7), and it can best be investigated under conditions of large changes in disease burden, new diseases, new treatments for diseases or new stigma associated with disease (7). For example, the epidemic increase in overweight among older adolescents in the US was associated with the emergence of a social disparity in overweight prevalence (10); see (8) (11) (12) for other examples).
We use China as a case study to investigate the “social shaping of disease” (in this case, overweight) in a rapidly developing country (7). The dramatic increase in overweight prevalence in China over the past 20 years provides an excellent opportunity to investigate how the burden of overweight by socioeconomic status may have changed over time (13). China has experienced extremely rapid increases in economic development and national wealth over the last 20 years (14). With this economic growth and market restructuring have come major changes in food and physical activity environments and norms (15–17). Using longitudinal panel data spanning 17 years, we test whether a social disparity in the relative odds of overweight has emerged since the late 80s in China among women or men.
METHODS
Study population
Data come from the China Health and Nutrition Survey (CHNS), which is a panel study of nine Chinese provinces that includes 7 observational periods between 1989 and 2006. The CHNS was designed to be representative of the nine provinces, but not designed to be nationally representative. However, many of the general trends that have been reported among the CHNS sample are similar to those reported in other nationally representative surveys from China (18, 19). A multistage cluster sample design was used to survey individuals within the provinces. A stratified sample of counties inside each province was selected. Within these areas, neighborhoods and households were randomly selected and all members in each household were interviewed. The retention rates are described in more detail in Popkin et al (20), but briefly, the panel study design incorporated new households in each survey wave to replace those that were lost to follow-up. This is illustrated by the fact that while 68% of households included in the first wave (1989) were also included in the most recent wave (2006), the total sample size has increased slightly from 4,020 to 4467 households over the survey period (20). The study protocols were approved by the University of North Carolina at Chapel Hill and the Chinese Center for Disease Control Internal Review Boards.
Our analyses are limited to non-pregnant women and men who were surveyed at least once and were younger than 50 years at their first included measurement and older than 18 years during at least one of the survey waves (measurements from age 18 and above are included for individuals who aged into our eligible sample). Of the 7789 eligible women, 7314 (94%) were included in the analyses; missing data were due to BMI (n=372), education (n=95), age (n=8). For men, of the 7141 eligible, 6492 (91%) were included in the analysis; missing data were due to BMI (n=345), education (n=27), age (n=10), and smoking (266). The average number of measurements per person is 3.2 for women and 2.9 for men.
Dependent Variables
Height and weight were measured using standard techniques and portable equipment. BMI (weight (kg)/(height (m)2)) was used in its continuous form and also for overweight (BMI≥25) classification according to WHO guidelines (21). Although lower BMI cutpoints have been established as “action points” for disease risk in Asian populations, it is still recommended to use the standard cutpoints to enable international comparisons of overweight prevalence (22).
Independent Variables
We use education level to represent SES in our main analyses since, in general, education is believed to generally reflect social circumstance, particularly in lower income countries where the most disadvantaged groups may attend very little formal schooling (23). Additionally, attained education is typically correlated to some degree with earnings another indicator of socioeconomic status (23). Furthermore, there was a great deal of fluctuation into and out of income tertiles among families over the survey period, so we chose to focus on education as our indicator of SES, since it is more stable within individuals over the survey period. Highest level of education was ascertained for each individual at each survey wave and modeled as indicator variables according to the following categories: 1) less than primary school 2) primary school completed 3) secondary school completed 4) more than secondary school.
Our key independent variable of interest is the SES-specific rate of BMI/overweight increase over time. We include calendar year to represent time and interact it with attained education level in the regression models in order to assess the education group-specific rate of increase in BMI/overweight risk over time. In the regression analyses, calendar time was recoded from 0 (1989) to 17 (2006) and was entered as an ordinal variable.
Covariates
Age, smoking, urbanicity, and birth cohort were hypothesized confounders of the relationship between socioeconomic status and BMI/overweight. Subject-specific mean age and mean age squared were entered as covariates; mean age was used rather than actual age at each time point so that the effect of age is the between-subject effect of age (24). This specification allows the coefficient on age to capture the effect of the being older or younger in a given year, and more importantly, allows coefficient on calendar time to capture the passage of time within and between subjects.
Current smoking habits were ascertained in each survey except 1989. Since smoking is quite common among men, but rare among women in this context (see Table 1) and, since its inclusion results in the loss of observations from 1989, we included smoking as a covariate in the male analyses only. Birth cohort was categorized into 2 levels to keep adequate sample size yet distinguish between populations growing up during different periods in China. Following Chen et al (25), we chose to divide the birth cohorts before or after 1956 to separate the early and late 50s since the Great Leap Forward and the Three Year Famine occurred during the late 50s. This results in an older birth cohort born in 1939–1955 and a younger cohort is born in 1956–1988. We used a previously developed urbanicity scale (ranging from 0–130) for the CHNS sample in its continuous, time-varying form in the analyses (26).
Table 1.
Selected Sample Characteristics (Mean (SE) or %) for First and Last Survey Year by Sex (1989 & 2006)
| Women 1989 | |||||
|---|---|---|---|---|---|
| Overall | <Primary School | Primary School | Secondary school | >Secondary school | |
|
|
|||||
| N | 2642 | 844 | 1362 | 316 | 120 |
| Age | 32 (0.2) | 35 (0.3) | 30 (0.3) | 29 (0.3) | 30 (0.8) |
| BMI | 21.8 (0.1) | 22.0 (0.1) | 21.8 (0.1) | 21.4 (0.2) | 21.4 (0.2) |
| Overweight %* | 11 | 12 | 12 | 11 | 9 |
| Obese %(N)* | 1 | 1 | 1 | 0 | 3 |
| Urban Index | 44 (1.2) | 36 (1.0) | 45 (1.3) | 54 (1.4) | 63 (1.5) |
| Household Income per capita (Yuan)+ | 2,587 (99) | 2,124 (141) | 2,643 (112) | 3,152 (188) | 3,719 (260) |
| Current Smoker | NA | NA | NA | NA | NA |
| 2006 | |||||
| N | 3663 | 881 | 1866 | 460 | 456 |
| Age | 44 (0.2) | 52 (0.3) | 42 (0.3) | 42 (0.5) | 37 (0.8) |
| BMI | 23.4 (0.1) | 23.8 (0.2) | 23.5 (0.1) | 23.3 (0.3) | 21.9 (0.2) |
| Overweight % | 27 | 33 | 29 | 25 | 13 |
| Obese% | 5 | 4 | 6 | 4 | 2 |
| Urban Index | 63 (1.4) | 54 (1.6) | 60 (1.4) | 74 (1.5) | 82 (1.3) |
| Household Income per capita (Yuan) | 7,222 (349) | 5,621 (442) | 6,405 (278) | 7,739 (531) | 13,086 (1,193) |
| Current Smoker % | 5 | 9 | 5 | 3 | 2 |
| Men 1989 | |||||
| N | 2191 | 303 | 1401 | 303 | 141 |
| Age | 32 (0.2) | 35 (0.5) | 32 (0.2) | 30 (0.3) | 34 (0.8) |
| BMI | 21 (0.1) | 21 (0.1) | 21 (0.1) | 21 (0.1) | 22 (0.2) |
| Overweight % | 7 | 5 | 6 | 8 | 11 |
| Obese % | 0.3 | 0 | 0.4 | 0.3 | 0 |
| Urban Index | 43 (1.2) | 36 (1.2) | 42 (1.2) | 48 (1.7) | 64 (1.6) |
| Household Income per capita (Yuan) | 2,499 (100) | 1,835 (140) | 2,501 (114) | 2,837 (161) | 3,364 (144) |
| Current Smoker % | NA | NA | NA | NA | NA |
| 2006 | |||||
| N | 3307 | 314 | 1845 | 609 | 539 |
| Age | 43 (0.3) | 51 (0.6) | 44 (0.3) | 42 (0.5) | 39 (0.8) |
| BMI | 23.4 (0.1) | 22.6 (0.2) | 23.2 (0.1) | 23.6 (0.1) | 24.2 (0.2) |
| Overweight% | 27 | 18 | 25 | 30 | 37 |
| Obese% | 4 | 2 | 4 | 4 | 6 |
| Urban Index | 63 (1.4) | 54 (1.9) | 59 (1.4) | 68 (1.5) | 80 (1.4) |
| Household Income per capita (Yuan) | 7,574 (355) | 5,173 (576) | 6,306 (289) | 8,036 (484) | 12,767 (968) |
| Current Smoker% | 79 | 88 | 82 | 77 | 67 |
Overweight defined as BMI≥25 and Obese as BMI≥30 (21)
Household income is adjusted for inflation
EFFECT MEASURE MODIFICATION
We used sex-stratified analyses due to the demonstrated variation in the association between SES and BMI by sex (27, 28). Additionally, we hypothesized the SES-specific growth rates for BMI might vary according to birth cohort and/or urbanicity (13, 26, 29–32); we therefore tested these interactions.
Statistical Analyses
We calculated the mean BMI and proportion overweight for each education group in each survey wave for men and women separately to show unadjusted trends in BMI and overweight in the sample.
To estimate the average BMI growth rate over time according to education group, we employ sex-stratified random-effects linear models of repeated BMI measurements. We used comparable random-effects logistic regression models to estimate the education-specific change in odds of overweight over the study time period. Random-effects models incorporate all available measurements from each subject, which maximized our analytic sample. For time-varying variables, the model employs a weighted average of the between and within cluster effects (24). In our models the “cluster” is each individual, inside which, repeated measurements are nested. The models included a random intercept for each participant to account for the correlation between BMI measurements within the same person over time. We used robust standard errors to account for the potential correlation of BMI between people of the same household and community and for heteroskedasticity of residuals at the lowest level (occasion) (24, 33).
Our main variable of interests is the growth rate in BMI for each education group over time (represented by the interaction between education and survey year, as described above). Since we hypothesized that birth cohort and/or urbanicity might modify the effect of the education specific growth rates, we tested the significance of a three-way interaction between birth cohort and education and time as well urbanicity, education and time. In addition to the three-way interactions, we included all the lower order two-way interactions between the three variables and their main effects along with the covariates. Neither of the three-way interactions were significant, so we tested the remaining two-way interactions against the model with all two-way interactions included. After retaining the significant interactions, we test the assumption that the between and within subject effects are equivalent for the time-varying variables (time, time by education group, and urbanicity) by including the original variable and the person-specific mean of each variable (24). If the coefficient on the person-specific mean for any of these variables was significant it was retained in the model. We included a quadratic term for time if it was statistically significant to allow for curvilinearity.
The final linear and logistic regression models for women and men differ slightly based on the significance of the various interaction terms in each model. For women, all of the interactions between birth cohort and education, urbanicity, age and age squared were retained due to statistical significance. The tests of statistical equivalence of the between and within effects for time and urbanicity led to the inclusion of both the main effect and the between effect for urbanicity and time.
For males, the interaction between birth cohort and time was retained as was that of birth cohort and urbanicity, while the interactions between birth cohort and education, age and age squared were not included. Additionally, for males, we included smoking as a covariate and we included a quadratic term for time. We retained the person mean and occasion-specific deviation from the cluster mean for urbanicity only.
Random-effects logistic regression models with the same specifications as linear models for female and male models were used to estimate the education-specific growth rate in the odds of overweight over the study time period. Model coefficients and post-estimation tests of confidence intervals were used to graph the predicted BMI and odds of overweight by education group.
Sensitivity Analyses
For sensitivity analyses, we added per capita household income adjusted for inflation as a covariate to the final linear and logistic models to see if the results changed substantially. This was a basic test that the association between SES, represented by education, was not entirely attributable to income.
Additionally, we ran an unadjusted Cox proportional hazards model to see whether the hazard rates for incident overweight were in the same direction and of same significance to the prevalence rates at the end of the survey. We chose to focus the main analyses on prevalence odds ratios and BMI trajectories over time since our research question specifically is concerned with tracking trends over time and since focusing on incidence substantially decreased the sample size, due to the elimination of all new prevalent cases at each wave in this panel study.
Finally, we performed a post-hoc analysis to explore potential explanations for our main findings. We calculate the average minutes of physical activity spent engaged in heavy and light physical activity.
All analyses were performed in Stata 11 (34). Alpha was set at 0.05 for main effects and 0.10 for interactions. For linear models, model estimation was performed using xtreg with generalized least squares random-effects estimation and robust standard errors. For logistic models, gllamm with adaptive quadrature was used for the final models (24).
RESULTS
Overweight more than doubled in women and more than tripled in men from baseline to final follow-up (Table 1). Household income (adjusted for inflation) also increased over time, as did community-level urbanicity.
Among women, unadjusted mean BMI levels increased for all education levels, but least so for those with the highest educational attainment (Table 2). The mean BMI in 1989 for women in the two lowest education categories was slightly higher than that for women in the two highest categories. By 2006, the BMI for women in the three lowest education categories was approximately 2 units higher than that of women with the most education. Similarly, an estimated 12% of the least educated women are overweight in the first survey wave and this increased to 33% by the last survey wave (Table 2). The increase in overweight is much lower for the most educated women, increasing from 9% in the first wave to 13% in the final wave.
Table 2.
Mean BMI and Prevalence of Overweight* for Women by Education and Year
| Year (N) | 1989 (n=2642) | 1991 (n=3229) | 1993 (n=3079) | 1997 (n=3211) | 2000 (n=3679) | 2004 (n=3565) | 2006 (n=3663) |
|---|---|---|---|---|---|---|---|
| Mean BMI (SE) | |||||||
| <Primary School | 22.03 (0.12) | 22.08 (0.14) | 22.28 (0.14) | 22.68 (0.16) | 23.22 (0.15) | 23.67 (0.20) | 23.76 (0.16) |
| Primary school | 21.77 (0.09) | 21.77 (0.10) | 21.92 (0.10) | 22.44 (0.10) | 22.98 (0.11) | 23.45 (0.13) | 23.55 (0.13) |
| Secondary school | 21.43 (0.17) | 21.17 (0.15) | 21.47 (0.17) | 22.04 (0.15) | 22.68 (0.17) | 22.97 (0.25) | 23.32 (0.26) |
| >Secondary school | 21.37 (0.24) | 21.69 (0.25) | 21.57 (0.28) | 21.80 (0.20) | 21.84 (0.21) | 22.34 (0.28) | 21.94 (0.22) |
| Proportion Overweight (SE) | |||||||
| <Primary School | 0.12 (0.01) | 0.14 (0.02) | 0.17 (0.02) | 0.22 (0.02) | 0.27 (0.02) | 0.32 (0.02) | 0.33 (0.02) |
| Primary school | 0.12 (0.01) | 0.13 (0.01) | 0.13 (0.01) | 0.19 (0.01) | 0.24 (0.01) | 0.28 (0.01) | 0.29 (0.01) |
| Secondary school | 0.11 (0.02) | 0.11 (0.02) | 0.12 (0.02) | 0.13 (0.02) | 0.19 (0.02) | 0.23 (0.02) | 0.25 (0.02) |
| >Secondary school | 0.09 (0.03) | 0.14 (0.03) | 0.12 (0.03) | 0.13 (0.02) | 0.15 (0.02) | 0.17 (0.02) | 0.13 (0.02) |
|
Mean BMI and Prevalence of Overweight*
for Men by Education and Year
| |||||||
| Year (N) | 1989 (n=2191) | 1991 (n=2938) | 1993 (n=2846) | 1997 (n=3092) | 2000 (n=3440) | 2004 (n=3330) | 2006 (n=3307) |
| Education Level Mean BMI (SE) | |||||||
| <Primary School | 21.23 (0.14) | 21.16 (0.14) | 21.43 (0.15) | 21.74 (0.17) | 22.21 (0.19) | 22.08 (0.22) | 22.59 (0.17) |
| Primary school | 21.21 (0.10) | 21.31 (0.09) | 21.54 (0.08) | 21.93 (0.10) | 22.45 (0.10) | 23.11 (0.13) | 23.19 (0.12) |
| Secondary school | 21.46 (0.14) | 21.53 (0.14) | 21.83 (0.13) | 22.51 (0.15) | 23.02 (0.15) | 23.50 (0.16) | 23.64 (0.15) |
| >Secondary school | 21.77 (0.21) | 22.13 (0.19) | 22.54 (0.26) | 23.17 (0.26) | 23.52 (0.20) | 24.14 (0.23) | 24.20 (0.24) |
| Proportion Overweight (SE) | |||||||
| <Primary School | 0.05 (0.01) | 0.06 (0.01) | 0.08 (0.02) | 0.11 (0.02) | 0.14 (0.02) | 0.16 (0.03) | 0.18 (0.02) |
| Primary school | 0.06 (0.01) | 0.07 (0.01) | 0.09 (0.01) | 0.12 (0.01) | 0.18 (0.01) | 0.23 (0.01) | 0.25 (0.01) |
| Secondary school | 0.08 (0.02) | 0.09 (0.01) | 0.12 (0.02) | 0.20 (0.02) | 0.25 (0.02) | 0.31 (0.02) | 0.30 (0.02) |
| >Secondary school | 0.11 (0.02) | 0.14 (0.02) | 0.21 (0.03) | 0.28 (0.03) | 0.36 (0.03) | 0.34 (0.03) | 0.37 (0.02) |
Overweight defined as BMI≥25
In the adjusted results from the longitudinal random-effects regression models, we estimated the education-specific BMI increases per year while controlling for confounders (Table 3). Since the models included multiple interactions and were additionally complicated by the modeling of time, we used the model estimates to plot predicted BMI trajectories to aid in the interpretability of the results (Figure 1). Similar to the crude results, the estimated growth rate for BMI was higher the least educated women compared to most educated. Specifically, the estimated growth rate for women with the lowest education (<primary school) was 0.11 BMI units per year (βtime: 0.11 (CI 0.10, 0.12) while women with highest education (>secondary school) had a lower rate of increase of 0.08 BMI units per year (βyear*highest ed: −0.03 (CI −0.05, −0.005) (Table 3). Additionally, the growth rate among those with the highest education was also lower than those with secondary and primary school education (Figure 1). To translate these BMI gains into weight gains, we calculated the estimated weight gain for a female of average height (156cm) with an initial BMI of 22. At the BMI growth rate of the highest educated females this would amount to 0.19 kg/year or 3.31 kg over the 17-year period versus 0.27 kg/year or 4.54 kg at the growth rate of the least educated females.
Table 3.
Random-effects linear regression models of the adjusted association between education and BMI over survey period
| Females | Males | |
|---|---|---|
| β (95% Confidence Interval) | β (95% Confidence Interval) | |
|
| ||
| <Primary School | Referent | Referent |
| Primary School | −0.08 (−0.30, 0.15) | −0.22 (−0.45, 0.00) |
| Secondary School | −0.45 (−0.76, −0.14) | 0.08 (−0.20, 0.36) |
| >Secondary School | −0.36 (−0.74, 0.02) | −0.07 (−0.46, 0.32) |
| Time × Primary School | 0.02 (0.01, 0.04) | 0.04 (0.02, 0.06) |
| Time × Secondary School | 0.03 (0.00, 0.05) | 0.04 (0.01, 0.06) |
| Time × >Secondary School | −0.03 (−0.06, −0.01) | 0.07 (0.04, 0.10) |
| Time | 0.11 (0.10, 0.12) | 0.14 (0.11, 0.18) |
| Mean* Time | −0.09 (−0.11, −0.07) | - |
| Time Squared | - | 0.00 (0.00, 0.00) |
| Birth Cohort (1= before 1955) | −2.98 (−4.19, −1.77) | 0.35 (0.06, 0.65) |
| Birth Cohort × Time | - | −0.04 (−0.06, −0.02) |
| Birth Cohort × Primary School | −0.11 (−0.41, 0.18) | - |
| Birth Cohort × Secondary School | 0.42 (−0.32, 1.16) | - |
| Birth Cohort × >Secondary School | 0.27 (−0.27, 0.82) | - |
| Urbanicity1 | 0.01 (0.01, 0.02) | 0.01 (0.00, 0.02) |
| Mean Urbancity1,2 | −0.01 (−0.02, −0.01) | 0.00 (−0.01, 0.01) |
| Birth Cohort × Urbanicity1 | −0.01 (−0.02, 0.00) | −0.02 (−0.03, 0.00) |
| Birth Cohort × Mean Urbanicity1,2 | 0.04 (0.03, 0.06) | 0.04 (0.03, 0.06) |
| Person-specific Mean Age1,2 | 0.20 (0.10, 0.30) | 0.38 (0.33, 0.43) |
| Person-specific Mean Age Squared1,2 | 0.00 (0.00, 0.00) | 0.00 (−0.01, 0.00) |
| Birth Cohort × Mean Age1,2 | 0.38 (−0.09, 0.84) | - |
| Birth Cohort × Mean Age Squared1,2 | −0.01 (−0.01, 0.00) | - |
| Current Smoker | - | −0.29 (−0.39, −0.20) |
| Intercept | 22.47 (22.17, 22.78) | 21.13 (20.86, 21.41) |
|
| ||
| Number of Observations | 23,068 | 18,693 |
| N | 7,314 | 6,492 |
Variable means are the person-specific/group mean value for these variables over the survey period. The coefficient on the variable for the person-specific mean represents the difference between the between and within effects for each variable. These are included for time-varying variables for which the between and within coefficients were significantly different.
Urbanicity, mean urbanicity, mean age and mean age squared were mean centered before inclusion in the regression.
Figure 1. Predicted BMI Trajectories for Women (1989–2006), (a) Older Cohort and (b) Younger Birth Cohort.

*Figures displays predicted BMI over survey period based on coefficients from random-effects linear model in Table 3 with the following specifications: urbanicity and mean urbanicity level of 53; mean age for older cohort of 54; mean age for younger cohort of 29.
Figure 1 demonstrates that women in the older birth cohort have lower predicted BMIs compared to the younger cohort throughout the survey period. However, in both cohorts the slower BMI growth rate for the highest education group results in a widening gap in predicted BMI between the most educated and least educated women over the survey period. At the beginning of the survey, the predicted BMI for the highest education compared to the lowest was not significantly different for the younger or older birth cohort (younger: βsecondary school −0.36 (CI −0.74, 0.02); older: β 0.27secondary schoolXcohort (−0.27, 0.82)). By 2006, this difference increased to almost one BMI unit lower for the young cohort by 2006 (β −0.88 (CI−1.22, −0.53) and 0.61 BMI units lower for the older cohort (β −0.61 (CI −1.11, −0.11)) (Figure 1).
The covariates in the model of BMI (Table 3) suggest that within each birth cohort, being older is associated with a higher BMI; this association is stronger for the older birth cohort, but decreases slightly with advancing age in this cohort. Increasing urbanicity over time is associated with increases in BMI for the younger cohort, but is not significant for the older birth cohort.
The results examining the odds of overweight were generally similar to those found for BMI (Table 4). Specifically, the highest education group experienced a significantly lower rate of increase (8% lower) in the odds of overweight compared to the lowest education group. At baseline, the odds of overweight between the highest and lowest education groups were not significantly different for the younger or the older cohorts. However, by 2006, the odds ratio for overweight for the highest versus the lowest education groups was OR 0.22 (CI 0.11, 0.42) for the younger cohort and OR 0.27 (CI 0.10, 0.72) for the older cohort (Figure 2). Similar to the results from the linear regression, the inverse association between education and odds of obesity was of slightly larger magnitude for the younger cohort. The results for the covariates in the models of the BMI and odds of overweight from the linear and logistic regressions are generally similar in significance and direction, with the exception of that, the lowest education group in the older birth cohort has significantly lower BMIs (Table 3); however, this does not translate into significantly lower odds of overweight (Table 4).
Table 4.
Random-effects logistic regression models of the association between education and overweight (BMI≥25) over survey period
| Females | Males | |
|---|---|---|
|
| ||
| Odds Ratio (95% Confidence Interval) | Odds Ratio (95% Confidence Interval) | |
|
| ||
| <Primary School | 1.0 | 1.0 |
| Primary School | 0.90 (0.54, 1.49) | 0.63 (0.29, 1.4) |
| Secondary School | 0.80 (0.40, 1.60) | 1.21 (0.50, 2.9) |
| >Secondary School | 0.78 (0.29, 2.12) | 1.77 (0.64, 4.8) |
| Time × Primary School | 1.01 (0.98, 1.05) | 1.07 (1.01, 1.1) |
| Time × Secondary School | 0.98 (0.94, 1.02) | 1.03 (0.97, 1.1) |
| Time × >Secondary School | 0.92 (0.87, 0.98) | 1.04 (0.97, 1.1) |
| Time | 1.17 (1.13, 1.20) | 1.39 (1.26, 1.5) |
| Mean Time | 0.90 (0.86, 0.94) | - |
| Time Squared | - | 0.99 (0.99, 0.99) |
| Birth Cohort (1= before 1955) | 0.21 (0.03, 1.58) | 0.99 (0.99, 1.0) |
| Birth Cohort × Time | - | 1.57 (0.83, 3.0) |
| Birth Cohort × Primary School | 1.18 (0.73, 1.92) | - |
| Birth Cohort × Seconday School | 1.65 (0.69, 3.99) | - |
| Birth Cohort × >Secondary School | 1.48 (0.57, 3.87) | - |
| Urbanicity1 | 1.02 (1.01, 1.04) | 1.02 (1.01, 1.0) |
| Mean Urbancity1,2 | 0.98 (0.97, 1.00) | 1.01 (0.99, 1.0) |
| Birth Cohort × Urbanicity2 | 0.98 (0.97, 1.00) | 0.98 (0.95, 1.0) |
| Birth Cohort × Mean Urbanicity1,2 | 1.05 (1.02, 1.07) | 1.06 (1.03, 1.1) |
| Person-specific Mean Age1,2 | 1.53 (1.29, 1.82) | 1.63 (1.46, 1.8) |
| Person-specific Mean Age Squared1,2 | 1.00 (1.00, 1.01) | 0.99 (0.99, 1.0) |
| Birth Cohort × Mean Age1,2 | 1.41 (0.66, 3.03) | - |
| Birth Cohort × Mean Age Squared1,2 | 1.00 (0.99, 1.01) | - |
| Current Smoker | - - |
0.68 (0.56, 0.8) - |
| Intercept | 0.02 (0.01, 0.04) | 0.002 (0.0007, 0.005) |
|
| ||
| Number of Observations | 23,068 | 18,693 |
| N | 7,314 | 6,492 |
Variable means are the person-specific mean value for these variables over the survey period. The coefficient on the variable for the person-specific mean represents the difference between the between and within effects for each variable. These are included for time-varying variables for which the between and within coefficients were significantly different (24).
Urbanicity, mean urbanicity, mean age and mean age squared were mean centered before inclusion in the random-effects logistic regression.
Figure 2. Predicted Odds Ratios for Overweight (BMI≥25) for Highest Education Group Compared Lower Education Group (1989–2006) for Women.

*Figures displays predicted Odds Ratio over survey period based on coefficients from random-effects logistic model in Table 4.
Quite different trends were seen among men. Unadjusted mean BMI increased for all education groups; however, for men, the highest education group had the largest increases in BMI (Table 2). Specifically, the mean BMI for men in 1989 was similar across education category (21.2–21.8); however by 2006, the mean BMI for men with the most education had increased to 24.2 while that for men with the lowest education was 22.6.
The adjusted linear models also indicated that the estimated rate of increase in BMI was higher for the group with the highest education compared to those with the lowest (βyear*highest ed 0.07 (CI 0.04, 0.10) (Table 3). At baseline, predicted mean BMI for men with the highest education is not statistically different than that of men with the lowest education β −0.07 (CI −0.45, 0.32). However, by 2006, compared to men with the lowest education, the predicted BMI for men with the highest education is more than one BMI unit higher (β 1.16 (CI 0.80, 1.52)) (Figure 3). Figure 3 demonstrates that, for men, the older cohort has slightly higher initial BMI levels; however, the growth rate over time is faster for the younger cohort, who end up with higher BMIs on average. Also for men, the trend is for generally increasing BMIs, but the statistically significant quadratic term for time results in a curvilinear trend such that the slopes are less steep in more recent years. To translate these BMI gains into estimated kilograms we calculated the estimated weight gain for a male of average height (166cm) with an initial BMI of 22. At the BMI growth rate of the highest educated males this would amount to 9.83 kg vs 6.53 kg at the growth rate of the least educated males. The findings amongst the covariates are similar to those discussed for women; additionally, smoking is associated with a lower BMI (Table 3).
Figure 3. Predicted BMI Trajectories for Men (1989–2006), (a) Older and (b) Younger Birth Cohorts.

*Figures displays predicted BMI over survey period based on coefficients from random-effects linear model in Table 3 with the following specifications: urbanicity and mean urbanicity level of 53; mean age for older cohort of 54; mean age for younger cohort of 29; nonsmokers.
The trends in the odds of overweight for men are largely similar to those seen for BMI (Table 4), with the exception that the education-specific growth rate for the most educated men was significantly higher for BMI, but does not reach statistical significance for odds of overweight. However, the odds ratio for overweight are still significantly higher for the most educated men (vs the least educated) in the final survey year OR 3.2 (CI 1.85, 5.91) (Figure 4) For men, the effect of time, but not that of education, varied by cohort, so the odds ratio of overweight comparing most educated to the least educated are the same for both the older and younger cohorts.
Figure 4. Predicted Odds Ratios for Overweight (BMI≥25) for Highest Education Group Compared to each Lower Education Group (1989–2006) for Men, Both Cohorts.
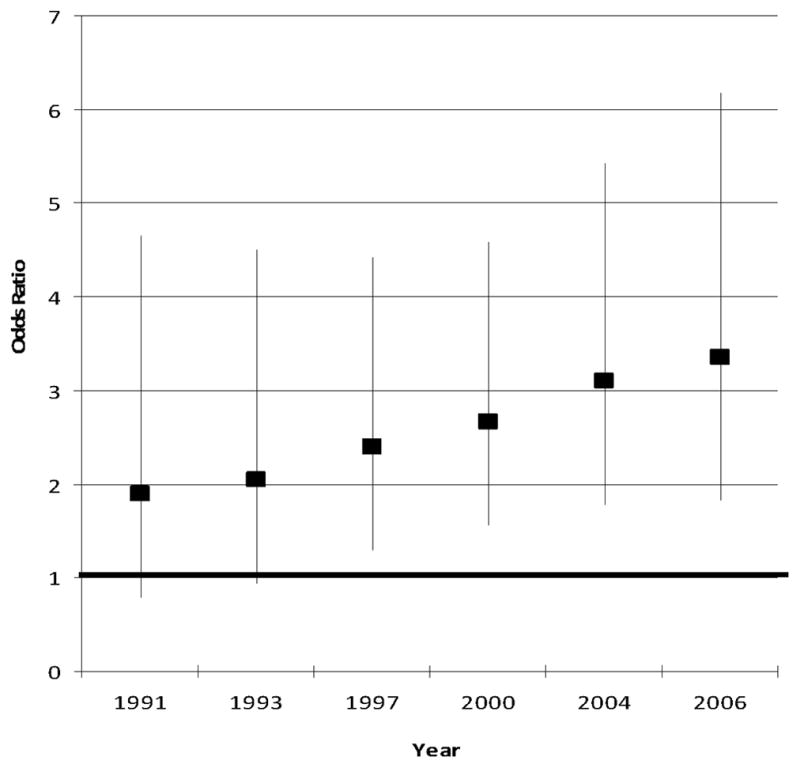
*Figures displays predicted Odds Ratio over survey period based on coefficients from random-effects logistic model in Table 4.
Sensitivity Analyses
Controlling for income in all analyses resulted in virtually no change to model estimates (results not shown). Among females, the coefficient for income was positive, but not statistically significant in either model. Among males, the coefficient on income was positive and statistically significant in the logistic models (OR 1.01 for every 1000 Yuan increase in real income; p=0.04).
The hazard ratio of overweight was lower for the most educated versus the least educated (HR 0.72 (CI 0.54, 0.97) for women. In men, those with the most versus the least education had a higher hazard of overweight (HR 3.43 (CI 2.64, 4.46)) for men. These results are consistent in terms of direction and significance with our primary analyses of prevalence.
DISCUSSION
Over the last 2 decades, Chinese women experienced an emergence of a disparity in overweight by SES. Whereas odds of overweight did not differ significantly for women with low and high education in 1989, by 2006, a disparity in overweight risk was readily evident with higher overweight among women with lower education levels. For men, we observe the opposite, with the most educated men having higher levels of overweight by 2006.
Our findings among women provide empirical evidence that the burden of chronic, non-communicable conditions, such as overweight, might shift toward people with low socioeconomic status even in developing countries, and particularly for transitional countries undergoing rapid development. Our study adds to a small body of literature that traces the social distribution of various conditions over time to demonstrate emerging health disparities in the context of changing disease burden, medical technologies and/or stigma (10–12, 35). These studies enhance a large body of literature that shows a robust cross-sectional inverse relationship between socioeconomic status and disease.
Our findings among women are consistent with the findings of emergent disparities in overweight/obesity in which the lower SES groups now have higher rates of overweight in the US among adolescents (10) and among women in some regions of Brazil (36). Our findings among men are also consistent with the trends among men in Brazil (37). Our study improves upon these studies by following individuals longitudinally rather than using repeated cross-sectional data.
In China, men and women with higher education likely have similar access to energy-dense foods, sedentary occupations and energy-saving modern conveniences (26, 38), but women with high education experienced a slowed growth rate in BMI while men with high education experienced an increased rate of growth BMI gains. Additionally, access to energy-dense foods, sedentary occupations, and labor-saving devices is likely more limited for the women with low education in comparison to the women with high education in this context (16, 38). The divergent patterns among high income men and women and high versus low SES women during a time in which the food and physical activity environments rapidly changed (13, 16, 39), could be consistent with a difference in response to a rapidly changing food environment by education group and sex. We briefly explore potential explanations that might account for the differences seen between men and women for the relationship of SES to BMI.
First, women with high education might enact behaviors to limit BMI gains due to either health concerns/health knowledge or to a preference for a thinner body size. Preference for thinness due to stigma or health concerns may exist for women more so than for men, and, compared to lower educated women, highly educated women may have the better means to achieve thinner body sizes in what has become an increasingly obesogenic environment in modern China (13, 16, 39). The role of sex-specific stigma and desired body size has previously been speculated as a rationale for the difference in the associations between SES and body size between males and females (27, 40). Our study did not directly test this speculation; however, some evidence suggests that the desired body size among Chinese women has been tall and thin since the 1970s (41) and that Chinese girls currently on average expressed a desire for a thinner body, while boys were more likely to perceive themselves as underweight or normal weight (40, 42, 43).
Differences in physical activity could be an explanation if the most highly educated men have substantially more sedentary jobs or get less total physical activity than the most highly educated women. However, despite early evidence from CHNS that men were more likely to transition out of farming into less physically demanding jobs while women remained in the more physically demanding farming jobs (44), more recent work has demonstrated that total physical activity for men and women in the CHNS has decreased more for women over time (45) and that men and women now have comparable levels of total activity on average. Additionally, examining the most recent data for our sample shows that for both men and women, compared to those with lower education, those with higher education report much lower levels of heavy activity and higher levels of light activity and that these levels are similar among men (heavy: 115 minutes/week; light 1797) and women (heavy: 61 minutes/week; light: 1867) of the same education level. Physical activity might explain the differences among men of high and low education, but it does not offer a convincing explanation for the male-female differences in the association between education and BMI or overweight.
There are limitations to our study. First, although this is a longitudinal study, not every participant was interviewed at every survey wave. However, due to the panel study design and to our use of random-effects models, we were able to retain a very high proportion of the participants in the analysis (94% of eligible women and 91% of eligible men) and we tested for differences on observed characteristics between those excluded and included. Second, education only addresses one aspect of SES; yet, we tested whether our results would remain the same if we added an additional control for income, finding virtually unchanged estimates. Future work could explore additional dimensions of SES in this context.
Conclusion
The doubling and tripling of overweight prevalence in women and men, respectively, in China has been accompanied by a shift in the social distribution of this overweight among women. Our work concurs with other predictions that the burden of chronic diseases, such as overweight, might shift toward the lowest social classes even in developing countries where higher SES individuals have historically had higher comparative risks for such diseases.
Footnotes
CONFLICT OF INTEREST
None of the authors has any affiliation, financial agreements or other potential conflicts of interest with regards to this manuscript.
References
- 1.Ezzati M, Hoorn S, Lawes C, Leach R, James W, Lopez A, et al. Rethinking the diseases of affluence paradigm: global patterns of nutritional risks in relation to economic development. PLoS Med. 2005;2:e133. doi: 10.1371/journal.pmed.0020133. [DOI] [PMC free article] [PubMed] [Google Scholar]
- 2.Popkin BM. The world is fat. Sci Am. 2007;297:88–95. doi: 10.1038/scientificamerican0907-88. [DOI] [PubMed] [Google Scholar]
- 3.Yach D, Hawkes C, Gould CL, Hofman KJ. The Global Burden of Chronic Diseases. JAMA: The Journal of the American Medical Association. 2004;291:2616–2622. doi: 10.1001/jama.291.21.2616. [DOI] [PubMed] [Google Scholar]
- 4.Grantham-McGregor S, Cheung YB, Cueto S, Glewwe P, Richter L, Strupp B. Developmental potential in the first 5 years for children in developing countries. The Lancet. 2007;369:60–70. doi: 10.1016/S0140-6736(07)60032-4. [DOI] [PMC free article] [PubMed] [Google Scholar]
- 5.Victora CG, Adair L, Fall C, Hallal PC, Martorell R, Richter L, et al. Maternal and child undernutrition: consequences for adult health and human capital. The Lancet. 2008;371:340–357. doi: 10.1016/S0140-6736(07)61692-4. [DOI] [PMC free article] [PubMed] [Google Scholar]
- 6.Frenk J. Bridging the divide: global lessons from evidence-based health policy in Mexico. The Lancet. 2006;368:954–961. doi: 10.1016/S0140-6736(06)69376-8. [DOI] [PubMed] [Google Scholar]
- 7.Link BG. Epidemiological Sociology and the Social Shaping of Population Health. J Health Soc Behav. 2008;49:367–384. doi: 10.1177/002214650804900401. [DOI] [PubMed] [Google Scholar]
- 8.Link BG, Phelan J. Social conditions as fundamental causes of disease. J Health Soc Behav. 1995;(Spec No):80–94. [PubMed] [Google Scholar]
- 9.Phelan JC, Link BG. Controlling disease and creating disparities: a fundamental cause perspective. J Gerontol B Psychol Sci Soc Sci. 2005;60(Spec No 2):27–33. doi: 10.1093/geronb/60.special_issue_2.s27. [DOI] [PubMed] [Google Scholar]
- 10.Miech RA, Kumanyika SK, Stettler N, Link BG, Phelan JC, Chang VW. Trends in the association of poverty with overweight among US adolescents, 1971–2004. JAMA. 2006;295:2385–2393. doi: 10.1001/jama.295.20.2385. [DOI] [PubMed] [Google Scholar]
- 11.Chang VW, Lauderdale DS. Fundamental Cause Theory, Technological Innovation, and Health Disparities: The Case of Cholesterol in the Era of Statins. J Health Soc Behav. 2009;50:245–260. doi: 10.1177/002214650905000301. [DOI] [PMC free article] [PubMed] [Google Scholar]
- 12.Miech R. The formation of a socioeconomic health disparity: the case of cocaine use during the 1980s and 1990s. J Health Soc Behav. 2008;49:352–366. doi: 10.1177/002214650804900308. [DOI] [PMC free article] [PubMed] [Google Scholar]
- 13.Wang H, Du S, Zhai F, Popkin BM. Trends in the distribution of body mass index among Chinese adults, aged 20–45 years (1989–2000) Int J Obes (Lond) 2007;31:272–278. doi: 10.1038/sj.ijo.0803416. [DOI] [PubMed] [Google Scholar]
- 14.WorldBank. World Development Indicators. [Google Scholar]
- 15.Wang Z, Zhai F, Du S, Popkin B. Dynamic shifts in Chinese eating behaviors. Asia Pac J Clin Nutr. 2008;17:123–130. [PubMed] [Google Scholar]
- 16.Monda KL, Gordon-Larsen P, Stevens J, Popkin BM. China’s transition: the effect of rapid urbanization on adult occupational physical activity. Soc Sci Med. 2007;64:858–870. doi: 10.1016/j.socscimed.2006.10.019. [DOI] [PMC free article] [PubMed] [Google Scholar]
- 17.Popkin BM. Will China’s nutrition transition overwhelm its health care system and slow economic growth? Health Aff (Millwood) 2008;27:1064–1076. doi: 10.1377/hlthaff.27.4.1064. [DOI] [PMC free article] [PubMed] [Google Scholar]
- 18.Zimmer Z, Kwong J. Socioeconomic Status and Health among Older Adults in Rural and Urban China. J Aging Health. 2004;16:44–70. doi: 10.1177/0898264303260440. [DOI] [PubMed] [Google Scholar]
- 19.Wildman RP, Gu D, Muntner P, Wu X, Reynolds K, Duan X, et al. Trends in Overweight and Obesity in Chinese Adults: Between 1991 and 1999–2000. Obesity. 2008;16:1448–1453. doi: 10.1038/oby.2008.208. [DOI] [PubMed] [Google Scholar]
- 20.Popkin BM, Du S, Zhai F, Zhang B. Cohort Profile: The China Health and Nutrition Survey--monitoring and understanding socio-economic and health change in China, 1989–2011. Int J Epidemiol. 2009:dyp322. doi: 10.1093/ije/dyp322. [DOI] [PMC free article] [PubMed] [Google Scholar]
- 21.WHO/FAO. Expert Consultation on Diet, Nutrition and the Prevention of Chronic DiseasesReport of the joint WHO/FAO expert consultation. World Health Organization; Geneva: 2003. [Google Scholar]
- 22.Appropriate body-mass index for Asian populations and its implications for policy and intervention strategies. The Lancet. 2004;363:157–163. doi: 10.1016/S0140-6736(03)15268-3. [DOI] [PubMed] [Google Scholar]
- 23.Lynch J, Kaplan G. Socioeconomic Position. In: Berkman L, Kawachi I, editors. Social Epidemiology. Oxford University Press; New York: 2000. [Google Scholar]
- 24.Rabe-Hesketh S, Skrondal A. Multilevel and longitudinal modeling using Stata. 2. xxiii. Stata Press; College Station, Tex: 2008. p. 317. [Google Scholar]
- 25.Chen F, Yang Y, Liu G. Social Change and Socioeconomic Disparities in Health over the Life Course in China: A Cohort Analysis. American Sociological Review. 75:126–150. doi: 10.1177/0003122409359165. [DOI] [PMC free article] [PubMed] [Google Scholar]
- 26.Jones-Smith JC, Popkin BM. Understanding community context and adult health changes in China: Development of an urbanicity scale. Social Science & Medicine. 71:1436–1446. doi: 10.1016/j.socscimed.2010.07.027. [DOI] [PMC free article] [PubMed] [Google Scholar]
- 27.Sobal J, Stunkard AJ. Socioeconomic status and obesity: a review of the literature. Psychol Bull. 1989;105:260–275. doi: 10.1037/0033-2909.105.2.260. [DOI] [PubMed] [Google Scholar]
- 28.McLaren L. Socioeconomic Status and Obesity. Epidemiol Rev. 2007;29:29–48. doi: 10.1093/epirev/mxm001. [DOI] [PubMed] [Google Scholar]
- 29.Ziraba AK, Fotso JC, Ochako R. Overweight and obesity in urban Africa: A problem of the rich or the poor? BMC Public Health. 2009;9:465. doi: 10.1186/1471-2458-9-465. [DOI] [PMC free article] [PubMed] [Google Scholar]
- 30.Dearth-Wesley T, Wang H, Popkin BM. Under- and overnutrition dynamics in Chinese children and adults (1991–2004) Eur J Clin Nutr. 2007 doi: 10.1038/sj.ejcn.1602853. [DOI] [PubMed] [Google Scholar]
- 31.Van de Poel E, O’Donnell O, Van Doorslaer E. Are urban children really healthier? Evidence from 47 developing countries. Soc Sci Med. 2007;65:1986–2003. doi: 10.1016/j.socscimed.2007.06.032. [DOI] [PubMed] [Google Scholar]
- 32.National Research Council. Cities Transformed: Demographic Change and Its Implications in the Developing World. In: Dynamics MM, Stern R, Cohen B, Reed HE, editors. Panel on Urban Population. Committee on Population, Division of Behavioral and Social Sciences and Education; Washington, DC: 2003. [Google Scholar]
- 33.Williams RL. A Note on Robust Variance Estimation for Cluster-Correlated Data. Biometrics. 2000;56:645–646. doi: 10.1111/j.0006-341x.2000.00645.x. [DOI] [PubMed] [Google Scholar]
- 34.Stata Corporation. Stata Statistical Software. Release 11.0 edn. Texas Station: 2009. [Google Scholar]
- 35.Phelan JC, Link BG, Diez-Roux A, Kawachi I, Levin B. “Fundamental causes” of social inequalities in mortality: a test of the theory. J Health Soc Behav. 2004;45:265–285. doi: 10.1177/002214650404500303. [DOI] [PubMed] [Google Scholar]
- 36.Monteiro CA, Conde WL, Popkin BM. The burden of disease from undernutrition and overnutrition in countries undergoing rapid nutrition transition: a view from Brazil. Am J Public Health. 2004;94:433–434. doi: 10.2105/ajph.94.3.433. [DOI] [PMC free article] [PubMed] [Google Scholar]
- 37.Monteiro CA, Conde WL, Popkin BM. Income-specific trends in obesity in Brazil: 1975–2003. Am J Public Health. 2007;97:1808–1812. doi: 10.2105/AJPH.2006.099630. [DOI] [PMC free article] [PubMed] [Google Scholar]
- 38.Kim S, Symons M, Popkin BM. Contrasting socioeconomic profiles related to healthier lifestyles in China and the United States. Am J Epidemiol. 2004;159:184–191. doi: 10.1093/aje/kwh006. [DOI] [PubMed] [Google Scholar]
- 39.Popkin B. Will China’s nutrition transition overwhelm its health care system and slow economic growth? Health Aff (Millwood) 2008;27:1064–1076. doi: 10.1377/hlthaff.27.4.1064. [DOI] [PMC free article] [PubMed] [Google Scholar]
- 40.Xie B, Chou C-P, Spruijt-Metz D, Reynolds K, Clark F, Palmer PH, et al. Weight perception and weight-related sociocultural and behavioral factors in Chinese adolescents. Preventive Medicine. 2006;42:229–234. doi: 10.1016/j.ypmed.2005.12.013. [DOI] [PubMed] [Google Scholar]
- 41.Leung F, Lam S, Sze S. Cultural Expectations of Thinness in Chinese Women. Eating Disorders: The Journal of Treatment & Prevention. 2001;9:339–350. doi: 10.1080/106402601753454903. [DOI] [PubMed] [Google Scholar]
- 42.Lee S. How abnormal is the desire for slimness? A survey of eating attitudes and behaviour among Chinese undergraduates in Hong Kong. Psychological Medicine. 1993;23:437–451. doi: 10.1017/s0033291700028531. [DOI] [PubMed] [Google Scholar]
- 43.Xie B, Liu C, Chou C-P, Xia J, Spruijt-Metz D, Gong J, et al. Weight perception and psychological factors in Chinese adolescents. Journal of Adolescent Health. 2003;33:202–210. doi: 10.1016/s1054-139x(03)00099-5. [DOI] [PubMed] [Google Scholar]
- 44.Entwisle BHG, Short SE, Bouma J, Zhai FY. Gender and family businesses in rural China. American Sociological Review. 1995;60:36–57. [Google Scholar]
- 45.Ng SW, Norton EC, Popkin BM. Why have physical activity levels declined among Chinese adults? Findings from the 1991–2006 China health and nutrition surveys. Social Science & Medicine. 2009;68:1305–1314. doi: 10.1016/j.socscimed.2009.01.035. [DOI] [PMC free article] [PubMed] [Google Scholar]