Abstract
We used Medicare administrative data to examine trends in primary and revision THA utilization and hospital volume. Between 1991 and 2005 primary and revision THA utilization increased by 40.9% and 16.8% respectively. The percentage of primary THA procedures performed in high volume hospitals (those in the highest quintile of volume) increased slightly from 58.0% of all procedures in 1991 to 58.7% in 2005 (P-value < 0.01). The percentage of revisions performed in high volume hospitals increased from 60.9% to 62.4% (P-value < 0.01). The percentage of primary THA procedures performed by low volume hospitals remained relatively stable (P-value = 0.36) while the percentage of revision THA performed by low volume hospitals declined (P-value < 0.001). In aggregate these results suggest minimal evidence that regionalization of THA is occurring.
BACKGROUND
Total hip arthroplasty (THA) is one of the most common surgical procedures performed in the United States (U.S) and worldwide.1,2 In 2006 an estimated 280,000 THA procedures were performed in the U.S. at a cost of more than $12 billion.3 THA is generally safe with major complication rates of approximately 3% for primary procedures and 8% for revision procedures.4,5
More than 25 years of research have demonstrated an association between higher volume and improved patient outcomes for an array of surgical and medical procedures including THA.6–10 Based upon these data major healthcare purchasers and payors have attempted to guide patients in need of elective surgery such as THA to higher volume hospitals whenever possible in efforts to improve outcomes and reduce costs.11,12 Despite efforts to regionalize major surgical procedures to higher volume medical centers, there are few empirical studies evaluating whether such consolidation is occurring.13 Moreover, almost all of the studies examining longitudinal trends in hospital volume have focused on coronary artery bypass graft surgery14,15 where secular trends of declining CABG utilization make interpretation of study findings difficult. While some studies have found evidence that higher volume CABG hospitals have gained market share,14,16 other studies have found that regionalization of CABG may not be occurring.15,17
In the area of orthopaedics very few studies have evaluated longitudinal trends in volume18,19 and, to the best of our knowledge, no studies have specifically evaluated trends in hospital THA volume. Thus, the objectives of the current study were to examine long-term trends in primary and revision THA utilization and hospital volume among Medicare enrollees. Our expectation was that, over time, we would find that utilization of THA substantially increased and that an increasing proportion of procedures were being performed by higher volume arthroplasty hospitals.
METHODS
Data
We used Medicare Provider Analysis and Review (MedPAR) Part A data files to identify fee-for-service beneficiaries who underwent primary or revision THA between 1991 and 2005. Patients were identified using International Classification of Diseases, Ninth Revision, Clinical Modification (ICD-9CM) procedure codes (81.51 for primary and 80.05, 81.53, 00.70, 00.71, 00.72, 00.73 for revision THA).9,20–22 The Part A files contain a range of data collected from discharge abstracts for all hospitalized fee-for-service Medicare enrollees including: patient demographics; zip code of primary residence; ICD-9CM codes for primary and secondary diagnoses and procedures; admission source (e.g., emergency department or transfer from outside hospital); admission and discharge dates; discharge disposition (e.g., home, another acute-care hospital, dead); death occurring up to three years after discharge; each patient’s unique Medicare beneficiary number allowing for identification of patient readmissions; and each hospital’s unique six digit identification number. Comorbid illnesses present on the index admission were identified using algorithms described by Elixhauser et al.23,24 which consider 30 specific conditions and exclude comorbid conditions that may represent complications of care or that are related to the primary reason for hospitalization.
Because the objective of our study was to examine trends in volume and regionalization of elective THA procedures we excluded several populations where surgery is typically more emergent and hospital choice more limited. In particular, we excluded patients with acute fractures (116,210 primary THAs and 27,746 revision THAs), patients undergoing THA after transfer from another acute care hospital (2,400 primary THAs and 4,399 revision THAs), and patients admitted through the emergency department (16,294 primary THAs and 28,092 revision THAs) in accordance with other studies assessing orthopaedic outcomes.9,25,26
Statistical Analysis
First, we examined the demographic characteristics and prevalence of comorbid illness for patients undergoing THA across the study period. We used analysis of variance for comparisons of continuous variables and the chi-square test for categorical variables. All analyses were performed separately for primary and revision THA patients. For simplicity, tabular data are presented for years 1992, 1998, and 2004. Second, we examined the total number of primary and revision THA procedures performed each year using similar methods. We calculated primary and revision THA utilization rates as the number of procedures performed each year per 10,000 fee-for-service Medicare beneficiaries.
Third, we examined the total number of acute care hospitals providing care to Medicare enrollees each year and the proportion of these hospitals performing primary and revision THA each year. Since prior studies have demonstrated that, in contrast to bypass surgery, many U.S. hospitals performed very low volumes of THA (i.e., fewer than five procedures per-year), we considered a hospital to perform THA if it performed at least one primary or revision THA on Medicare beneficiaries during a particular year. We also calculated the mean and median hospital volume for primary and revision THA for each year.
Fourth, to examine evidence for regionalization of THA, we began by stratifying hospitals into quintiles of primary and revision THA volume for each year. We then compared how the threshold volume demarcating the highest volume quintile and lowest volume quintile changed over time and we examined the mean volume for each quintile for each year. There is no established method for defining high and low volume THA hospitals and establishing thresholds is made more difficult given a secular trend towards increasing THA utilization over time.18,19 While we considered defining high and low volume THA hospitals using a constant volume threshold applied to each study year (e.g., high volume >100 primary THA per year; low volume <10 THA per year), we felt it more appropriate to allow thresholds for high and low volume hospitals to vary over time. We then defined a hospital as high volume during a specific year if their primary (or revision) THA volume met the threshold for the top quintile of volume for all hospitals in the same year. Likewise, a hospital was defined as low volume if their volume for primary (or revision) THA placed them in the lowest quintile of volume during the same year. After identifying all high volume and low volume hospitals for each study year, we calculated the percentage of all primary (and revision) THA procedures performed in high volume and low volume hospitals. To evaluate whether high volume THA hospitals were gaining a larger share of the overall THA market, we used simple linear regression.
Sensitivity Analysis
To assess the robustness of our results, we conducted an array of sensitivity analyses. In particular, we repeated our analyses after adding back the excluded populations described previously (e.g., fracture patients). We also repeated our analyses using a constant threshold for high volume and low volume hospitals across time rather than volume quintiles. In primary THA our thresholds for high volume and low volume hospitals were 100 per year and 10 per year, respectively and 25 per year and 5 per year for revision THA.
All p-values are 2-tailed, with p-values less than .05 deemed statistically significant. All statistical analyses were performed using SAS 9.1.3 (SAS Institute Inc., Cary, NC). This project was approved by the University of Iowa Institutional Review Board.
RESULTS
Our final study population included 1,146,786 elective primary THAs performed on 1,002,997 unique patients and 225,330 revision THAs performed on 189,832 unique patients between 1991 and 2005. The characteristics of patients undergoing primary and revision THA are displayed in Table 1 and Table 2, respectively. Over the study period the mean age of patients undergoing both primary and revision THA increased and the proportion of procedures performed on women declined. There was also an increase in comorbidity among both primary and revision THA patients.
Table 1.
| 1992 (N=62,636) |
1998 (N=71,651) |
2004 (N=93,537) |
P-value | |
|---|---|---|---|---|
| Demographics | ||||
| Age, mean (SD) | 74.1 (6.0) | 75.2 (6.2) | 75.5 (6.2) | <0.001 |
| Sex, women (%) | 41377 (64.4) | 47032 (64.1) | 61123 (63.7) | <0.01 |
| Race, number (%) | ||||
| White | 58697 (91.4) | 69226 (94.3) | 89809 (93.5) | <0.001 |
| Black | 2410 (3.8) | 2782 (3.8) | 4120 (4.3) | <0.001 |
| Other | 985 (1.5) | 1124 (1.5) | 1734 (1.8) | <0.001 |
| Missing | 2166 (3.4) | 249 (0.3) | 359 (0.4) | <0.001 |
| Comorbidity, number (%) | ||||
| Diabetes | 4887 (7.6) | 7404 (10.1) | 12743 (13.3) | <0.001 |
| CHF | 2063 (3.2) | 3012 (4.1) | 4633 (4.8) | <0.001 |
| Obesity | 1574 (2.5) | 2606 (3.6) | 5108 (5.3) | <0.001 |
| Renal failure | 296 (0.5) | 403 (0.6) | 980 (1.0) | <0.001 |
| Number of comorbid conditions, mean (SD) | 1.1 (1.1) | 1.4 (1.3) | 1.8 (1.4) | <0.001 |
Table 2.
| 1992 (N=12,531) |
1998 (N=14,905) |
2004 (N=15,327) |
P-value | |
|---|---|---|---|---|
| Demographics | ||||
| Age, mean (SD) | 75.1 (6.5) | 76.4 (6.6) | 76.8 (6.6) | <0.001 |
| Sex, women (%) | 8130 (62.9) | 9704 (61.9) | 9977 (60.8) | <0.001 |
| Race, number (%) | ||||
| White | 11821 (91.5) | 14678 (93.6) | 15340 (93.5) | <0.001 |
| Black | 537 (4.2) | 738 (4.7) | 731 (4.5) | 0.27 |
| Other | 180 (1.4) | 207 (1.3) | 289 (1.8) | <0.01 |
| Missing | 386 (3.0) | 54 (0.3) | 42 (0.3) | <0.001 |
| Comorbidity, number (%) | ||||
| Diabetes | 922 (7.1) | 1738 (11.1) | 2280 (13.9) | <0.001 |
| CHF | 589 (4.6) | 1046 (6.7) | 1337 (8.2) | <0.001 |
| Obesity | 221 (1.7) | 387 (2.5) | 600 (3.7) | <0.001 |
| Renal failure | 87 (0.7) | 140 (0.9) | 299 (1.8) | <0.001 |
| Number of comorbid conditions, mean (SD) | 1.1 (1.2) | 1.6 (1.4) | 2.0 (1.5) | <0.001 |
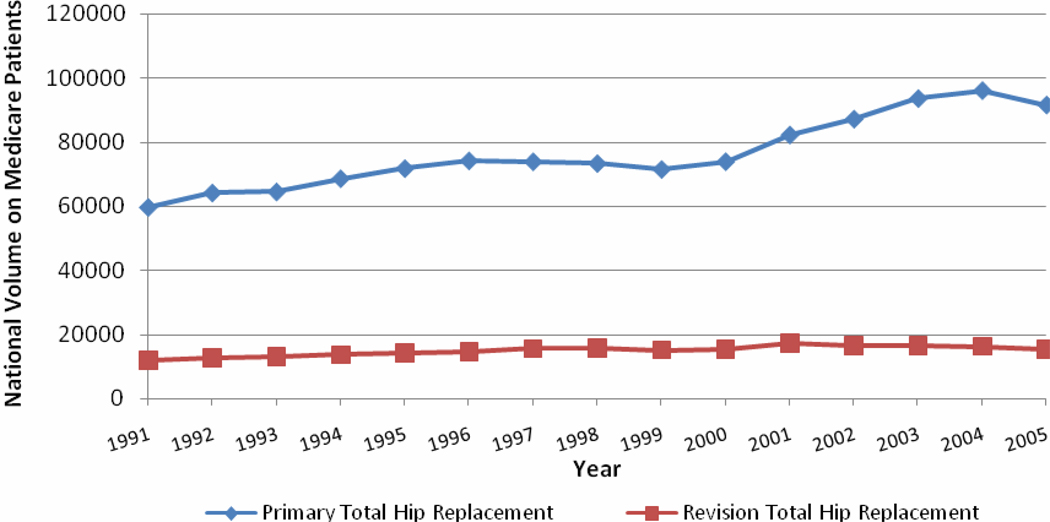
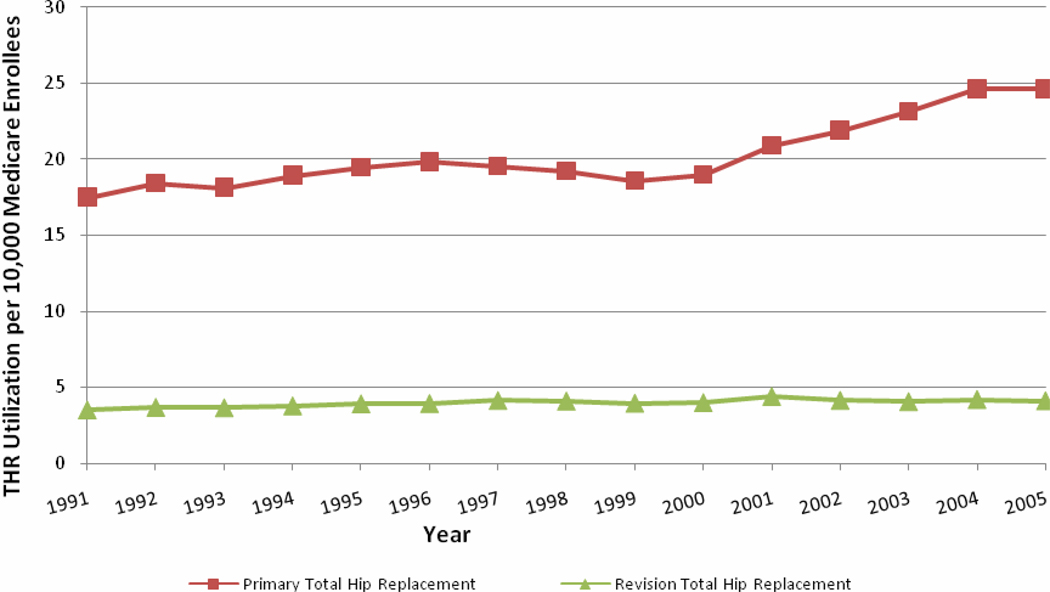
The number of primary THA procedures increased by 53.1% between 1991 and 2005 from 59,791 to 91,548 (Figure 1) while the number of revision THA procedures increased by 26.9% from 12,066 to 15,312 (Figure 1). Viewed from another perspective, primary THA utilization increased by 40.9% between 1991 and 2005 whereas revision THA increased by 16.8% (Figure 2).
Figure 1.
Primary and revision Medicare THR volume 1991–2005
Figure 2.
Primary and revision Medicare THR utilization per 10,000 enrollees per-year 1991–2005
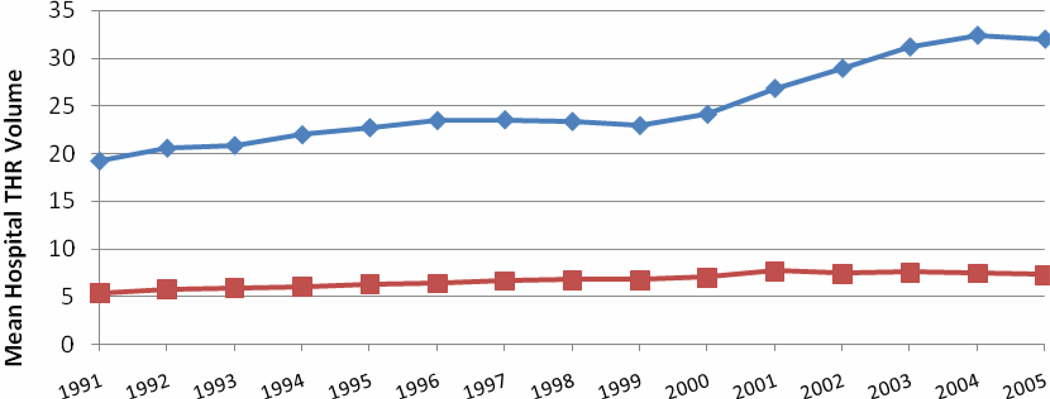
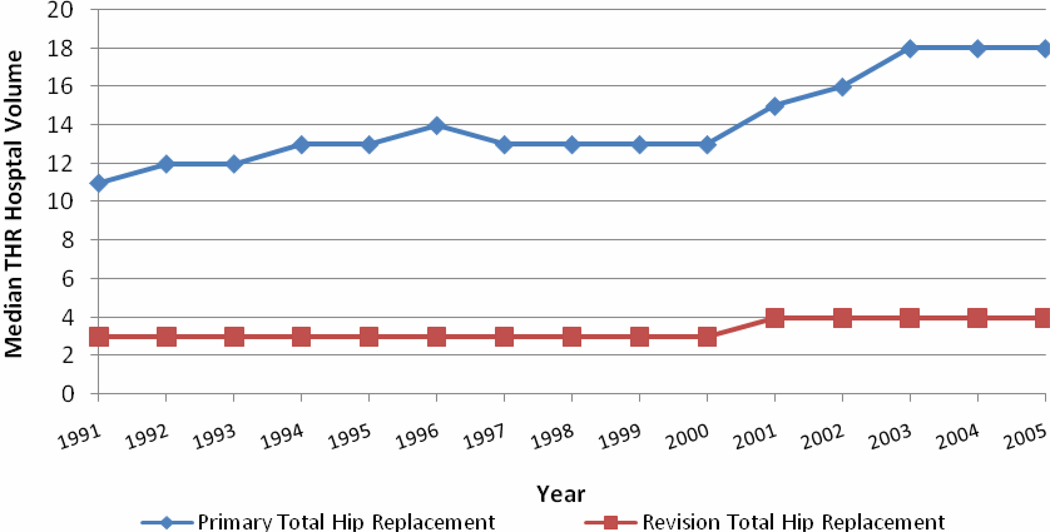
The percentage of U.S. acute care hospitals performing elective primary THA increased from 58.4% of hospitals in 1992 to 73.0% in 2004 while the percentage of hospitals performing revision THA increased from 41.8% to 54.2% (Table 3). Mean (and median) hospital volume increased for both primary and revision THA (Table 3 and Figure 3) over the study period, though the increase was much larger for primary THA. Mean hospital volumes for primary THA in 1992 for volume quintiles 1, 2, 3, 4 and 5 were 1.9 procedures per-year, 5.7, 12.0, 23.1, and 59.8; mean hospital volumes for revision THA in 1992 for quintiles 1, 2, 3, 4, and 5 were 1, 2, 3.5, 6.2, and 18.4. Mean hospital volumes for primary THA in 2004 for quintiles 1, 2, 3, 4 and 5 were 2.3, 8.6, 18.8, 36.3,and 96.3; mean hospital volumes for revision THA in 2004 for quintiles 1, 2, 3, 4 and 5 were 1, 2, 3.8, 7.5, and 22.9. From a different prospective, median hospital volumes for primary THA in 1992 for quintiles 1, 2, 3, 4 and 5 were 2, 6, 12, 22, and 49; median hospital volumes for revision THA in 1992 for quintiles 1, 2, 3, 4, and 5 were 1, 2, 3, 6, and 14. Median hospital volumes for primary THA in 2004 for quintiles 1, 2, 3, 4 and 5 were 2, 8, 19, 36, and 80; median hospital volumes for revision THA in 2004 for quintiles 1, 2, 3, 4 and 5 were 1, 2, 4, 7, and 18.
Table 3.
| 1992 (N= 5,352 hospitals) |
1998 (N= 4,991 hospitals) |
2004 (N= 4,058 hospitals) |
||||
|---|---|---|---|---|---|---|
| Primary | Revision | Primary | Revision | Primary | Revision | |
| Number performing procedure, (%) | 3124 (58.4) | 2236 (41.8) | 3140 (62.9) | 2322 (46.5) | 2961 (73.0) | 2201 (54.2) |
| Mean volume, all hospitals, (sd) | 25.6 (26.1) | 5.8 (8.5) | 23.4 (30.5) | 6.8 (10.5) | 32.4 (43.1) | 7.5 (11.5) |
| Mean volume, highest volume quintile, (sd) | 59.8 (35.5) | 18.4 (13.1) | 68.7 (41.2) | 21.3 (16.5) | 96.3 (59.2) | 22.9 (17.8) |
| Median volume, highest volume quintile, (IQR) | 49 (39–70) | 14 (11–21) | 57 (45–78) | 17 (12–23) | 80 (63–110) | 18 (13–26) |
| Mean volume, lowest volume quintile, (sd) | 1.9 (0.8) | 1.0 (0) | 1.9 (0.8) | 1.0 (0) | 2.3 (1.1) | 1.0 (0) |
| Median volume, lowest volume quintile, (IQR) | 2 (1–3) | 1 (1–1) | 2 (1–3) | 1 (1–1) | 2 (1–3) | 1 (1–1) |
Figure 3.
A AND 3B: Primary and revision Hospital THR volume 1991–2005
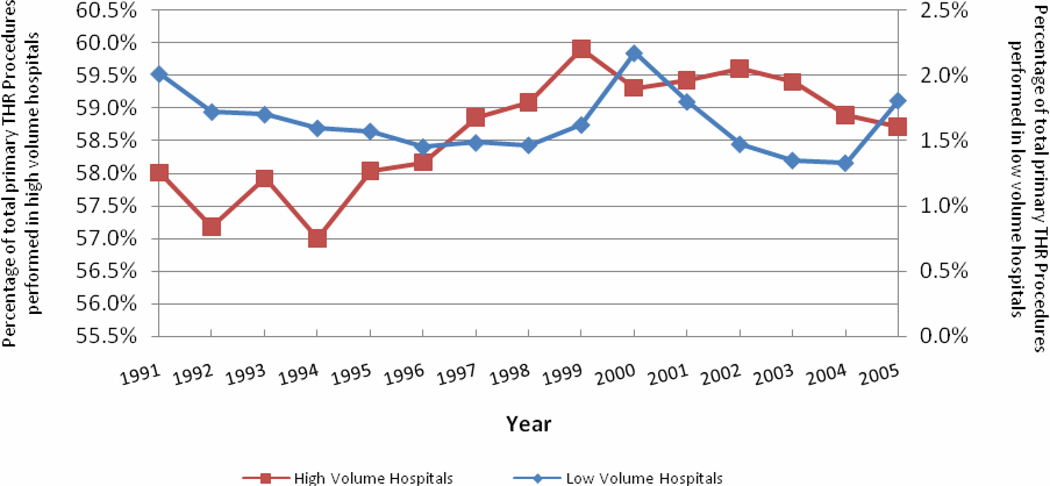
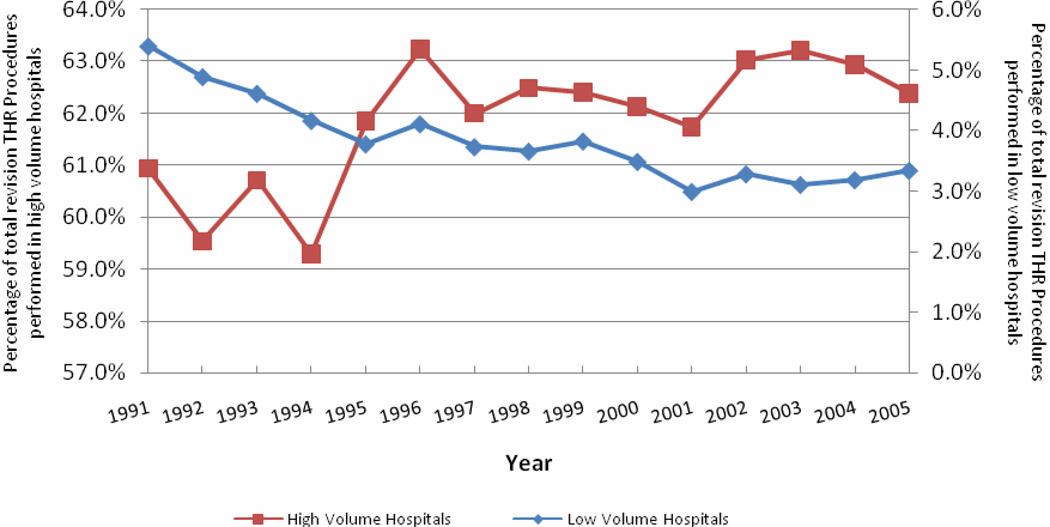
In additional analyses, we found that the percentage of all primary THA procedures performed by hospitals in the highest quintile of primary THA volume increased marginally from 58.0% in 1991 to 58.7% in 2005 (Figure 4)(P-value < 0.01). We also found that the percentage of all revision THA procedures performed by hospitals in the highest quintile of revision THA volume increased modestly over the course of the study period (P-value < 0.01); in 1991 high volume revision THA hospitals performed 60.9% of all revision procedures while in 2005 high volume THA hospitals performed 62.4% of revision procedures (Figures 5). The percentage of elective primary THA procedures performed by low volume hospitals remained relatively stable over the study period (P-value = 0.36) while the percentage of revision THA procedures performed by low volume hospitals dropped significantly (P-value < 0.001)(Figures 4 and 5).
Figure 4.
Proportion of total primary THR procedures performed in high volume and low volume hospitals
Figure 5.
Proportion of total revision THR procedures performed in high volume and low volume hospitals
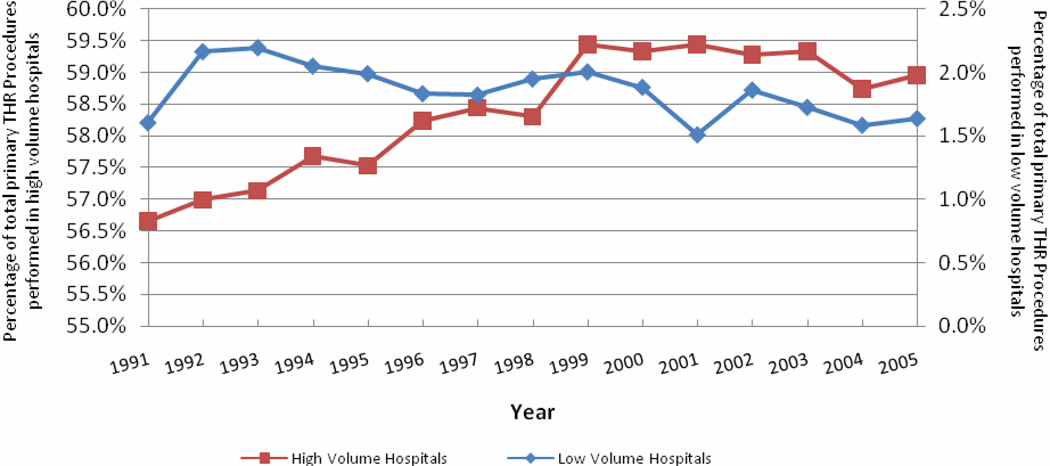
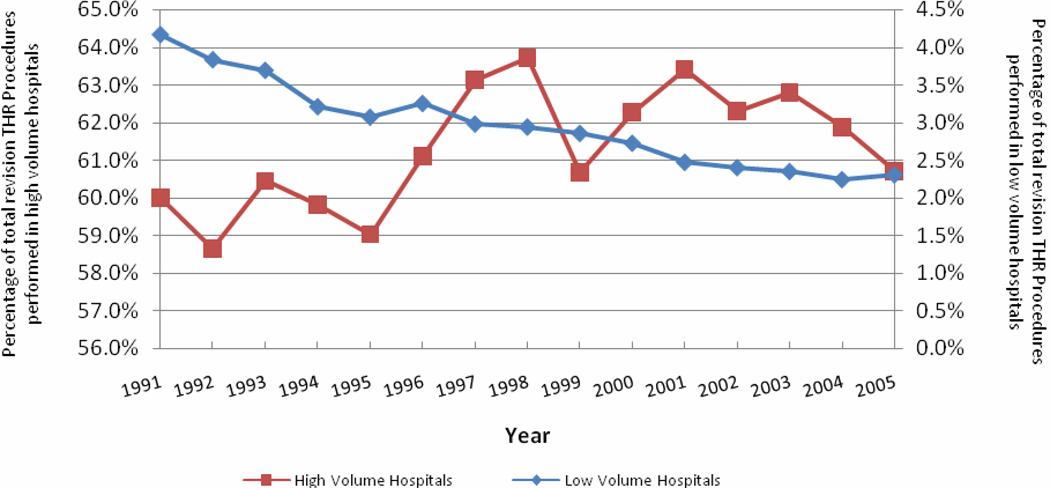
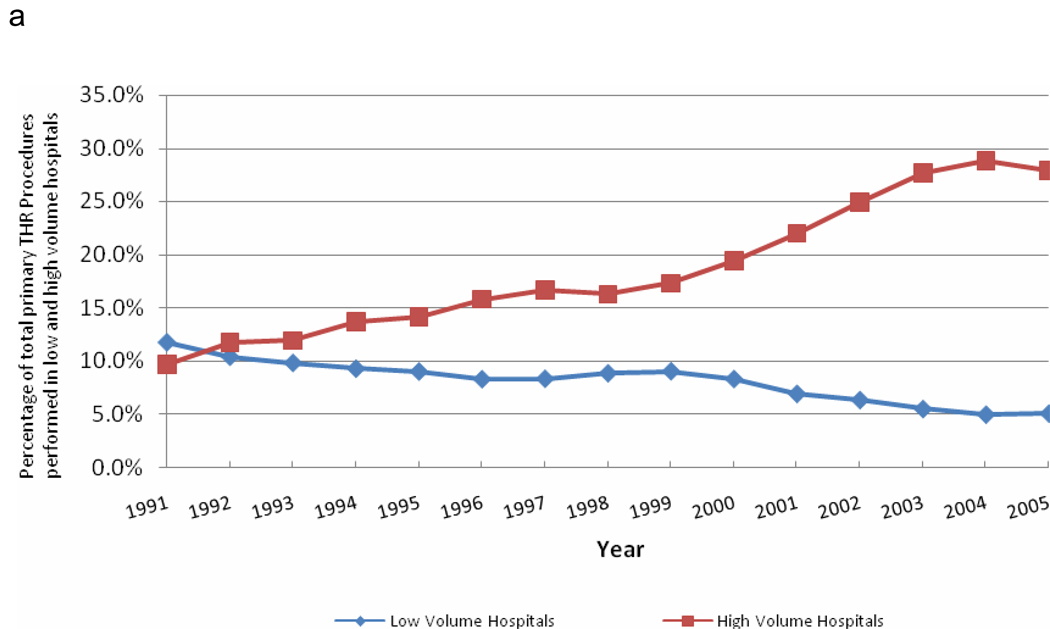
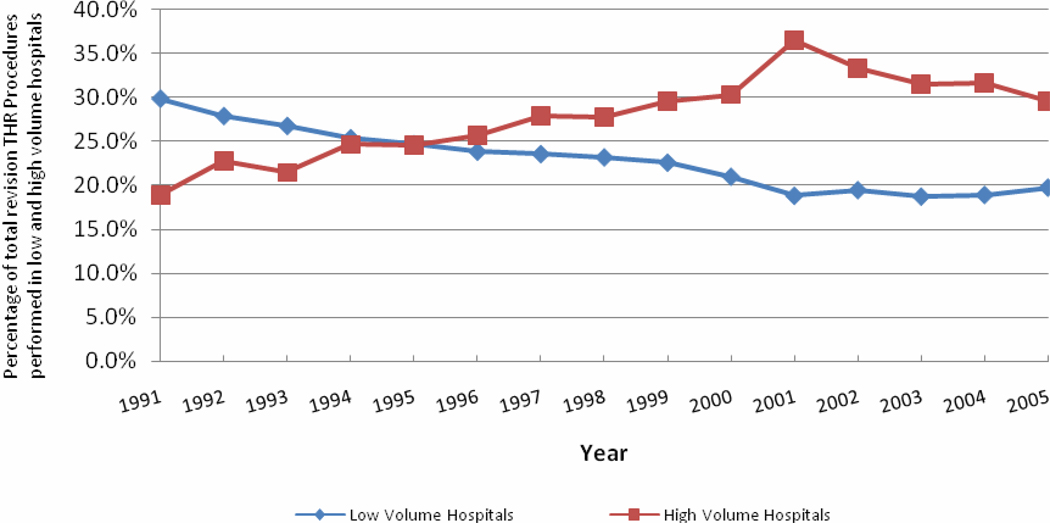
Sensitivity analyses that included patients requiring more emergent procedures yielded similar results to the primary analyses (Appendix A and B). In supplementary analyses that defined high volume and low volume primary THA hospitals using constant threshold across time (and thus did not account for the secular trend towards increasing primary THA utilization), we found the percentage of all primary THA procedures performed by high volume hospitals increased significantly from 9.7% in 1991 to 27.9% in 2005 (p-value < 0.001), whereas the percentage performed by low volume hospitals dropped from 11.8% in 1991 to 5.1% in 2005 (P-value < 0.001) (Appendix C); however, these analyses must be interpreted with caution because they largely reflect the fact that THA volume and utilization are increasing over time rather than the fact that procedures are migrating to higher volume hospitals. Likewise, using a fixed threshold for revision THA we found that the percentage of all revision procedures performed by high volume hospitals increased from 18.9% in 1991 to 29.6% in 2005 (P-value < 0.001) and the percentage of all revision THA procedures performed by low volume hospitals decreased from 29.9% in 1991 to 19.8% in 2005 (P-value < 0.001) (Appendix D).
Appendix A.
Proportion of total primary THR procedures performed in high volume and low volume hospitals (all patients)
Appendix B.
Proportion of total revision THR procedures performed in high volume and low volume hospitals (all patients)
Appendix C.
Proportion of total primary THR procedures performed in high volume and low volume hospitals (fixed thresholds)
Appendix D.
Proportion of total revision THR procedures performed in high volume and low volume hospitals
DISCUSSION
In a longitudinal analysis of Medicare administrative data from 1991–2005, we found an increase in age and comorbidity among patients undergoing elective THA procedures. We also found that while both primary and revision THA volume increased substantially, per-capita utilization of primary THA increased while utilization of revision procedures actually declined. Finally, while we found evidence of increasing concentration of primary THA procedures in high volume hospitals we found little evidence of regionalization of revision THA procedures to high volume hospitals. In aggregate, our results suggest that despite more than twenty years of efforts promoting regionalization of elective surgical procedures there is only modest evidence that regionalization of THA has occurred.
A number of our findings warrant further discussion. First, our finding of increasing complexity of both primary and revision THA patients is important. Prior studies from the cardiovascular disease literature have documented a trend towards increasing patient complexity27–29 but studies of longitudinal trends in orthopaedics are much more limited with most studies focusing exclusively on knee arthroplasty.4,30–32 For example Jain et al. evaluated trends in knee replacement recipients between 1990 and 2000 and found evidence of increasing patient complexity over time.30 Our study extends findings from the cardiovascular disease literature and knee arthroplasty to the area of hip arthroplasty.
Second, it is important to discuss our finding of an increase in utilization of primary THA but a decrease in revision THA. The increase in primary THA utilization expands and supports several studies that have demonstrated a steady increase in utilization of knee arthroplasty over the past two decades.4,30,33 Interestingly, in the only study we could identify focusing on THA utilization in the United States, Kurtz et al. found a substantial increase in both primary and revision THA rates.18 The difference in our findings may relate to differences in the data sources used for the two studies, the years included in the analyses, and the patient populations included. A trends towards increased utilization of primary THA seems logical given continually increasing experience with this procedure, the excellent outcomes, and desire for an aging population to remain physically active. Likewise, a trend towards decreasing utilization of revision THA would be consistent with improvements in surgical skill and implant design reducing the need for revision procedures.
Third, and perhaps most interesting are our findings with regards to regionalization. In particular, we found that the proportion of all primary THA procedures performed in high volume hospitals increased by a relatively modest 3.6% between 1991 and 2005 while the proportion of primary procedures performed in low volume hospitals remained nearly constant at 1.6%. In contrast, we found that the proportion of total revision THA volume performed in high volume hospitals declined slightly between 1991 and 2005 while the proportion of revision THA volume performed in low volume hospitals actually increased. In an analysis of TKA Jain et al. found that between 1990 and 2000 the proportion of all procedures performed in high volume centers increased while the proportion performed in low volume centers decreased, but they did not differentiate primary and revision procedures and their study focused on TKA rather than THA.30
A finding of a relatively modest trend towards concentration of primary THA in high volume hospitals and no evidence of concentration of revision procedures is somewhat surprising given the significant efforts made to encourage regionalization. We deliberately limited our analysis to elective procedures where patients and their physicians would, theoretically, have substantial leeway in selecting hospitals. While trends in hospital volume have been well studied in the case of cardiac procedures,17,34 analyses focusing on orthopaedics are much more limited. The finding that concentration of procedures in high volume hospitals appeared greater for primary THA when compared to revision THA is also difficult to explain given that revision procedures are more difficult to perform with higher complication rates (2%–4% versus 6%–10%) and thus would seem to be exactly the procedures that would benefit most from regionalization.9,26
Our study has a number of limitations that warrant brief mention. First, our study was limited to fee-for-service Medicare beneficiaries and thus extrapolation to other populations should be done with caution. Second, our estimates of hospital THA volume were calculated based upon procedures performed upon Medicare beneficiaries; thus certain hospitals classified as low volume may actually have had higher volume if their ratio of Medicare to non-Medicare arthroplasty cases differed substantially from that of the population at large. Third, our study relied upon administrative data and thus there is the possibility that changes in coding practices could have impacted our results. That said, we are unaware of any systematic changes in the coding of primary or revision THA that would have significantly impacted our findings.
In conclusion, we found evidence of a modest concentration of primary THA procedures in higher volume centers, but little evidence that regionalization of revision THA procedures is occurring. Given the sustained efforts that have been made to increase regionalization, our results give pause over whether such efforts have been successful and whether efforts should instead turn towards improving quality in lower volume hospitals.
Supplementary Material
ACKNOWLEDGEMENTS
Dr. Vaughan-Sarrazin is a Research Scientist at CADRE at the Iowa City VA Medical Center, which is funded through the Department of Veterans Affairs, Veterans Health Administration, Health Services Research and Development Service. Dr. Cram was supported by a K23 career development award (RR01997201) from the NCRR at the NIH and the Robert Wood Johnson Physician Faculty Scholars Program. Dr. Cram is supported, in-part, by the Department of Veterans Affairs. This work is funded by R01 HL085347-01A1 from NHLBI at the NIH.
Footnotes
Publisher's Disclaimer: This is a PDF file of an unedited manuscript that has been accepted for publication. As a service to our customers we are providing this early version of the manuscript. The manuscript will undergo copyediting, typesetting, and review of the resulting proof before it is published in its final citable form. Please note that during the production process errors may be discovered which could affect the content, and all legal disclaimers that apply to the journal pertain.
COMPETING INTERESTS:
The views expressed in this article are those of the authors and do not necessarily represent the views of the Department of Veterans Affairs. The funding sources had no role in the analyses or drafting of this manuscript. None of the authors have any conflicts of interest. Dr. Cram has received consulting fees from The Consumers Union (publisher of Consumer Reports Magazine) and Vanguard Health Inc. for work advice on quality improvement initiatives. Dr. Callaghan is the President of the American Academy of Orthopaedic Surgery and has served as a consultant to several orthopaedic implant manufacturers.
AUTHORS’ CONTRIBUTIONS: Dr. Cram and Ms. Lu had full access to all the data in the study and take responsibility for the integrity of the data and the accuracy of the data analysis.
REFERENCES
- 1.Merx H, Dreinhofer K, Schrader P, et al. International variation in hip replacement rates. Annals of the Rheumatic Diseases. 2003 Mar;62(3):222–226. doi: 10.1136/ard.62.3.222. [DOI] [PMC free article] [PubMed] [Google Scholar]
- 2.Lohmander LS, Engesaeter LB, Herberts P, Ingvarsson T, Lucht U, Puolakka TJ. Standardized incidence rates of total hip replacement for primary hip osteoarthritis in the 5 Nordic countries: similarities and differences. Acta Orthop. 2006 Oct;77(5):733–740. doi: 10.1080/17453670610012917. [DOI] [PubMed] [Google Scholar]
- 3.Centers for Disease Control and Prevention. Health, United States, 2009. U.S. Centers for Disease Control; 2009. [Google Scholar]
- 4.Khatod M, Inacio M, Paxton EW, et al. Knee replacement: epidemiology, outcomes, and trends in Southern California: 17,080 replacements from 1995 through 2004. Acta Orthop. 2008 Dec;79(6):812–819. doi: 10.1080/17453670810016902. [DOI] [PubMed] [Google Scholar]
- 5.Katz JN, Phillips CB, Baron JA, et al. Association of hospital and surgeon volume of total hip replacement with functional status and satisfaction three years following surgery. Arthritis & Rheumatism. 2003 Feb;48(2):560–568. doi: 10.1002/art.10754. [see comment] [DOI] [PubMed] [Google Scholar]
- 6.Luft HS, Bunker JP, Enthoven AC. Should operations be regionalized? The empirical relation between surgical volume and mortality. New England Journal of Medicine. 1979 Dec 20;301(25):1364–1369. doi: 10.1056/NEJM197912203012503. [DOI] [PubMed] [Google Scholar]
- 7.Luft HS. The relation between surgical volume and mortality: An exploration of causal factors and alternative models. Med Care. 1980;18(9):940–959. doi: 10.1097/00005650-198009000-00006. [DOI] [PubMed] [Google Scholar]
- 8.Birkmeyer JD, Siewers AE, Finlayson EV, et al. Hospital volume and surgical mortality in the United States. New England Journal of Medicine. 2002 Apr 11;346(15):1128–1137. doi: 10.1056/NEJMsa012337. [DOI] [PubMed] [Google Scholar]
- 9.Katz JN, Losina E, Barrett J, et al. Association between hospital and surgeon procedure volume and outcomes of total hip replacement in the United States medicare population. Journal of Bone & Joint Surgery - American Volume. 2001 Nov;83-A(11):1622–1629. doi: 10.2106/00004623-200111000-00002. [see comment] [DOI] [PubMed] [Google Scholar]
- 10.Doro C, Dimick J, Wainess R, Upchurch G, Urquhart A. Hospital volume and inpatient mortality outcomes of total hip arthroplasty in the United States. Journal of Arthroplasty. 2006 Sep;21(6 Suppl 2):10–16. doi: 10.1016/j.arth.2006.05.009. [DOI] [PubMed] [Google Scholar]
- 11.Birkmeyer JD, Lucas FL, Wennberg DE. Potential benefits of a regionalizing major surgery in Medicare patients. Effective Clinical Practice. 1999;2:277–283. [PubMed] [Google Scholar]
- 12.Birkmeyer JD, Finlayson EV, Birkmeyer CM. Volume standards for high-risk surgical procedures: potential benefits of the Leapfrog initiative. Surgery. 2001;130(3):415–422. doi: 10.1067/msy.2001.117139. [DOI] [PubMed] [Google Scholar]
- 13.Ho V, Heslin MJ, Yun H, Howard L. Trends in hospital and surgeon volume and operative mortality for cancer surgery. Annals of Surgical Oncology. 2006 Jun;13(6):851–858. doi: 10.1245/ASO.2006.07.021. [DOI] [PubMed] [Google Scholar]
- 14.Mukamel DB, Mushlin AI. Quality of care information makes a difference: an analysis of market share and price changes after publication of the New York State Cardiac Surgery Mortality Reports. Medical Care. 1998 Jul;36(7):945–954. doi: 10.1097/00005650-199807000-00002. [DOI] [PubMed] [Google Scholar]
- 15.Marcin JP, Li Z, Kravitz RL, Dai JJ, Rocke DM, Romano PS. The CABG surgery volume-outcome relationship: temporal trends and selection effects in California, 1998–2004. Health Services Research. 2008 Feb;43(1 Pt 1):174–192. doi: 10.1111/j.1475-6773.2007.00740.x. [DOI] [PMC free article] [PubMed] [Google Scholar]
- 16.Ho V. Does certificate of need affect cardiac outcomes and costs? Int J Health Care Finance Econ. 2006 Dec;6(4):300–324. doi: 10.1007/s10754-007-9008-9. [DOI] [PubMed] [Google Scholar]
- 17.Wilson CT, Fisher ES, Welch HG, Siewers AE, Lucas FL. U.S. trends in CABG hospital volume: the effect of adding cardiac surgery programs. Health Affairs. 2007 Jan–Feb;26(1):162–168. doi: 10.1377/hlthaff.26.1.162. [DOI] [PubMed] [Google Scholar]
- 18.Kurtz S, Mowat F, Ong K, Chan N, Lau E, Halpern M. Prevalence of primary and revision total hip and knee arthroplasty in the United States from 1990 through 2002. Journal of Bone and Joint Surgery. 2005 Jul;87(7):1487–1497. doi: 10.2106/JBJS.D.02441. [DOI] [PubMed] [Google Scholar]
- 19.Weinstein JN, Bronner KK, Morgan TS, Wennberg JE. Trends and geographic variations in major surgery for degenerative diseases of the hip, knee, and spine. Health Aff. 2004:81–89. doi: 10.1377/hlthaff.var.81. Web Exclusive(VAR) [DOI] [PubMed] [Google Scholar]
- 20.Mitchell JB, Bubolz T, Paul JE, et al. Using Medicare claims for outcomes research. Medical Care. 1994 Jul;32(7 Suppl):JS38–JS51. [PubMed] [Google Scholar]
- 21.Katz JN, Barrett J, Mahomed NN, Baron JA, Wright RJ, Losina E. Association between hospital and surgeon procedure volume and the outcomes of total knee replacement. Journal of Bone & Joint Surgery - American Volume. 2004 Sep;86-A(9):1909–1916. doi: 10.2106/00004623-200409000-00008. [DOI] [PubMed] [Google Scholar]
- 22.Losina E, Barrett J, Mahomed NN, Baron JA, Katz JN. Early failures of total hip replacement: effect of surgeon volume. Arthritis & Rheumatism. 2004 Apr;50(4):1338–1343. doi: 10.1002/art.20148. [DOI] [PubMed] [Google Scholar]
- 23.Elixhauser A, Steiner C, Harris DR, Coffey RM. Comorbidity measures for use with administrative data. Medical Care. 1998 Jan;36(1):8–27. doi: 10.1097/00005650-199801000-00004. [DOI] [PubMed] [Google Scholar]
- 24.Quan H, Sundararajan V, Halfon P, et al. Coding algorithms for defining comorbidities in ICD-9-CM and ICD-10 administrative data. Med Care. 2005 Nov;43(11):1130–1139. doi: 10.1097/01.mlr.0000182534.19832.83. [DOI] [PubMed] [Google Scholar]
- 25.Hagen TP, Vaughan-Sarrazin MS, Cram P. Relation between hospital orthopaedic specialisation and outcomes in patients aged 65 and older: retrospective analysis of US Medicare data. BMJ. 2010;340:c165. doi: 10.1136/bmj.c165. [DOI] [PMC free article] [PubMed] [Google Scholar]
- 26.Cram P, Rosenthal GE, Vaughan-Sarrazin MS, Wolf B, Katz JN. A comparison of total hip and knee replacement in specialty and general hospitals. J Bone Joint Surg Am. 2007 Aug;89(8):1675–1684. doi: 10.2106/JBJS.F.00873. [DOI] [PubMed] [Google Scholar]
- 27.Krumholz HM, Wang Y, Chen J, et al. Reduction in acute myocardial infarction mortality in the United States: risk-standardized mortality rates from 1995–2006. JAMA. 2009 Aug 19;302(7):767–773. doi: 10.1001/jama.2009.1178. [DOI] [PMC free article] [PubMed] [Google Scholar]
- 28.Ross JS, Chen J, Lin Z, et al. Recent national trends in readmission rates after heart failure hospitalization. Circ Heart Fail. 2010 Jan;3(1):97–103. doi: 10.1161/CIRCHEARTFAILURE.109.885210. [DOI] [PMC free article] [PubMed] [Google Scholar]
- 29.Bueno H, Ross JS, Wang Y, et al. Trends in length of stay and short-term outcomes among Medicare patients hospitalized for heart failure, 1993–2006. JAMA. 2010 Jun 2;303(21):2141–2147. doi: 10.1001/jama.2010.748. [DOI] [PMC free article] [PubMed] [Google Scholar]
- 30.Jain NB, Higgins LD, Ozumba D, et al. Trends in epidemiology of knee arthroplasty in the United States, 1990–2000. Arthritis and Rheumatism. 2005 Dec;52(12):3928–3933. doi: 10.1002/art.21420. [DOI] [PubMed] [Google Scholar]
- 31.Robertsson O, Dunbar MJ, Knutson K, Lidgren L. Past incidence and future demand for knee arthroplasty in Sweden: a report from the Swedish Knee Arthroplasty Register regarding the effect of past and future population changes on the number of arthroplasties performed. Acta Orthopaedica Scandinavica. 2000 Aug;71(4):376–380. doi: 10.1080/000164700317393376. [DOI] [PubMed] [Google Scholar]
- 32.Mehrotra C, Remington PL, Naimi TS, Washington W, Miller R. Trends in total knee replacement surgeries and implications for public health, 1990–2000. Public Health Reports. 2005 May–Jun;120(3):278–282. doi: 10.1177/003335490512000310. [DOI] [PMC free article] [PubMed] [Google Scholar]
- 33.Riddle DL, Jiranek WA, McGlynn FJ. Yearly incidence of unicompartmental knee arthroplasty in the United States. Journal of Arthroplasty. 2008 Apr;23(3):408–412. doi: 10.1016/j.arth.2007.04.012. [DOI] [PubMed] [Google Scholar]
- 34.Ho V. Certificate of need, volume, and percutaneous transluminal coronary angioplasty outcomes. 2004;147(3):442–448. doi: 10.1016/j.ahj.2003.05.002. 2004/03// [DOI] [PubMed] [Google Scholar]
Associated Data
This section collects any data citations, data availability statements, or supplementary materials included in this article.


