

Abstract
We conducted a cued spatial attention experiment to investigate the time–frequency structure of human EEG induced by attentional orientation of an observer in external auditory space. Seven subjects participated in a task in which attention was cued to one of two spatial locations at left and right. Subjects were instructed to report the speech stimulus at the cued location and to ignore a simultaneous speech stream originating from the uncued location. EEG was recorded from the onset of the directional cue through the offset of the inter-stimulus interval (ISI), during which attention was directed toward the cued location. Using a wavelet spectrum, each frequency band was then normalized by the mean level of power observed in the early part of the cue interval to obtain a measure of induced power related to the deployment of attention. Topographies of band specific induced power during the cue and inter-stimulus intervals showed peaks over symmetric bilateral scalp areas. We used a bootstrap analysis of a lateralization measure defined for symmetric groups of channels in each band to identify specific lateralization events throughout the ISI. Our results suggest that the deployment and maintenance of spatially oriented attention throughout a period of 1,100 ms is marked by distinct episodes of reliable hemispheric lateralization ipsilateral to the direction in which attention is oriented. An early theta lateralization was evident over posterior parietal electrodes and was sustained throughout the ISI. In the alpha and mu bands punctuated episodes of parietal power lateralization were observed roughly 500 ms after attentional deployment, consistent with previous studies of visual attention. In the beta band these episodes show similar patterns of lateralization over frontal motor areas. These results indicate that spatial attention involves similar mechanisms in the auditory and visual modalities.
Keywords: EEG, Attention, Intended direction, Hemispheric lateralization, Induced oscillations
Introduction
Many previous EEG and fMRI studies have examined the effects of attentional orientation on the brain's response to sensory stimuli (e.g., Hillyard and Anllo-Vento 1998; Kastner et al. 1999). The primary effect observed in these studies is that larger responses are evoked by a stimulus when it is attended. Our present goal is to identify the neural events which occur when one orients attention in a single direction, even when there is no stimulus at that location. This would be the case if one were to use attentional signals to designate an intended direction for movement or exploration. Our focus is on the top-down orientation of attention in a single direction or location rather than on the bottom-up orienting elicited by a salient stimulus.
The most obvious indicators of attentional orientation are head and eye orientation. Yet even when head and eyes are oriented in a fixed direction, an observer can still attend to other directions. In experimental psychology, this is referred to as covert attention (Desimone and Duncan 1995; Egeth and Yantis 1997; Kastner and Ungerleider 2000). Covert attention involves all the spatial senses including vision, somato-sensation, and audition (Spence et al. 2000; Spence and Driver 1998). Mechanisms which selectively monitor environmental stimuli are essential to guide body, head and eye movements. Moreover, mechanisms which guide these movements are likely well suited to communicate top-down enhancement signals to sensory cortices which monitor stimuli at these locations. This reciprocal relationship between attention and movement orientation is supported by many experimental studies and theoretical models which suggest that motor programming plays a strong role in the top-down guidance of attention (Moore et al. 2003; Sheliga et al. 1994).
Several recent studies have tried to extract information on intended direction from single EEG trials by using this proposed link between attentional selection and motor programming (Wolpaw et al. 2003; Wolpaw and McFarland 2004; Fabiani et al. 2004; Wang and Makeig 2009). Several methods have been used to extract this information, and the search for novel functional methods is still underway. Wang and Makeig (2009) achieved roughly 80% success in distinguishing two directions on single trials in a delayed motor task, using independent components analysis (ICA) of event-related potentials (ERP) over lateralized posterior parietal scalp areas. The Wadsworth EEG-based Brain-computer Interface (BCI) developed by Wolpaw and colleagues utilizes sensorimotor μ and β- rhythms which subjects typically modulate using motor imagery. Moreover, Wolpaw and MacFarland (2004) successfully taught subjects to manipulate these rhythms, using a lateralization index for channels situated over sensorimotor cortex, to control the horizontal movement of a cursor on a screen.
Worden and colleagues proposed that occipital-parietal alpha rhythms may serve as an index of attentional orientation in visual tasks (Worden et al. 2000). These studies have shown a lateralization of parietal alpha rhythms when attention is selectively cued to one side of visual space, with alpha power enhanced over posterior sites ipsilateral to the cued hemifield relative to contralateral sites (Worden et al. 2000; Thut et al. 2006; Rihs et al. 2007). Attempts to classify the location of attentional orientation using occipital-parietal alpha rhythms have also met with success in MEG studies using visual stimuli (van Gerven and Jensen 2009; Bahramisharif et al. 2010). The question remains as to whether these principles extend to spatial attention in general, i.e., to what degree the networks which give rise to these lateralized rhythms are engaged during attentional selection in other modalities.
The purpose of this study is to investigate the temporal, spectral, and spatial structure of EEG while the subject orients attention toward some location in extrapersonal space. Attention in the auditory domain is particularly attractive because the auditory system can localize sources which lie outside the visual scene, including to the side of, behind, and above the observer. In the experiment described in this paper, subjects are cued verbally to anticipate a speech stimulus at one of two competing locations. An initial analysis of data from this experiment using spectral analysis of the inter-stimulus interval showed that one may decode intended direction on single trials from top-down attentional signals (Thorpe et al. 2009; Srinivasan et al. 2009). This initial analysis showed that, for some subjects, sufficient information exists in EEG data to classify intended direction correctly on over 80% of trials using auditory spatial orientation. However, no simple lateralization of EEG rhythms was apparent in the spectral structure which allowed for this successful classification of single trials.
The present work provides a deeper analysis of these data. We use wavelet analysis to investigate whether attention-related modulation not obvious in a simple spectral analysis of single trials is evident in the EEG. The wavelet analysis reveals that the neural signatures of attentional orienting are organized temporally into a sequence of discrete events. These events include lateralized activity in the θ (4–6 Hz), α (7–10 Hz), μ (11–14 Hz), and β (16–28 Hz) frequency ranges. Similar rhythms have been observed in previous BCI studies (Wolpaw and McFarland 2004), as well as electrophysiological studies of attending cats (Rougeul-Buser and Buser 1997; Buser and Rougeul-Buser 2005). Patterns of scalp activity found in the present experiment on intended direction show band specific foci over bilateral occipital, parietal and sensorimotor areas, consistent with earlier results on classification of intended direction from motor imagery (Wolpaw and McFarland 2004; Pfurtscheller et al. 2006), and fMRI studies of attentional orientation (Corbetta and Shulman 2002; Gitelman et al. 1999). Moreover, these scalp patterns show systematic lateralization which depends on the direction of attentional orientation.
Materials and Methods
Procedure
Seven subjects (6 male, 0 left-handed, 6 native English speaking) participated in the experiment. Each subject sat in a dimly lit room with two speakers. The speakers were placed at a distance of one meter from the subject's head and were positioned 45 deg to the left or 45 deg to the right, respectively (see Fig. 1). The subject was instructed to fixate on a point directly ahead, in the direction bisecting the directions to the speakers.
Fig. 1.
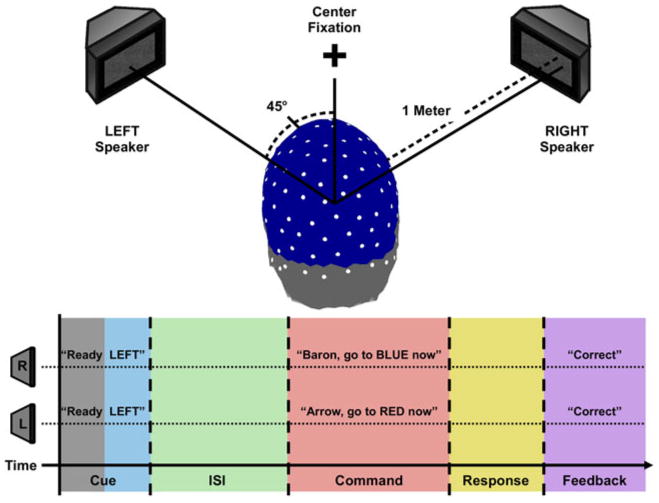
The experimental setup. a The physical layout of the experiment. Note that each speaker was 45 degrees away from fixation and could not be seen by observer without moving the eyes. b The time course of each trial in the experiment. In the example shown the subject is cued to attend to the left speaker (indicted in blue/gray). Data from the interval in which the word “Ready” was played (indicated in gray) was used to normalize wavelet spectra for each trial. After a variable ISI (500–1,500 ms, shown in green), two distinct sentences are played through each speaker (interval shown in red); the subject's task is to indicate the codeword and color played from the cued speaker (response interval shown in yellow). In the example shown, the subject responds “Arrow” and “Red”, and received feedback indicating a correct response (feedback interval indicated in purple) (Color figure online)
There were two experimental conditions: attend left and attend right. The subject was presented the spoken cue “Ready left” or “Ready right” at the onset of each trial through both speakers. After a variable interstimulus interval (ISI) of duration 500, 700, 900, 1,100, 1,300 or 1,500 ms, two different sentences were presented simultaneously: one sentence per speaker. The subjects' task was to report words in the sentence from the speaker in the cued direction. This task was made difficult by adjusting the ratio of the volumes of the cued and uncued speakers. An adaptive staircase procedure, described below, was used to set speaker volumes in a way that ensured subjects' attention to the sentence from the speaker in the cued direction. Additionally, the staircase procedure ensured that subjects performed the task at similar levels of accuracy.
The sentence stimuli were all spoken by the same male voice (cepstral David; http://cepstral.com). The sentences were based on a simplified version of sentences drawn from the Coordinate Response Measure corpus (Moore 1981). The sentences have the structure “[callsign] go to [color] now”, where possible callsign words included Arrow, Baron, Eagle and Tiger and possible color words included Blue, Green, Red, or White. The subjects' task was to identify the callsign and color words in the sentence played through the speaker in the cued direction; responses were made using a keyboard. A subject's response to a trial was judged correct if the subject indicated the callsign correctly. Choosing the response to the initial callsign word as the performance measure helped ensure that the subject directed attention to the cued speaker before the speech stimulus was played. Otherwise, the subject would miss the first word in the sentence: the callsign. The variable ISI ensured that the observer quickly deployed and maintained attention to the cued speaker at left or at right.
An adaptive staircase procedure was used to control subject performance. When the subject responded correctly to the callsign word, the volume was reduced by 5% (−0.45 dB) on the cued speaker and increased by 5% (+0.42 dB) on the uncued speaker on the next trial. When the subject responded incorrectly to the callsign word, the volume was increased by 10% (+0.83 dB) on the attended speaker and decreased by 10% (−0.92 dB) on the unattended speaker. With this procedure, subjects identified the cued callsign word correctly about 70% of the time. The amplitude of the speaker in the cued direction was typically 14 dB below that in the uncued direction. A single experimental session comprised 200 trials, presented in two 100 trial blocks with a break between. Each subject participated in three such sessions, each lasting around 1 h, for a total 600 trials per subject.
EEG Recording
EEG was recorded using a 128-channel Geodesic Sensor Net (Electrical Geodesics, Inc.) in combination with an amplifier and acquisition software (Advanced Neuro Technology, Inc.). The EEG was sampled at 1,024 Hz and on-line average referenced. Artifact editing was performed through a combination of automatic editing using an amplitude threshold and manual editing to check the results. Trials with excessive bad channels (> 15%) were first discarded; channels with excessive bad trials were then discarded. Across subjects this yielded around 100 common usable EEG channels (out of 128), and for each subject roughly 550 usable trials (out of 600).
Normalized Wavelet Analysis
EEG data were low pass filtered (50 Hz) and down sampled from 1,024 to 192 samples per second. A complex Morlet wavelet transform with frequencies centered on 4, 5, 6, 7, 8, 9, 10, 11, 12, 14, 16, 18, 20, 24, 28, 32, 36, 40 and 48 Hz was then applied to the data. This provided a time–frequency spectrum for each of 128 channels on each trial. The time–frequency spectra started at the onset of the trials' cue interval and terminated at the offset of the ISI.
In order to examine changes in the wavelet time–frequency spectra associated specifically with the onset of cued attention, the wavelet spectra for each channel of each trial were normalized by a frequency-dependent baseline power level. We used as baseline the mean wavelet power in a given frequency band over a 250 ms interval which began at the onset of the cue period. We chose this interval because it coincided with the time in which the subject heard the word “Ready”, but before the cued direction was announced, thus the normalization interval contained no information concerning attentional orientation. Moreover, the interval length of 250 ms allowed us to include a full cycle of the lowest frequency included in our analysis (4 Hz).
In order to allow a sufficient amount of time for the temporal structure of attention to unfold while still retaining a single common pool of trials for group averaging/bootstrapping, we ignored data from trials with ISI duration less than 1,100 ms, thus retaining approximately 50% of the data for each subject. Data from each attention condition was then pooled across six of our seven subjects. Due to anomalies explained in the “Results” section below, we excluded our non-native English speaker from the group analysis. The remaining trials were aligned from the onset of the cue interval to the end of the common 1,100 ms ISI and averaged across attention condition to obtain the induced time–frequency power spectrum (PC(f,t)) for each channel (C) for left correct and right correct trials respectively.
Band Specific Lateralization Index
We proceeded to analyze our data with respect to five frequency bands of interest. These were the theta (θ: 4–6 Hz), alpha (α: 7–10 Hz), mu (μ: 11–14 Hz), beta (β: 16–28), and gamma (γ: 32–48 Hz) bands. For each of the five frequency bands (B) a measure of induced band power was computed for each channel by averaging induced power for each condition over each frequency within the respective band. Scalp topographies were then computed for each band by averaging induced band power spectra over each time point of the cue and inter-stimulus intervals. In each band the resultant topographies showed clear maxima of power in pairs of bilateral channel groups which were approximately symmetric over left and right scalp hemispheres. The number and precise location on the scalp of these paired symmetric groups was band specific, but symmetric groups over left and right hemispheres (LG, RG) were always chosen to have the same number of channels. For each channel group pair in each frequency band, we defined a lateralization index (LI(t)) as the ratio of induced band power averaged over the left group and induced band power averaged over the right group:
| (1) |
Bootstrap Distributions
Empirical lateralization index bootstrap distributions were computed in order to test the null hypothesis that the lateralization index for each channel group was constant throughout the cue interval and ISI regardless of attention condition. For each time point in the interval from the beginning of the directional cue to 1,100 ms into the ISI (312 total time samples) a bootstrap sample was obtained by sampling with replacement from all trials taken from all six subjects included in our group analysis. For each bootstrap sample the lateralization index was then calculated as described above. This process was repeated 500 times for each time-point/channel-group to create lateralization index distributions with 500 elements. These distributions were then pooled across time points, and a 95% confidence interval was computed by taking the values in the resultant distribution which corresponded to the 2.5th and 97.5th percentiles. For each attention condition, time points for which the actual lateralization index was less than the 2.5th percentile or greater than the 97.5th of the empirical distribution were deemed significant (two-tailed P < 0.05, see Efron and Tibshirani 1993). In order to account for the problem of multiple comparisons we performed a post-hoc analysis of the number of significant time-points obtained for each lateralization index. If the null hypothesis holds, then the lateralization indices at each time point still have a 5% chance of attaining significance. If we assume that these false positives are binomially distributed with an underlying probability of 5%, this allows us to compute the probability of observing a given number of significant samples (N) using a binomial distribution B (312, 0.05). Thus the probability that an effect consisting of N or more false positives are observed for a given condition is given by:
| (2) |
We also applied this test to the entire set of statistical tests to determine the probability of the number of significant effects observed across all frequency bands and channel groups. Taken together, we performed a total of 4,368 total tests. For three frequency bands we had a single channel group, each with two attention conditions which tested 312 time points; for the remaining two frequency bands we had two channel groups each with two attention conditions testing 312 time points—[3 × 2 × 312] + [2 × 2 × 2 × 312] = 4,368. Thus we tested the null hypothesis that all significant effects observed throughout the experiment were due to chance using a binomial distribution B (4,368, 0.05).
Results
Behavioral Results
The staircase procedure used to set sentence volume from the speakers at left and right resulted in a remarkably consistent level of performance across most subjects, with accuracy hovering around 69% correct for the reported callsign (68.7, 68.4, 69.5, 69.2, 68.9 and 68.8% for subjects S1, S3, S4, S5, S6 and S7, respectively). Subjects were generally less accurate (mean 48.4%) and showed greater variability (standard deviation 9.8%) in performance for color words, suggesting that sustaining attention in one direction in the presence of a loud competing stimulus from the other direction was difficult. For these subjects, we observed in each session a consistent volume ratio (decibel difference) between cued and uncued speakers of around − 13.87 dB (with an average across sessions of −12.40, −16.52, −18.55, −14.69, −9.33, and −11.76 dB for subjects S1, S3, S4, S5, S6 and S7, respectively). The one exception to this was our nonnative English speaker S2, who was less accurate (61.8% for callsigns, 27.7% for colors) and who stabilized at a dB offset of +26.88, indicating a substantial increase in required signal relative to distracter volume required for correct identification of the cued callsign word. For these reasons we chose to exclude S2's data from the subsequent group analysis. On average, subjects performed similarly across all ISI conditions, which suggests that the shortest ISI duration, 500 ms, provides a sufficient window in which to orient attention fully. No obvious behavioral benefit, assessed by cued callsign word identification, was gained by letting the subject maintain attention over longer intervals.
Band Specific Time–Frequency Structure
Figure 2 shows the time–frequency structure of induced power in each band found by averaging data from all subjects across channels. Induced power time–frequency spectra for each attention condition were found by averaging across left correct (LC, Fig. 2a) and right correct (RC, Fig. 2b) trials respectively. The interval from −770 to zero ms corresponds to the cue interval in which the subjects were given the attention instruction (“Ready Left/Right”). The subset of this interval from −770 to −520 is the interval over which the mean wavelet power for each frequency band was normalized on each trial. This interval was chosen because it corresponds to the time at which the subject heard the word “Ready”, but before the announcement of the cued direction. Log induced power values during this interval are very near zero due to the fact that the mean of this interval was used as the normalization baseline. Solid gray lines indicate the offset of the normalization interval, and the onset of the interval in which the cued direction was announced. Thus the normalization interval contains no directional information. In both attention conditions the cue evoked a large response primarily in the theta, alpha, and mu frequency bands which lasted roughly 100 ms into the ISI. Solid black lines at zero ms indicate the offset of the cue interval and the onset of the ISI. Induced power in the alpha and mu bands increases markedly in both attentional conditions around 300 ms after the onset of the ISI and rises steadily until the ISI offset at 1,100 ms.
Fig. 2.
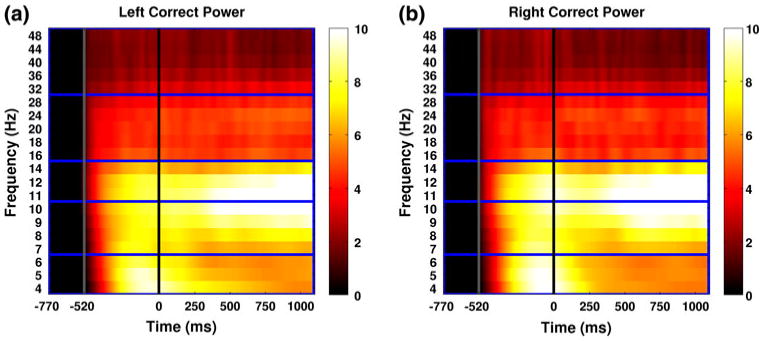
Induced power time–frequency spectra are shown in decibel units for left correct (a) and right correct (b) trials respectively. Horizontal blue lines indicate the partitioning of the 5 frequency bands: θ (4–6 Hz), α (7–10 Hz), μ (11–14 Hz), and β (16–28 Hz), and γ (32–48 Hz). The interval from −770 to zero ms corresponds to the cue interval in which the subjects were given the attention instruction (“Ready Left/Right”). The subset of this interval from −770 to −520 (corresponding to the word “Ready”) is the interval over which the mean wavelet power for each frequency band was normalized on each trial. Solid gray lines indicate the offset of the normalization interval, and the onset of the interval in which the cued direction (“Left” or “Right”) was announced. Solid black lines at zero ms indicate the offset of the cue interval and the onset of the ISI. Induced power in the alpha and mu bands increases markedly in both attentional conditions around 300 ms after the onset of the ISI and rises steadily until the ISI offset at 1,100 ms (Color figure online)
Band Specific Lateralization Within Attentional Conditions
Figures 3, 4, 5, 6, 7, 8 depict the temporal development of topographic lateralization patterns for LC and RC trials throughout the cue and inter-stimulus intervals for the various frequency bands. Topographies for each band were computed by averaging LC and RC induced band power spectra over all time points in the cue and inter-stimulus intervals. Both LC (Figs. 3, 4, 5, 6, 7, 8a) and RC (Figs. 3, 4, 5, 6, 7, 8b) topographies in each band show clear bilateral foci in channel groups situated over approximately symmetrical scalp areas in the left and right hemispheres. These channel groups are indicated by pink and blue dots on the left and right hemispheres respectively. In the alpha and mu bands additional magenta and cyan dots indicate a second pair of groupings over parietal areas. Lateralization indices for each attention condition are shown as a function of time for each of the various band specific channel groups (Figs. 3, 4, 5, 6, 7, 8c; 4d, 5d). For each channel group, green dashed lines represent the upper and lower bounds of lateralization index values which could be expected to occur given the null hypothesis that the lateralization index is constant throughout the cue and inter-stimulus intervals regardless of the direction of attentional orientation.
Fig. 3.
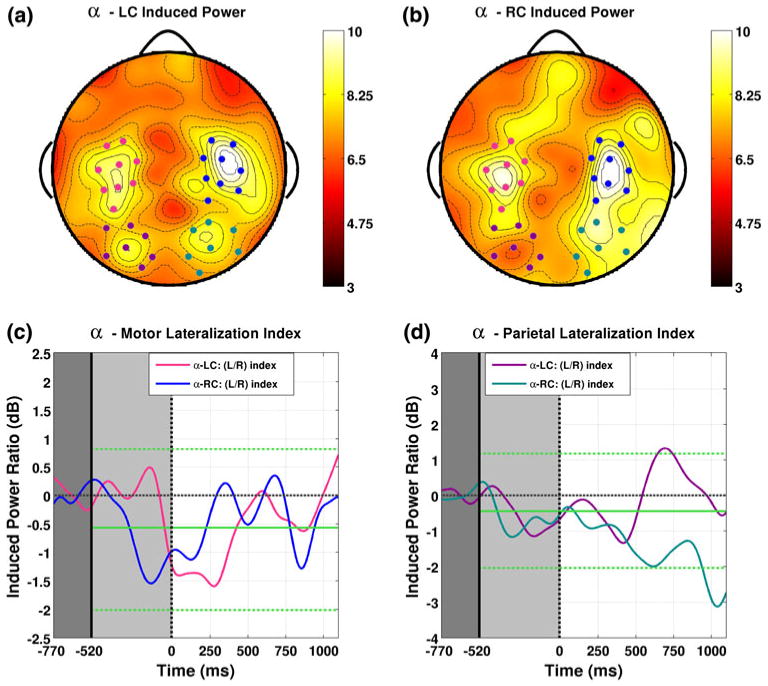
Induced alpha band power is shown averaged over the cue and ISI intervals for LC (a) and RC (b) attention conditions respectively. Two pairs of symmetric channel groups appear as peaks in the resultant band power topographies. These are situated over bilateral motor (indicated by pink/blue dots for left/right respectively), and parietal areas (indicated by magenta/cyan dots for left/right respectively). Lateralization indices for both attention conditions are shown as functions of time for the motor and parietal groups in (c) and (d) respectively. Parietal lateralization (d) for both conditions hovers near the expected mean obtained from our bootstrap (indicated by solid green lines). Around 400 ms into the ISI a divergence is evident in the direction of lateralization for each condition, indicating greater induced power over the channel group ipsilateral to attentional orientation, with positive values for LC trials and negative values for RC trials both reaching bootstrap significant levels (indicated by dashed green lines) (Color figure online)
Fig. 4.
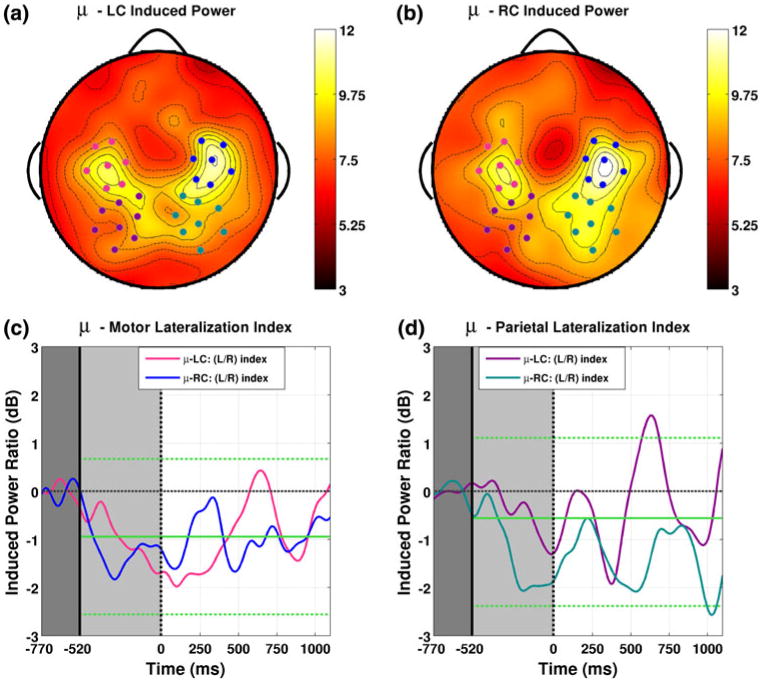
Induced band power by attention condition for the mu band (11–14 Hz) averaged over the cue and inter-stimulus intervals. Similar to the alpha band, topographies for LC (a) and RC (b) show two pairs of symmetric channel groups over bilateral motor (pink/blue for left/right) and parietal areas (magenta/cyan for left/right). Lateralization indices for the μ—motor group (c) show no significant lateralization throughout the cue and inter-stimulus intervals. However, parietal lateralization (d) within this band does reach significance and displays temporal structure for both attention conditions similar to that observed in the alpha band. Divergence between attentional conditions occurs around 400 ms into the ISI in the form of two distinct episodes of lateralization which occur roughly 400–500 ms apart and have opposite sign for each attention condition (Color figure online)
Fig. 5.
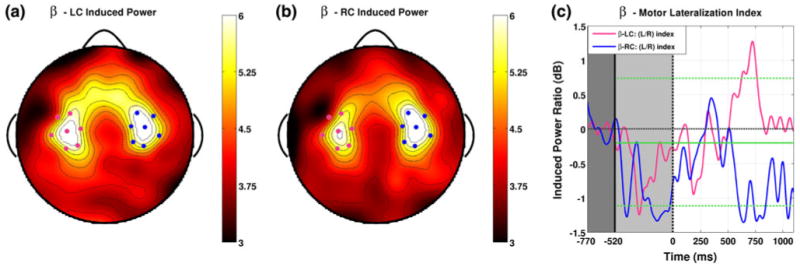
Induced beta band power for both LC (a) and RC (b) trials averaged over the cue and inter-stimulus intervals show a single pair of bilateral foci over motor areas (pink/blue for left/right). Significant negative lateralizations were observed during the cue interval for both attention conditions, possibly reflecting hemispheric asymmetries involved in speech processing or spatial orientation. Around 500 ms into the ISI the lateralization indices for attentional conditions within the β—motor group begin to diverge (c). The direction of this lateralization event is the same as that observed in the alpha and mu bands, with greater induced power over areas ipsilateral to the direction of attentional deployment (Color figure online)
Fig. 6.
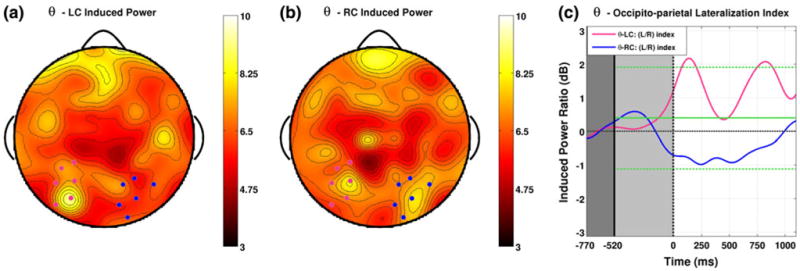
Induced theta band power topographies for left correct trials (a) show a clear peak over a group of left posterior parietal areas (indicated in pink), while for right correct trials (b) a similar group of left hemisphere channels is accompanied by a group over the right hemisphere (indicated in blue). The lateralization indices in this band show early and sustained divergence, having opposite sign for LC and RC trails for nearly the entire ISI (c). Although the negative values observed for RC trials (shown in blue) fail to reach significance, positive peaks observed for LC trials attain significance in two distinct episodes. The first of these occurs around 100–200 ms and precedes all lateralization events in other bands (Color figure online)
Fig. 7.
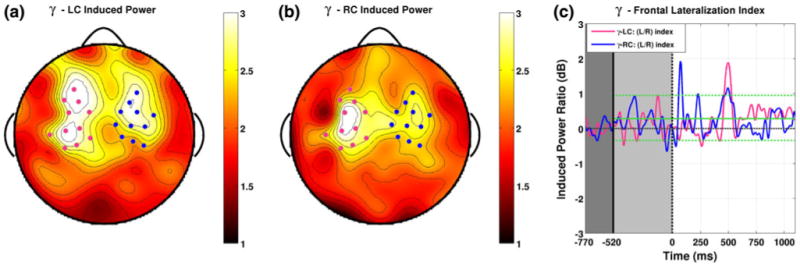
Induced power averaged over the cue and inter-stimulus intervals in the gamma band peaked at less than 3 dB as opposed to between 6 and 13 dB for other bands. Induced power in this band does show bilateral peaks for both LC (a) and RC (b) trials over frontal areas that were unique relative to all other bands. However, the lateralization indices for these groups show little systematic evidence for specific lateralization events. Instances of lateralization which reach bootstrap significance are small and unassociated with clear instances of lateralization in the opposite direction for the opposite attention condition, making the observed gamma band lateralization data hard to interpret (Color figure online)
Fig. 8.
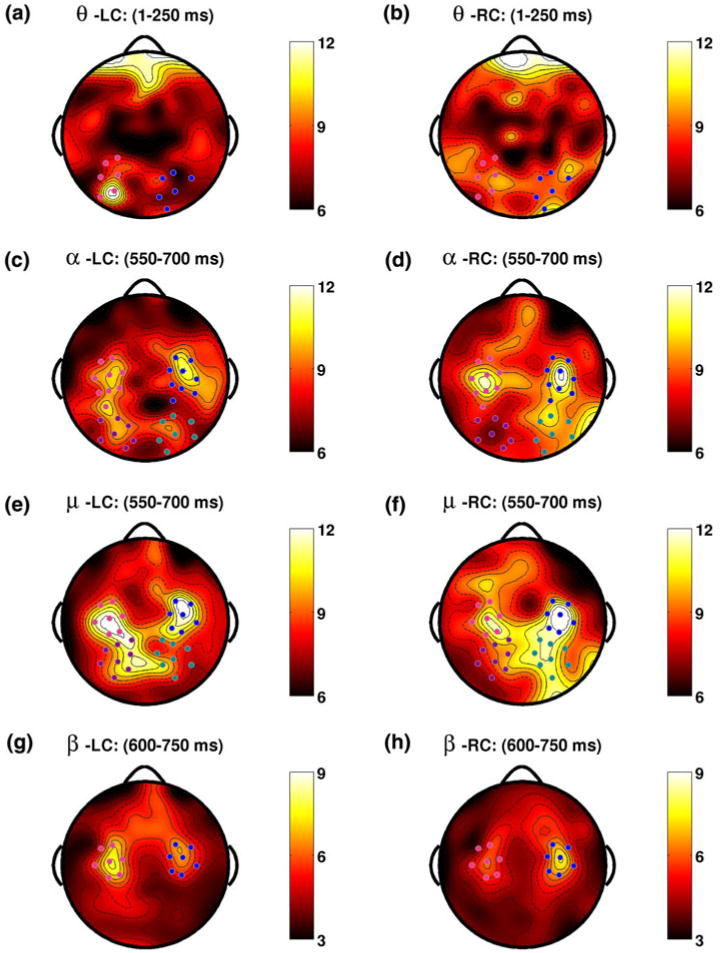
A summary of the early lateralization events observed in each band. For each band topographies are shown for the interval that best coincides with significant lateralization effects of opposite sign in each attention condition. The earliest effect is found in the theta band from 1 to 250 ms in the ISI, for which topographies are shown for LC and RC trials in (a) and (b) respectively. A group of posterior parietal channels drives this effect over the left hemisphere while a similar, smaller effect is seen in the right hemisphere. The next effects occur in the adjacent alpha (c, d) and mu (e, f) bands over parietal areas during identical 550–750 ms intervals. For both attentional conditions induced band power over the bilateral motor areas in both frequency bands is nearly the same over left and right hemispheres, while induced band power over parietal areas is lateralized with greater power over the hemisphere ipsilateral to the attentional cue. These effects are trailed closely in time by a beta band effect which shows opposite lateralizations over motor areas for LC (g) and RC (h) trials, again with greater power over the hemisphere ipsilateral to the attentional cue (Color figure online)
In order to address the problem of multiple comparisons across frequency bands and channel groupings we tested the hypothesis that all of the significant effects we observed throughout the entire experiment were due to chance. As described above in methods, we performed a total of 4,368 total tests. Of these tests a total of 309 came out significant. Assuming again that false positives are binomially distributed, the probability that these 309 significances were attained by chance is vanishingly small (P < 10e-8).
Development of Topographic Lateralization in the α-band
Figure 3 shows induced alpha band power averaged over the cue and ISI intervals for LC (Fig. 3a) and RC (Fig. 3b) attention conditions respectively. Two groups of approximately symmetric channels appear as maxima in the resultant topographies. The first of these, situated over motor areas (C3/C4 in the 10/20 system), are indicated in the left hemisphere by pink dots and in the right by blue. The temporal structure of the lateralization index for this pair of groups is shown in Fig. 3c for both LC (pink) and RC (blue) attention conditions. The lateralization index in this band shows an early negativity during the cue interval for both directions that persists throughout the initial part of the ISI. This suggests that in both conditions, less alpha band power was induced over the left hemisphere by the initial cue. However, at no point throughout the entirety of the cue or ISI intervals does the lateralization index for this group reach significant levels for either attention condition.
The second pair of channel groups apparent in this band lie over bilateral parietal areas which are indicated by magenta and cyan dots over the left and right hemispheres respectively. Figure 3d shows the temporal development of lateralization within this group for both attention conditions. Throughout the cue and initial part of the ISI, parietal lateralization for both conditions hovers near the expected mean obtained from our bootstrap. However, around 400 ms into the ISI a divergence is evident between the direction of lateralization for each condition. At around 400 ms a sharp increase in lateralization index begins for Left Correct trials, reaching significance at around 700 ms, before falling back toward the mean again towards the end of the ISI. Lateralization for Right Correct trials show an opposite pattern, nearly reaching significant negative values at around 650 ms, then showing a distinct significant negative peak at the end of the ISI around 1,000 ms. While the number of significant samples observed for LC trials (19, P = 0.15) cannot be ruled out as chance, the complimentary effect observed for RC trials (30 time samples, P < 0.01) cannot reasonably be attributed to chance. Between these two conditions it is evident that induced alpha band power clearly lateralizes over parietal areas. The direction of the observed lateralization corresponds to greater power over the hemisphere ipsilateral to the direction of attentional orientation. This result is in agreement with previous studies which have shown that alpha band power induced by spatial attention to visual stimuli lateralizes over posterior parietal areas with the same relation to the direction of orientation (Worden et al. 2000; Thut et al. 2006; Rihs et al. 2007). Moreover, the 400 ms interval we observed between cue offset and the onset of our alpha band effect matches the 400 ms observed by Rihs and colleagues and is in the range of the 500 ms observed by Worden and colleagues as well.
Development of Topographic Lateralization in the μ-band
Figure 4 shows induced band power by attention condition for the mu band (11–14 Hz) averaged over the cue and inter-stimulus intervals. Similar to the alpha band, topographies for LC (Fig. 4a) and RC (Fig. 4b) trials in this band also showed two pairs of symmetric channel groups over bilateral motor and parietal areas. Lateralization indices for the μ-motor group are shown in Fig. 4c. We observed no significant lateralization for these channels throughout the cue and inter-stimulus intervals. However, we did find significant parietal lateralization (Fig. 4d) with temporal structure for both attention conditions similar to that observed in the alpha band. For LC trials a positive peak reaches significance around 600 ms into the ISI (22 time samples, P < 0.05). The lateralization index then falls back to the mean before returning to near significant positive levels towards the end of the ISI. This pattern is mirrored by complimentary negative peaks for RC trials, the larger of which reaches significance at the end of the ISI around 1,000 ms (although at only 12 significant samples the effect size cannot be ruled out as chance).
Taken together the mu and alpha bands tell similar stories. Directing attention towards a cued speaker results in increased power over parietal areas ipsilateral to the cued direction. For both bands the patterns of lateralization are much the same throughout the cue interval and first few hundred milliseconds of the ISI. However, a marked divergence between attentional conditions occurs beginning around 400 ms into the ISI. For the mu band this divergence takes the form of two distinct episodes of lateralization which occur roughly 400–500 ms apart and have opposite sign for each attention condition.
Development of Topographic Lateralization in the β-band
Induced beta band power for both LC and RC trials throughout the cue and ISI show a single pair of bilateral foci over motor areas (Fig. 5a, b). For both attention conditions, significant negative lateralizations were observed during the cue interval (Fig. 5c). This trend was also present in the time courses for alpha and mu lateralization as well, but did not reach significance in those bands. This result is consistent with multiple interpretations. First is the possibility that directional information presented during the cue interval is associated with left hemisphere motor desynchronization regardless of the cued direction. This could be due to the inherent hemispheric asymmetry of the cortex with regards to speech processing during the cue interval (Alho et al. 1998; Poeppel 2003). Another interpretation would be that directional information present in the cue results in synchronization of beta activity over right hemisphere motor areas regardless of the cued direction, perhaps reflecting a right hemisphere cortical asymmetry associated with spatial orienting in global extrapersonal space (Fink et al. 1996; Martinez et al. 1997; Arrington et al. 2000).
Around 500 ms into the ISI the lateralization indices for attentional conditions within the β-motor group begin to diverge (Fig. 5c). For LC trials the index shows a brief significant positive peak (27 significant samples, P < 0.01) just before 750 ms then returns to near zero towards the end of the ISI. For RC trials a significant negative peak is observed around 600 ms, after which the lateralization index stays negative throughout the remainder of the ISI, reaching significance again around 750 and 1,050 ms (the total number significant samples in these three peaks is 42, P ≪ 0.01). The direction of this lateralization event is the same as that observed in the alpha and mu bands, with greater induced power over areas ipsilateral to the direction of attentional deployment. This result is similar to that obtained by Wolpaw and MacFarland in the mu band, where subjects learned to make use of mu rhythms originating from similar motor areas which lateralized with the same relationship toward intended direction.
Development of Topographic Lateralization in the θ-band
Induced theta band power topographies reveal a pair of channel groups situated over posterior parietal areas. For left correct (LC) trials one finds a clear peak over a group of left posterior parietal areas (Fig. 6a), while for right correct (RC) trials a similar group of left hemisphere channels is accompanied by an approximately symmetrical group over the right hemisphere (Fig. 6b). The time course of the lateralization index for these groups differs from that found for previous groups in two specific ways. First, the lateralization indices do not show a general trend toward negativity for both attention conditions during the cue interval. If the negative trend observed during the cue interval for previous bands are indeed associated with specific hemispheric asymmetries, then this suggests that theta band EEG is functionally distinct from activity in these other bands. Second, the temporal development of lateralization in this band shows early and sustained divergence. Lateralization indices for LC and RC trials are of opposite sign for nearly the entire ISI. Although the negative values observed for RC trials (shown in blue) fail to reach significance, this is not the case for the positive peaks observed for LC trials, which attain significance in two distinct episodes. The first of these occurs early in the ISI around 100–200 ms (25 significant samples, P < 0.01), at a time when lateralization had yet to develop in any other band; the second occurring just after 750 ms (27 significant samples, P < 0.01).
Development of Topographic Lateralization in the γ-band
The lowest levels of induced power that we observed were in the gamma band, which were typically less than 3 dB as opposed to between 6 and 13 dB for other bands. Yet induced power in this band shows bilateral peaks over frontal areas that were unique with regard to all other bands (Fig. 7a, b), being situated over more anterior areas than the motor peaks observed in the alpha, mu, and beta bands. However, the lateralization indices for these groups show little systematic evidence for specific lateralization events. The largest instance of induced power for both attention conditions comes around 500 ms into the ISI and is isolated primarily to a single channel over left frontal areas. At 13 and 8 significant samples for LC and RC trials respectively, neither peak can confidently be ruled out as chance. For RC trials, two positive peaks reach significance within the first 250 ms of the ISI. Both of these effects are small and brief and neither is associated with clear instances of lateralization in the opposite direction for LC trials. The nature of these effects and the generally low level of induced power in this band suggest there is little evidence for gamma band lateralization.
Summary of Lateralization Effects Across Bands
A concise summary of the time–frequency structure of lateralization events observed in our study is given in Figs. 8 and 9. Topographies for each of the time intervals indicated in these figures were computed for each attention condition by averaging induced band power over all time samples within the indicated interval. For each band an interval was chosen that best coincides with significant lateralization effects of opposite sign in each attention condition. For the theta band the minimum length of the chosen interval was set at 250 ms in order to contain at least one entire cycle of the lowest frequency contained in that band (4 Hz), whereas for the remaining bands the chosen interval length of 150 ms satisfies the same requirement.
Fig. 9.
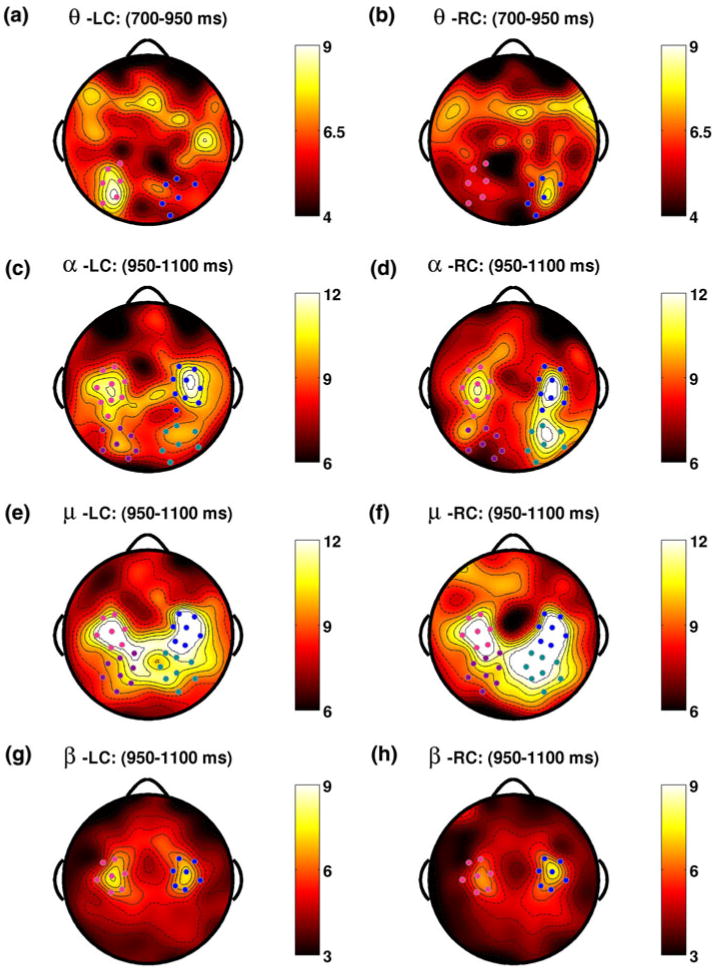
A second series of effects with a similar time–frequency relationships begins with another theta band effect around 700 ms. Topographies for both LC (a) and RC (b) trials display foci of induced band power over posterior parietal electrode groups ipsilateral to the attended direction. As in Fig. 8, this effect trailed by simultaneous effects in the alpha (c, d) and mu (e, f) bands, this time during the interval from 950 to 1,100 ms. Induced band power in both attention conditions shows lateralizes over parietal areas with the same familiar pattern: greater power induced over areas ipsilateral to attentional orientation. The final beta band effect in this same interval shows a small degree of lateralization for LC trials (g), but for RC trials the lateralization is more pronounced (h). Figure 8 and this figure together suggest that hemispheric lateralization unfolds in punctuated events throughout the attention interval, and that the direction of the lateralization consistently reflects the direction in which attention is orientated (Color figure online)
The earliest lateralization effect is found in the theta band during the interval 1–250 ms in the ISI. Topographies associated with this effect are shown for LC and RC trials in Fig. 8a and b respectively. The primary effect is driven by a group of posterior parietal channels over the left hemisphere which display elevated induced theta band power for LC trials during this interval; a similar, smaller effect is seen in the right hemisphere for LC trials. The next effects occur in the adjacent alpha and mu bands over parietal areas during identical 550–700 ms intervals (Fig. 8c–f). Note that for both attentional conditions induced band power over the bilateral motor foci in both frequency bands is nearly the same over left and right hemispheres, while induced band power over parietal areas is lateralized, coinciding with greater power over the hemisphere ipsilateral to the attentional cue. Finally, the effects in the alpha and mu bands are trailed very closely by a beta band effect which is lateralized over motor areas (Fig. 8g, h), and displays the same relationship between lateralization and attentional orientation as observed in the previous lower frequency bands.
A second series of effects with a similar time–frequency relationships begins with another theta band effect (700–950 ms; Fig. 9a, b). Here topographies for both LC and RC trials display foci of induced band power over posterior parietal electrode groups ipsilateral to the attended direction. This theta band effect is again trailed by simultaneous effects in the alpha and mu bands during the interval from 950 to 1,100 ms (Fig. 9c–f). Induced band power shows a large degree of lateralization over parietal areas with the same familiar pattern of lateralization: greater power induced over areas ipsilateral to the cued direction. The final beta band effect in this same interval (Fig. 9g, h) shows only a small degree of lateralization for LC trials, but for RC trials the same general pattern is clear. Taken together these results suggest that hemispheric lateralization with specific time–frequency structure unfolds throughout the attention interval in punctuated events, and that the direction of the lateralization is critically dependent upon the direction of attentional orientation. Interestingly, the specific time–frequency structure of the lateralization events we observed suggest that early theta band events in posterior parietal areas are trailed by events in higher frequency bands situated over more anterior scalp areas.
Discussion
The results of the experiment concern the dynamic structure of covert spatial attention. The results bear on three aspects of this structure: (1) the spatial organization of attentional networks within the brain; (2) the time course of attentional deployment, and (3) the hemispheric lateralization of attention-related activity.
Spatial Organization of Attentional Networks Within the Brain
Several neuroimaging studies undertaken during the past two decades provide compelling evidence for the involvement of specific premotor, parietal and inferior frontal cortical areas in visual spatial attention (Mesulam 1981; Posner and Petersen 1990; Pardo et al. 1991; Corbetta et al. 1998; Gittleman et al. 1999). The frontal eye fields (FEF), located at the junction of the pre-central sulcus and the superior frontal sulcus, are thought to be involved in preparation of exploratory eye movements. Areas along the intraparietal sulcus (IPS) have been hypothesized to provide various sensorimotor maps of global extrapersonal space. Regions of inferior frontal cortex, finally, are thought to provide information on the motivational relevance of expected target stimuli (Mesulam 1981).
Several more recent studies have used event-related fMRI techniques to distinguish attentional control signals from the effects of these signals on subsequent target stimulus processing (Corbetta et al. 2000; Hopfinger et al. 2000). From such studies, a model of visual spatial attention has emerged in which attentional orienting is carried out by two anatomically independent but overlapping frontoparietal networks: the dorsal (goal-oriented) and ventral (stimulus-driven) attention systems (Corbetta et al. 2000; Fox et al. 2006). The dorsal system is bilateral and includes the FEF and IPS areas. This system becomes activated in response to attentional cueing and is thought to control top-down orienting of attention. The ventral system is highly right lateralized and includes primarily regions of temporo-parietal and inferior frontal cortex. This system is excited by behaviorally relevant targets, especially by those which appear in unexpected locations, and is thought to act as a “circuit breaker” for the dorsal system: capturing attention and directing it to relevant stimuli in a bottom-up fashion.
Although the Corbetta model was proposed to account for findings concerning visual attention, a growing body of work which suggests that this framework may be extended in a natural way to auditory attention (Krumbholz et al. 2009; Wu et al. 2007; Salmi et al. 2009; Smith et al. 2009). While covert visual attention primarily involves preparation of intended eye movements, so that an object of interest may be foveated, we suggest that covert auditory attention involves preparation for intended head and body movements, so that a sound source of interest may be located directly in front of a listener, where auditory acuity is highest (Blauert 2001). This idea is supported by recent fMRI studies which show similar activation patterns are elicited when subjects are cued to make spatial judgements about stimuli in analogous auditory and visual tasks (Smith et al. 2009; Krumbholz et al. 2009). Moreover, the activated areas in these studies include all the primary areas implicated in Corbetta's dorsal network. We believe our results support the emerging idea that top-down spatial orienting of both visual and auditory attention is accomplished by a supramodal attention network including bilateral parietal and motor areas.
The results of this study are consistent with a picture in which spatial attention is accomplished by the dorsal top-down attention network. While we acknowledge that precise anatomical information concerning the brain networks underlying our effects is impossible to determine from observed scalp topographies alone, the topographies associated with the time–frequency events identified in Figs. 3, 4, 5, 6, 7, 8, 9 are at least consistent with activity arising in a bilateral network of frontal, motor, and parietal areas, possibly including FEF and areas along the intraparietal sulcus. If this could be shown to be the case, then our results suggest that the deployment of spatial attention within this network may manifest in episodic bursts of band specific activity which lateralize according to the direction of attentional orientation.
The Time Course of Attentional Deployment
An abundance of studies have probed the temporal characteristics with which humans deploy, maintain, and switch attentional focus (see Egeth and Yantis 1997 for review). These studies suggest that there are two types of attentional cueing effects which differ in their temporal response properties. Paradigms which compare peripheral to central cueing (Müller and Rabbitt 1989; Nakayama and Mackeben 1989) show that peripheral cueing at a to-be-attended location captures attention automatically and results in a fast, transient increase in performance accuracy, while central cueing to a target location provokes deliberate shifts in attention for which benefits in performance are much slower. Similar experiments performed using the rapid visual serial presentation (RSVP) paradigm have estimated the time shift for top-down goal-directed attention to lie between 300 and 500 ms (Reeves and Sperling 1986).
Weichselgartner and Sperling (1987) proposed an episodic theory of spatial attention to account for data from several types of visual attention experiments in which the focus of attention was switched from one location to another. The episodic theory suggests that spatial attention occurs in discrete space–time separable events. Attention at one location in space is likened to a spotlight which becomes active at a single location with simple exponential rise time, like a spotlight warming up. When attention is shifted to another location, the spotlight at the previous location decays (cools down) with a similar time course while the next location heats up. The spotlight analogy is useful in comparing the episodic theory to the competing analog theory, in which the spotlight moves continuously to follow the action on the stage. The episodic theory holds that attentional shifts require a fixed deployment time of around 400 ms which is independent of the distance jumped, a finding shared by numerous other studies (Sagi and Julez 1985; Kwak et al. 1991). The 400 ms required for subjects to shift attention in space, according to the episodic theory, matches nicely the duration of the interval we observed between the offset of the directional cue and the initial α, μ, and β—frequency events (Figs. 3d, 4d, 5c). The present results suggest that the emergent lateralization evident in these frequency bands after 400–500 ms may reflect the successful deployment of spatial attention.
Hemispheric Lateralization of Attention-related Activity
Compelling evidence exists which suggests that top-down modulation of sensory processing is achieved through the biasing of temporal firing patterns in sensory cortices by areas higher up in the functional attention hierarchy (see Engel et al. 2001 for review). In particular, spatial attention has been shown to increase gamma band synchrony in neural populations processing visual (Fries et al. 2001), auditory (Tiitinen et al. 1993), and somatosensory (Bauer et al. 2006) target stimuli. Fries et al. (2001) showed that individual neurons in area V4 of occipital cortex increase the synchrony of their firing with gamma band local field potentials in response to an attended stimulus. This same study also showed a complementary decrease in low frequency (<17 Hz) synchrony in both pre- and post-stimulus intervals within the same populations for which gamma synchrony was enhanced, leading the authors to conclude that low frequency desynchronization might act to enhance post-synaptic efficacy of high frequency oscillations.
A number of studies in the EEG/MEG literature have corroborated this picture and propose parieto-occipital alpha rhythms as a candidate mechanism for suppressing unattended visual information (Foxe et al. 1998; Fu et al. 2001). These studies show that parieto-occipital alpha rhythms are significantly greater when subjects are cued to attend to an upcoming auditory stimulus than when cued to attend to visual stimuli, and attribute the source of the rhythms underlying this effect to parietal regions which are part of the attention networks described above. In addition, related studies have demonstrated a lateralization of the alpha biasing signals in experiments where attention is selectively cued to one side of visual space, with alpha power most diminished in electrodes over posterior sites contralateral to the cued hemifield (Worden et al. 2000; Thut et al. 2006; Rihs et al. 2007). In this study we found clear evidence of such lateralization. Our results suggest that α-lateralization over parieto-occipital electrodes is not a phenomenon particular to visual spatial attention, but one which extends at least to spatial attention in the auditory domain as well.
Other studies suggest that neural signatures of top-down attention involve additional frequency-specific oscillations. Rougeul-Buser and Buser (1997) recorded electrocorticographic (ECoG) activity from behaving cats in sensorimotor, parietal, and occipital cortex. They observed what they termed an “expectancy rhythm” over sensorimotor cortex in the range of 10–14 Hz. These rhythms dominated periods when the animal was actively attending to an area where a mouse was expected to appear, and dissipated immediately upon arrival of the stimulus. These prototypical μ-rhythms have traditionally been thought to reflect suppression or idling of motor networks, although recent studies have challenged these assumptions (Pineda 2005). Rougel-Buser and Buser also found that periods of μ-rhythm during the expectancy period were followed immediately by brief bursts of activity in the range of 20 Hz, which the authors took to mark a transition between a passive waiting and a kind of “active or intense monitoring”. Interestingly, we observed a similar sequence of activity in these same bands (Figs. 7, 8). Moreover, the induced activity that we observed was greater over scalp areas ipsilateral to the direction of attentional orientation, specifically over parietal areas in the mu band and motor areas in the beta band. Taken together, these results suggest that relative timing of activity in the μ and β-bands provides information about the temporal structure of attentional deployment, and that the hemispheric lateralization of these rhythms over specific attentionally relevant scalp areas provides information about the direction of attentional orientation.
A final note of interest involves the interpretation of the theta band lateralization effect observed in our study. Recent studies have suggested a role for theta rhythms in the mediation of synchrony between distal neural populations distributed throughout the brain (Schack et al. 2002; Canolty et al. 2006). Sauseng et al. (2008) showed that attentional shifts to a cued hemifield facilitated theta-gamma band phase synchronization in response to validly cued targets over posterior scalp areas contralateral to the cue. Doesburg et al. (2008) carried out a study where attention was cued to one side of visual space and measured lateralized gamma-band synchrony between widespread cortical areas and posterior sites contralateral to the attended hemifield. They showed that gamma synchrony increased in punctuated bursts whose timing coincided with activity in the theta band (4–7 Hz). The authors concluded that this timing reflects the maintenance or refinement of spatial attention networks by distributed theta band activity. Although we did not observe lateralized gamma band activity over sensory cortical areas, the lateralized theta activity we did observe may well reflect a similar top-down signal which mediates the formation and maintenance of transitory attentional networks via the modulation of high frequency synchrony, which is difficult to observe in scalp recordings (Nunez and Srinivasan 2006, 2010).
Conclusions
Our results suggest that the deployment and maintenance of spatial attention in a cued direction induces hemispheric lateralization events in specific frequency bands, and that the direction of the lateralization consistently reflects the direction of attentional orientation. The specific time–frequency structure of events we observed are consistent with the notion that early theta band lateralization in posterior parietal areas facilitate shifts of attention to the cued location. Later lateralization events in α, μ frequency bands over parietal areas beginning roughly 400 ms after the directional cue and beta lateralization over motor areas may reflect successful deployment of top-down oriented spatial attention.
Acknowledgments
We thank Tom Lappas, Siyi Deng, Cort Horton, and Bill Winter for their contributions to this work. This work was supported by ARO 54228-LS-MUR, and R01-MH68004.
Contributor Information
Samuel Thorpe, Email: sthorpe@uci.edu.
Michael D'Zmura, Email: mdzmura@uci.edu.
Ramesh Srinivasan, Email: r.srinivasan@uci.edu.
References
- Alho K, Connolly JF, Cheour M, Lehtokoski A, Huotilainen M, Virtanen J, Aulanko R, Ilmoniemi RJ. Hemispheric lateralization in preattentive processing of speech sounds. Neurosci Lett. 1998;258:9–12. doi: 10.1016/s0304-3940(98)00836-2. [DOI] [PubMed] [Google Scholar]
- Arrington CM, Carr TH, Mayer AR, Rao SM. Neural mechanisms of visual attention: object-based selection of a region in space. J Cogn Neurosci. 2000;12(Supplement 2):106–117. doi: 10.1162/089892900563975. [DOI] [PubMed] [Google Scholar]
- Bahramisharif A, van Gerven M, Heskes T, Jensen O. Covert attention allows for continuous control of brain-computer interfaces. Eur J Neurosci. 2010;31(8):1501–1508. doi: 10.1111/j.1460-9568.2010.07174.x. [DOI] [PubMed] [Google Scholar]
- Bauer M, Oostenveld R, Peeters M, Fries P. Tactile spatial attention enhances gamma-band activity in somatosensory cortex and reduces low-frequency activity in parieto-occipital areas. J Neurosci. 2006;26(2):490–501. doi: 10.1523/JNEUROSCI.5228-04.2006. [DOI] [PMC free article] [PubMed] [Google Scholar]
- Blauert J. The psychophysics of human sound localization. Rev. Ed. MIT; Cambridge: 2001. Spatial hearing. [Google Scholar]
- Buser P, Rougeul-Buser A. Visual attention in behaving cats: attention shifts and sustained attention episodes are accompanied by distinct electrocortical activities. Behav Brain Res. 2005;164(1):42–51. doi: 10.1016/j.bbr.2005.05.016. [DOI] [PubMed] [Google Scholar]
- Canolty RT, Edwards E, Dalal SS, Soltani M, Nagarjan SS, Kirsch HE, Berger MS, Barbaro NM, Knight RT. High gamma power is phase-locked to theta oscillations in human neocortex. Science. 2006;313:1626–1628. doi: 10.1126/science.1128115. [DOI] [PMC free article] [PubMed] [Google Scholar]
- Corbetta M, Shulman GL. Control of goal- and stimulus-driven attention in the brain. Nat Rev Neurosci. 2002;31:201–215. doi: 10.1038/nrn755. [DOI] [PubMed] [Google Scholar]
- Corbetta M, Akbudak E, Conturo TE, Synder AZ, Ollinger JM, Drury HA, Linenweber HR, Petersen SE, Raichle ME, Van Essen DC, Shulman GL. A common network of functional areas for attention and eye movements. Neuron. 1998;21(4):761–773. doi: 10.1016/s0896-6273(00)80593-0. [DOI] [PubMed] [Google Scholar]
- Corbetta M, Kinkade JM, Ollinger JM, McAvoy MP, Shulman GL. Voluntary orienting is dissociated from target detection in human posterior parietal cortex. Nat Neurosci. 2000;3(3):292–297. doi: 10.1038/73009. [DOI] [PubMed] [Google Scholar]
- Desimone R, Duncan J. Neural mechanisms of selective visual attention. Annu Rev Neurosci. 1995;18:193–222. doi: 10.1146/annurev.ne.18.030195.001205. [DOI] [PubMed] [Google Scholar]
- Doesburg SM, Roggeveen AB, Kitajo K, Ward LM. Large scale gamma band phase synchronization and selective attention. Cereb Cortex. 2008;18:386–396. doi: 10.1093/cercor/bhm073. [DOI] [PubMed] [Google Scholar]
- Efron B, Tibshirani R. An introduction to the bootstrap. Chapman & Hall/CRC; Boca Raton: 1993. [Google Scholar]
- Egeth HE, Yantis S. Visual attention: control, representation, and time course. Annu Rev Psychol. 1997;48:269–297. doi: 10.1146/annurev.psych.48.1.269. [DOI] [PubMed] [Google Scholar]
- Engel AK, Fries P, Singer W. Dynamic predictions: oscillations and synchrony in top-down processing. Nat Rev Neurosci. 2001;2(10):704–716. doi: 10.1038/35094565. [DOI] [PubMed] [Google Scholar]
- Fabiani GE, McFarland DJ, Wolpaw JR, Pfurtscheller G. Conversion of EEG activity into cursor movement by a brain-computer interface (BCI) IEEE Trans Neural Syst Rehabil Eng. 2004;12(3):331–338. doi: 10.1109/TNSRE.2004.834627. [DOI] [PubMed] [Google Scholar]
- Fink GR, Halligan PW, Marshall JC, Firth CD, Frackowiak RSJ, Dolan RJ. Where in the brain does visual attention select the forest and the trees? Nature. 1996;382:626–628. doi: 10.1038/382626a0. [DOI] [PubMed] [Google Scholar]
- Fox MD, Corbetta M, Snyder AZ, Vincent JL, Raichle ME. Spontaneous neuronal activity distinguishes human dorsal and ventral attention systems. Proc Natl Acad Sci USA. 2006;103(26):10046–10051. doi: 10.1073/pnas.0604187103. [DOI] [PMC free article] [PubMed] [Google Scholar]
- Foxe J, Simpson G, Ahlfors S. Parieto-occipital ∼10 Hz activity reflects anticipatory state of visual attention mechanisms. NeuroReport. 1998;9:3929–3933. doi: 10.1097/00001756-199812010-00030. [DOI] [PubMed] [Google Scholar]
- Fries P, Reynolds JH, Rorie AE, Desimone R. Modulation of oscillatory neuronal synchronization by selective visual attention. Science. 2001;291(5508):1560–1563. doi: 10.1126/science.1055465. [DOI] [PubMed] [Google Scholar]
- Fu K, Foxe J, Murray M, Higgins B, Javitt D, Schroeder C. Attention-dependent suppression of distracter visual input can be cross-modally cued as indexed by anticipatory parieto-occipital alpha-band oscillations. Cogn Brain Res. 2001;12:145–152. doi: 10.1016/s0926-6410(01)00034-9. [DOI] [PubMed] [Google Scholar]
- Gitelman D, Nobre A, Parrish T, LaBar K, Kim Y, Meyer M, Mesulam M. A large-scale distributed network for covert spatial attention. Further anatomical delineation based on stringent behavioral and cognitive controls. Brain. 1999;122(6):1093–1106. doi: 10.1093/brain/122.6.1093. [DOI] [PubMed] [Google Scholar]
- Hillyard SA, Anllo-Vento L. Event-related brain potentials in the study of visual selective attention. Proc Natl Acad Sci USA. 1998;95:781–787. doi: 10.1073/pnas.95.3.781. [DOI] [PMC free article] [PubMed] [Google Scholar]
- Hopfinger JB, Buonocore MH, Mangun GR. The neural mechanisms of top-down attentional control. Nat Neurosci. 2000;3(3):284–291. doi: 10.1038/72999. [DOI] [PubMed] [Google Scholar]
- Kastner S, Ungerleider LG. Mechanisms of visual attention in the human cortex. Annu Rev Neurosci. 2000;23:315–341. doi: 10.1146/annurev.neuro.23.1.315. [DOI] [PubMed] [Google Scholar]
- Kastner S, Pinsk M, De Weerd P, Desimone R, Ungerleider L. Increased activity in human visual cortex during directed attention in the absence of visual stimulation. Neuron. 1999;22:751–761. doi: 10.1016/s0896-6273(00)80734-5. [DOI] [PubMed] [Google Scholar]
- Krumbholz K, Nobis EA, Weatheritt RJ, Fink GR. Executive control of spatial attention shifts in the auditory as opposed to the visual modality. Hum Brain Mapp. 2009;30:1457–1469. doi: 10.1002/hbm.20615. [DOI] [PMC free article] [PubMed] [Google Scholar]
- Kwak H, DagenBach D, Egeth H. Further evidence for a time-independent shift of the focus of attention. Percept Psychophys. 1991;49(5):473–480. doi: 10.3758/bf03212181. [DOI] [PubMed] [Google Scholar]
- Martinez A, Moses P, Frank L, Buxton R, Wong E, Stiles J. Hemispheric asymmetries in global and local processing: evidence from fMRI. NeuroReport. 1997;8:1685–1689. doi: 10.1097/00001756-199705060-00025. [DOI] [PubMed] [Google Scholar]
- Mesulam MM. A cortical network for directed attention and unilateral neglect. Ann Neurol. 1981;10(4):309–325. doi: 10.1002/ana.410100402. [DOI] [PubMed] [Google Scholar]
- Moore TJ. AGARD conference proceedings 331: Aural Commun Aviat. 1981. Voice communication jamming research; pp. 2:1–6. [Google Scholar]
- Moore T, Armstrong KM, Fallah M. Visuomotor origins of covert spatial attention. Neuron. 2003;40:671–683. doi: 10.1016/s0896-6273(03)00716-5. [DOI] [PubMed] [Google Scholar]
- Müller HJ, Rabbitt PM. Reflexive and voluntary orienting of visual attention: time course of activation and resistance to interruption. J Exp Psychol Hum Percept Perform. 1989;15(2):315–330. doi: 10.1037//0096-1523.15.2.315. [DOI] [PubMed] [Google Scholar]
- Nakayama K, Mackeben M. Sustained and transient components of focal visual attention. Vis Res. 1989;29(11):1631–1647. doi: 10.1016/0042-6989(89)90144-2. [DOI] [PubMed] [Google Scholar]
- Nunez PL, Srinivasan R. Electric fields of the brain: the neurophysics of EEG. 2nd. Oxford University Press; New York: 2006. [Google Scholar]
- Nunez PL, Srinivasan R. Scale and frequency chauvinism in brain dynamics: too much emphasis on gamma band oscillations. Brain Struct Funct. 2010;215:67–71. doi: 10.1007/s00429-010-0277-6. [DOI] [PMC free article] [PubMed] [Google Scholar]
- Pardo JV, Fox PT, Raichle ME. Localization of a human system for sustained attention by positron emission tomography. Nature. 1991;349:61–64. doi: 10.1038/349061a0. [DOI] [PubMed] [Google Scholar]
- Pfurtscheller G, Brunner C, Schlogl A, Lopes da Silva FH. Mu rhythm (de) synchronization and EEG single-trial classification of different motor imagery tasks. NeuroImage. 2006;31(1):153–159. doi: 10.1016/j.neuroimage.2005.12.003. [DOI] [PubMed] [Google Scholar]
- Pineda JA. The functional significance of mu rhythms: translating. Brain Res Rev. 2005;50(1):57–68. doi: 10.1016/j.brainresrev.2005.04.005. [DOI] [PubMed] [Google Scholar]
- Poeppel D. The analysis of speech in different temporal integration windows: cerebral lateralization as ‘asymmetric sampling in time’. Speech Commun. 2003;41:245–255. [Google Scholar]
- Posner M, Petersen S. The attention system of the human brain. Annu Rev Neurosci. 1990;13:25–42. doi: 10.1146/annurev.ne.13.030190.000325. [DOI] [PubMed] [Google Scholar]
- Reeves A, Sperling G. Attention gating in short-term visual memory. Psychol Rev. 1986;93(2):180–206. [PubMed] [Google Scholar]
- Rihs TA, Michel CM, Thut G. Mechanisms of selective inhibition in visual spatial attention are indexed by α–band EEG synchronization. Eur J Neurosci. 2007;23:603–610. doi: 10.1111/j.1460-9568.2007.05278.x. [DOI] [PubMed] [Google Scholar]
- Rougeul-Buser A, Buser P. Rhythms in the alpha band in cats and their behavioural correlates. Int J Psychophysiol. 1997;26(1-3):191–203. doi: 10.1016/s0167-8760(97)00764-2. [DOI] [PubMed] [Google Scholar]
- Sagi D, Julez B. Fast noninertial shifts of attention. Spat Vis. 1985;1(2):141–149. doi: 10.1163/156856885x00152. [DOI] [PubMed] [Google Scholar]
- Salmi J, Rinne T, Koistinen S, Salonen O, Alho K. Brain networks of bottom-up triggered and top-down controlled shifting of auditory attention. Brain Res. 2009;1286:155–164. doi: 10.1016/j.brainres.2009.06.083. [DOI] [PubMed] [Google Scholar]
- Sauseng P, Klimesch W, Gruber WR, Birbaumer N. Cross frequency phase synchronization: a brain mechanism of memory matching and attention. NeuroImage. 2008;40:308–317. doi: 10.1016/j.neuroimage.2007.11.032. [DOI] [PubMed] [Google Scholar]
- Schack B, Vath N, Petsche H, Geissler HG, Moller E. Phase-coupling of theta-gamma EEG rhythms during short-term memory processing. Int J Psychophysiol. 2002;44:143–163. doi: 10.1016/s0167-8760(01)00199-4. [DOI] [PubMed] [Google Scholar]
- Sheliga BM, Riggio L, Rizzolatti G. Orienting of attention and eye movements. Exp Brain Res. 1994;98:507–522. doi: 10.1007/BF00233988. [DOI] [PubMed] [Google Scholar]
- Smith DV, Davis B, Niu K, Healy EW, Bonilha L, Fridriksson J, Morgan PS, Rorden C. Spatial attention evokes similar activation patterns for visual and auditory stimuli. J Cogn Neurosci. 2009;22(2):347–361. doi: 10.1162/jocn.2009.21241. [DOI] [PMC free article] [PubMed] [Google Scholar]
- Spence C, Driver J. Crossmodal attention. Curr Opin Neurobiol. 1998;8:245–253. doi: 10.1016/s0959-4388(98)80147-5. [DOI] [PubMed] [Google Scholar]
- Spence C, Pavani F, Driver J. Crossmodal links between vision and touch in covert endogeneous spatial attention. J Exp Psychol Hum Percept Peform. 2000;26:1298–1319. doi: 10.1037//0096-1523.26.4.1298. [DOI] [PubMed] [Google Scholar]
- Srinivasan R, Thorpe S, Deng S, Lappas T, Dzmura M. Decoding attentional orientation from EEG spectra. Hum Comput Interact New Trends. 2009;5610:176–183. [Google Scholar]
- Thorpe S, Srinivasan R, Deng S, Lappas T, D'Zmura M. Decoding attentional orientation from EEG spectra. Poster presented at the annual meeting of the Society for Neuroscience; Chicago. 2009. [Google Scholar]
- Thut G, Nietzel A, Brandt SA, Pascual-Leone A. Alpha-band electroencephalographic activity over occipital cortex indexes visuospatial attention bias and predicts visual target detection. J Neurosci. 2006;26(37):9494–9950. doi: 10.1523/JNEUROSCI.0875-06.2006. [DOI] [PMC free article] [PubMed] [Google Scholar]
- Tiitinen HT, Sinkkonen J, Reinikainen K, Alho H, Lavikainen J, Naatanen B. Selective attention enhances the auditory 40-Hz transient response in humans. Nature. 1993;364(6432):59–60. doi: 10.1038/364059a0. [DOI] [PubMed] [Google Scholar]
- van Gerven M, Jensen O. Attention modulations of posterior alpha as a control signal for two-dimensional brain-computer interfaces. J Neurosci Methods. 2009;179(1):78–84. doi: 10.1016/j.jneumeth.2009.01.016. [DOI] [PubMed] [Google Scholar]
- Wang Y, Makeig S. Predicting intended movement direction using EEG from human posterior parietal cortex. Found Augment Cogn Neuroergon Oper Neurosci. 2009;5638:437–446. [Google Scholar]
- Weichselgartner E, Sperling G. Dynamics of automatic and controlled visual attention. Science. 1987;238:778–780. doi: 10.1126/science.3672124. [DOI] [PubMed] [Google Scholar]
- Wolpaw JR, McFarland DJ. Control of a two-dimensional movement signal by a noninvasive brain-computer interface in humans. Proc Natl Acad Sci USA. 2004;101(51):17849–17854. doi: 10.1073/pnas.0403504101. [DOI] [PMC free article] [PubMed] [Google Scholar]
- Wolpaw JR, McFarland DJ, Vaughan TM, Schalk G. The Wadsworth Center brain-computer interface (BCI) research and development program. IEEE Trans Neural Syst Rehabil Eng. 2003;11(2):204–207. doi: 10.1109/TNSRE.2003.814442. [DOI] [PubMed] [Google Scholar]
- Worden M, Foxe J, Wang N, Simpson G. Anticipatory biasing of visuospatial attention indexed by retinotopically specific alpha band electroencephalography increases over occipital cortex. J Neurosci. 2000;20(63):1–6. doi: 10.1523/JNEUROSCI.20-06-j0002.2000. [DOI] [PMC free article] [PubMed] [Google Scholar]
- Wu CT, Weissman DH, Roberts KC, Woldorff MG. The neural circuitry underlying the executive control of auditory spatial attention. Brain Res. 2007;1134:187–198. doi: 10.1016/j.brainres.2006.11.088. [DOI] [PMC free article] [PubMed] [Google Scholar]