Abstract
Blinks and saccades cause transient interruptions of visual input. To investigate how such effects influence our perceptual state, we analyzed the time courses of blink and saccade rates in relation to perceptual switching in the Necker cube. Both time courses of blink and saccade rates showed peaks at different moments along the switching process. A peak in blinking rate appeared 1,000 ms prior to the switching responses. Blinks occurring around this peak were associated with subsequent switching to the preferred interpretation of the Necker cube. Saccade rates showed a peak 150 ms prior to the switching response. The direction of saccades around this peak was predictive of the perceived orientation of the Necker cube afterwards. Peak blinks were followed and peak saccades were preceded by transient parietal theta band activity indicating the changing of the perceptual interpretation. Precisely-timed blinks, therefore, can initiate perceptual switching, and precisely-timed saccades can facilitate an ongoing change of interpretation.
Keywords: Ambiguous figure, Necker cube, Saccade, Blink, Perceptual organization
Introduction
When an ambiguous figure is presented continuously for a certain period of time, observers report perceptual switching; the perception of the figure reverses spontaneously (Attneave 1971; Ellis and Stark 1978; İşoğlu-Alkaç et al. 1998, 2000; Ito et al. 2003; Murata et al. 2003; Nakatani and van Leeuwen 2005, 2006; Peterson and Gibson 1991; Toppino 2003; van Dam and van Ee 2006). Whereas there are no changes to the external figure itself, two things keep changing: our eyes move continuously and our brain activity evolves dynamically. The contribution of each of these to the switching process has been studied quite extensively; electroencephalogram (EEG) activity has been recorded in order to identify the moment when switching takes place (e.g. İşoğlu-Alkaç et al. 1998, 2000). Other studies, however, have shown that there is no such unique moment in the dynamics of EEG activity, and that switching is a process that extends over several hundreds of milliseconds (Nakatani and van Leeuwen 2005, 2006). As for eye-movements, it is well known that eye-fixation location biases the interpretation of ambiguous figures (Einhäuser et al. 2004; Ellis and Stark 1978; Hochberg and Peterson 1987; Kawabata 1986; Kawabata et al. 1978; Ruggieri and Fernandez 1994; Toppino 2003). This effect may be due to a sustained effect of top-down attention (Peterson and Gibson 1991). Here, we raise the issue whether there is also a transient effect of oculomotor events, such as blinks and saccades, on perceptual switching in ambiguous figures.
Blinking relates to the deployment of attentional resources to visual information (Stern et al. 1993; Veltman and Gaillard 1998; Zangemeister et al. 1995). Blink frequency is sensitive to cognitive demand: it decreases when a task requires massive engagement with a visual stimulus (Veltman and Gaillard 1998). Blinking frequency would tend to increase after the switching response is completed. On the other hand, blinking could have an active role in the switching. Blinking leads to transient interruptions of visual input. Such a perturbation could, in principle, destabilize the percept and increase the probability of perceptual switching. Consistent with this expectation, transient perturbation to an ambiguous figure, produced by illuminating the background in a brief flash, was reported to enhance the rate of switching (Kanai et al. 2005). Therefore, whether blinking occurs as a cause of or as a response to the switching remains open to investigation.
In a similar perspective, we considered saccades. Saccades are closely associated with shifts in spatial attention. Neuroimaging studies using functional magnetic resonance imaging (fMRI) showed that common neural substrates in the posterior parietal cortex are responsible for both switching and shifts of attention (Slotnick and Yantis 2005). Facilitation of switching though attention shifts may be manifested in the associated saccades. Consistent with this view, Ito et al. (2003), reported that the probability of saccades increases prior to switching responses. On the other hand, Ellis and Stark believed that prolonged fixation leads to perceptual switching, and proposed that longer fixation durations (and hence reduction in saccades) are associated with the time to construct a new percept (Ellis and Stark 1978). The role of saccades in perceptual switching, therefore, remains open to further investigation.
In order to understand the function of oculomotor events in perceptual switching, measuring oculomotor events simultaneously with EEG might be useful. EEG activity provides high-resolution temporal information about the switching process. To investigate whether blinks and saccades have an active role in the switching, we sought to identify the time-line of oculomotor and brain activities that systematically relate to perceptual switching. We presented observers with one of the best-known ambiguous figures: the Necker cube (Attneave 1971; Einhäuser et al. 2004; Ellis and Stark 1978; İşoğlu-Alkaç et al. 1998, 2000; Murata et al. 2003; Nakatani and van Leeuwen 2005, 2006; Peterson and Gibson 1991; van Dam and van Ee 2006). The cube is presented as a wire-frame image on a 2-dimensional display, its parallel edges drawn as parallel lines of the same length. This renders the figure ambiguous in terms of its perceived depth. The cube is typically seen either pointing down with the lower face forward or pointing up with the upper face forward. Observers viewed the Necker cube for several minutes and reported perceptual reversals by button press, while we simultaneously recorded their eye-movements and EEG activity.
Methods
Participants
Six participants (1 male and 5 female, aged 21–34) with normal or corrected-to-normal vision participated in this study. They were paid 1,000 yen per hour for their participation. Participants gave their written informed consent. The Research Ethics Committee of the RIKEN had approved our procedures.
Experimental design
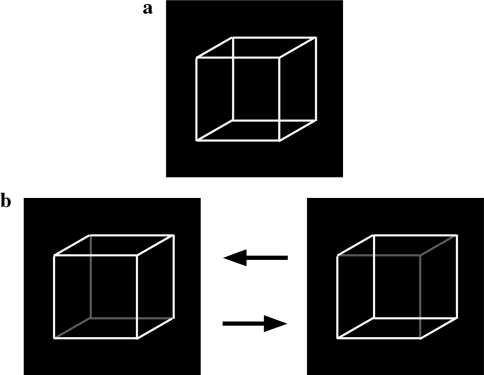
The experiment consisted of two conditions: a perceptual switching (PS) condition and a stimulus initiated (SI) condition. In the PS-condition, a Necker cube (Fig. 1a) was continuously presented for 4 min as a white line-drawing, subtending 5° of visual angle, on a black ground. The stimulus was shown at eye-height on a flat-panel monitor (FlexScan L675, EIZO) in a sound proof room with reduced ceiling illumination. Participants were seated comfortably at a distance of 85 cm from the monitor. Since the Necker cube predominantly tends to be perceived as pointing in two different directions, participants pressed a response button corresponding to the perceived direction using their dominant hand. They were instructed to do so whenever their visual percept of the Necker cube reversed but not when it merely became inconsistent or vague.
Fig. 1.
Visual stimuli in our experiment. The visual angle of the stimuli in both the PS and SI-conditions was 5.0°. a In the PS-condition, the Necker cube was presented as a white line drawing on a black ground. The stimulus was continuously presented for 4 min. b In the SI-condition, two biased versions of the Necker cube were presented alternately at the same location. Each figure was continuously presented for a variable time interval of 5.0–10.0 s (mean: 7.5 s) as a white line drawing on a black ground
In the SI-condition, two biased versions of the Necker cube (Fig. 1b) were presented alternately at the same location. Each cube was continuously presented for a variable time interval of 5.0–10.0 s (mean 7.5 s; standard deviation 1.8 s; uniform distribution). Whenever observers detected that one figure was changed into the other, they pressed the appropriate button.
Switching may fail to occur if participants know only one of the possible interpretations of an ambiguous figure (Rock et al. 1994). To assure that all participants started with equal information, they were advised before the experiment that the Necker cube used in the PS-condition has two alternative interpretations, that they might experience their perception to be switching from one to another, and that they should press the appropriate button whenever this occurred. Note that the biased version of the Necker cube used in the SI-condition also has some residual ambiguity in terms of its perceived depth. After the experiment, therefore, we asked participants whether they had experienced any switching in the SI-condition.
Before a stimulus presentation, participants fixated on a dot in the center of the monitor. Next, the stimulus appeared in the center of the screen. Participants were instructed to direct their fixation within the range of the Necker cube during stimulus presentation. A session consisted of 4 min of the PS-condition followed by 4 min of the SI-condition, with a short (2 min) break in-between. The total experiment included 3 sessions separated by 10 min breaks. The experiment took 60 min approximately to complete.
Oculomotor events measurement
Oculomotor events (blinks and saccades) were measured with an SR Research Eyelink system in three participants and an SR Research Eyelink 1000 system in the others. Both are video-based eye-tracking systems. The first system uses a head-mounted camera with a sampling frequency of 250 Hz for eye-tracking. We used a chin rest to suppress head-movement. The other system uses a camera with a sampling frequency of 500 Hz mounted on a fixed device that also contained the chin rest. As the first system was broken halfway during our study, we used the other system for the remaining participants. We presented the stimulus to both eyes, and measured eye-events from the dominant eye. Simultaneously with eye-event recording, we also measured the electroencephalogram (EEG). EEG measurement is described in “EEG measurement”.
Temporal distributions of oculomotor events
Observers indicated switching by a button press. We plotted oculomotor-events in alignment to the switching response, in order to obtain their time curves. If certain oculomotor-events, or their omission, is time-locked to the switch response, a positive or negative peak would occur, respectively, at a specific interval in its time curve. Choosing the button press responses as the reference (0 ms), we calculated the occurrence probability of oculomotor-events within 100 ms width bin with 50 ms overlap. We calculated their temporal probability distributions for each individual participant, standardized these by a Z-transform, and averaged them.
Blinks and saccades were registered by the eye-tracking system. The system determined blinks as pupil missing periods. In addition, blinks are preceded by partial occlusion of the pupil, and the eye-tracking system reports these as changes in eye-position. We therefore determined blink onset time by the onset of pupil position change, whenever this was followed by pupil disappearance and classified as saccades all abrupt changes of pupil position without subsequent disappearance of the pupil.
Relationship between oculomotor events and perceptual preference
Perceptual ambiguity does not imply that two alternative interpretations are equally prominent. There is typically a preferred interpretation that observers tend to see first and for longer periods. These two interpretations may differ in the way they are related to blinks as well as saccades. For this reason, when we found oculomotor events to be time-locked to switches, we analyzed the time curves separately whether they occur in relation to a switch to or away from the preferred interpretation.
Relationship between saccade and switching directions
One of the aims of our approach is to analyze whether and how transient shifts in eye position bias the perception of the figure. A relationship between saccade direction at some time during the switching process and the orientation of the percept afterwards may be expected, based on earlier results in Attneave triangles (Ito et al. 2003) and on the notion that saccades are usually associated with transient shifts in attention. The focus of sustained attention biases the perception of the Necker cube (Peterson and Gibson 1991). To test whether and how saccades bias the perception of an ambiguous figure, we analyzed the time curves of saccades in relation to saccade and switching directions.
EEG measurement
Disk-type Ag/AgCl electrodes were placed on O1, O2, P3, Pz, P4, F3, Fz, and F4 recording sites in accordance with the international 10/20 system. When the SR Research Eyelink 1000 system was used for eye-events measurement, it was possible to place additional electrodes on C3, Cz, and C4 recording sites. Reference and ground electrodes were placed on left and right ears of each participant, respectively. Vertical and horizontal electrooculogram (EOG) were also recorded. Signals were amplified and band-limited with differential amplifiers and first-order band-pass filters (MEG-6116, Nihon Kohden). Gains were 94 dB for EEG signals and 80 dB for EOG signals, and cut-off frequencies were 0.08 Hz and 100 Hz. The input impedance of the amplifiers was 100 MΩ. Signals were digitized with a 12 bits analog-to-digital converter (AD12-64, Contec) at 500 Hz and stored on the hard disk of a PC (Precision 340, Dell).
EEG analysis
We used independent component analysis (Hyvärinen and Oja 2000) to reduce oculomotor artifacts in EEG recordings. Using the FastICA algorithm (Hyvärinen and Oja 1997), we decomposed the recordings and reconstructed them after those components that had large correlation with vertical or horizontal EOG had been removed.
In order to analyze EEG in the time–frequency domain, we produced scalograms by using a continuous wavelet transform. The mother function of the wavelet transform was the complex Gabor function  ,
,
 |
1 |
where  .
.
Wavelet coefficients of a signal  were obtained as follows;
 |
2 |
where  is the complex conjugate of a complex Gabor function.
Amplitude  of EEG in the time–frequency domain was normalized by the mean amplitude
  at each frequency f:
 |
3 |
where T is the duration of EEG measurements, 12 min for the PS and SI-conditions, respectively.
Statistical testing with bootstrap resampling
We used the bootstrap resampling method (Efron 1979; Efron and Tibshirani 1986) to evaluate the statistical difference in parameters of interest such as amplitude of the time curves of oculomotor events and amplitude of EEG activity between conditions.
For instance, we calculated the difference in probability of blinking at a time, t, between switching to one direction,  , and that to the other direction,
  ,
,
 |
4 |
The null hypothesis to be tested is that blinking at a time, t, do not bias the direction of perceptual switching. That is,
 |
5 |
We generated bootstrap parameters for  that satisfy the null hypothesis defined by Eq. (5). The distribution of these bootstrap parameters is used to evaluate the statistical significance of
  . We first generated the bootstrap parameters for the probability of blinking associated with switching to one direction,
  , and that with the other direction,
  , by sampling with replacement of switching trials in which blinking occurred at a time, t. The bootstrap replication number was 1,000. We calculated these parameters as follows;
 |
6 |
where
 |
7 |
 and
and  are, respectively, the number of switching trials in which blinking was associated with perceptual switching to one direction and that with other direction.
  and
and  are means of
  and
and  , respectively. As the mean of
  is zero, the distribution of
  can be considered as the distribution for
  , in case it satisfies the null hypothesis. We evaluated the P value of the observed
  from the distribution of
  . Bootstrap statistical tests for other parameters were performed in an analogous manner.
Results
We report here first on properties of perceptual preference, next on blinks and saccades in the perceptual switching process, and finally on the EEG activity that appeared jointly with blinks or saccades. Behavioral properties of each participant such as numbers of perceptual switching, blinks and saccades, and mean reaction time to the stimulus changes are shown in Tables 1 and 2.
Table 1.
Behavior of individual participants
| Participant | Number of switching | Number of blinks | Number of saccades |
|---|---|---|---|
| A | 173 | 325 | 311 |
| B | 255 | 488 | 461 |
| C | 190 | 441 | 1,037 |
| D | 141 | 107 | 304 |
| E | 137 | 133 | 1,156 |
| F | 226 | 135 | 998 |
Numbers of perceptual switching, blinks and saccades during the entire 12 min of the PS-condition
Table 2.
Behavior properties of individual participants
| Participant | Number of blinks | Number of Saccades | Mean reaction time (ms) |
|---|---|---|---|
| A | 420 | 349 | 572 |
| B | 535 | 419 | 806 |
| C | 612 | 918 | 550 |
| D | 125 | 497 | 398 |
| E | 242 | 1,304 | 562 |
| F | 271 | 1,332 | 556 |
Numbers of blinks and saccades, and mean reaction time to the stimulus changes during the entire 12 min of the SI-condition
Perceptual preference in the Necker cube
Table 3 shows the average perceptual duration of each perceived orientation in the PS-condition. All participants except for Participant-D showed longer perceptual durations for the “downward” than for the “upward” orientation. The “downward” orientation is, thus, the preferred orientation for participants except for Participant-D. In each experimental trial of the PS-condition, when the Necker cube first appeared the initial percept was always the preferred orientation. These observed preferences in switching direction were also consistent with what participants reported after the experiment.
Table 3.
Perceptual preference in the Necker cube
| Participant | Mean duration of downward interpretation (s) | Mean duration of upward interpretation (s) | Preferred interpretation |
|---|---|---|---|
| A | 4.65 | 3.24 | Downward |
| B | 3.10 | 2.45 | Downward |
| C | 4.59 | 2.72 | Downward |
| D | 4.01 | 5.78 | Upward |
| E | 6.36 | 3.84 | Downward |
| F | 4.00 | 2.22 | Downward |
Average perceptual durations of each interpretation of the Necker cube
Although the biased version of the Necker cube used in the SI-condition has a certain degree of ambiguity in terms of its perceived depth, observers rarely reported that they experienced switching for the biased cubes. We therefore were able to use the data from the SI-condition to evaluate the data in the PS-condition.
Blinks associated with perceptual switching
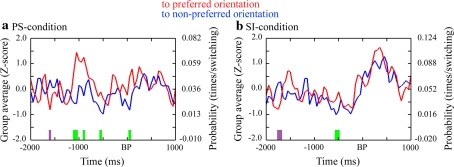
Figure 2 shows the time curves of blink probabilities in the PS and SI-conditions. In the PS-condition (Fig. 2a), the time curve showed a peak at 1,000 ms-prior to the button press response. This peak was associated with perceptual switching to the preferred interpretation of the Necker cube (P < 0.005, comparison between preferred and non-preferred interpretations). Table 4 shows for each participant the timing of the peak and the number of blinks around the peak. There was no such peak in the SI-condition (Fig. 2b). The SI-condition showed a large peak after the response, irrespective of direction of stimulus changes. We may conclude that blinks at 1,000 ms-prior to the response selectively facilitated perceptual switching to the preferred interpretation of the Necker cube.
Fig. 2.
Comparison of blink probabilities between perceptual switching to preferred and non-preferred orientations in the PS-condition (a) and those between stimulus change to preferred and non-preferred orientations in the SI-condition (b). Temporal frequency distributions of blink probabilities in individual participants were Z-transformed and subsequently averaged across participants. The color red denotes blink probabilities for perceptual switching or stimulus change to the preferred orientation. Blue denotes blink probabilities for perceptual switching or stimulus changes to the non-preferred orientation. Green denotes periods in which perceptual switching or stimulus change to the preferred orientation showed larger blink probabilities (P < 0.005). Purple denotes periods in which perceptual switching or stimulus change to non-preferred orientation showed larger blink probabilities (P < 0.005)
Table 4.
Peaks in the temporal distributions of blink probability in the PS-condition for individual participants
| Participant | Peak-timing (ms) | Number of blinks |
|---|---|---|
| A | −1,050 | 14 |
| B | −1,000 | 31 |
| C | −850 | 33 |
| D | −1,050 | 4 |
| E | −1,100 | 4 |
| F | −800 | 9 |
Peak-timing indicates the time bin where the time-series of blink probabilities associated with switching to the preferred interpretation of the Necker cube showed a peak. Timing of blinks was aligned with timing of switching responses. Numbers of blinks in the bin that corresponds with the peak probability are also shown
Saccades associated with perceptual switching
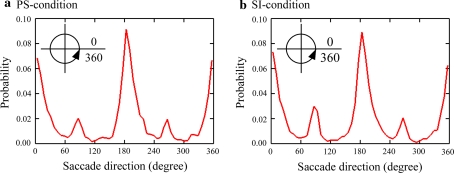
Figure 3 shows the probability distribution of the saccadic directions averaged across participants. Leftward (130°–240°) and rightward (300°–60°) saccadic movements were predominant, about equally in the PS and SI-conditions.
Fig. 3.
Probability distributions averaged across participants of saccadic directions in the PS-condition (a) and the SI-condition (b)
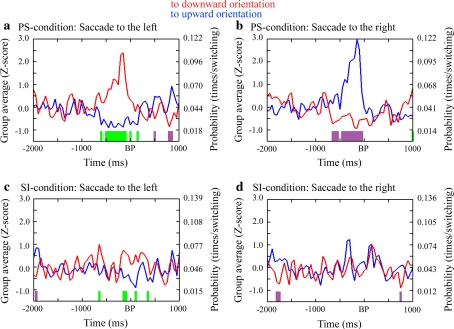
We analyzed the possible correspondence between the direction of saccades and the perceived orientation of the Necker cube after the switch. Figure 4 shows the time curves of saccadic probabilities when saccades occurred to the left and the right in the PS and SI-conditions, separately. Leftward saccades 150 ms-prior to the button press responses in the PS-condition were preferentially associated with switching to downward interpretation of the Necker cube, as they showed higher probabilities when the switching occurred to a downward interpretation than when the switching occurred to a upward interpretation (P < 0.005, Fig. 4a). Rightward saccades 150 ms-prior to the responses in the PS-condition were preferentially associated with switching to the upward interpretation (P < 0.005, Fig. 4b). Table 5 shows for each participant the timing of the peak and the number of saccades around the peak. On the other hand, in the SI-condition, saccadic direction had no systematic relationship with the direction of stimulus changes (Fig. 4c, d).
Table 6.
Fig. 4.
Relationship between saccadic direction and orientation of the Necker cube. Temporal distributions of saccadic probabilities aligned with perceptual switching in the PS-condition or stimulus change in the SI-condition were Z-transformed and subsequently averaged across participants. a Saccades to the left in the PS-condition. b Saccades to the right in the PS-condition. c Saccades to the left in the SI-condition. d Saccades to the right in the SI-condition. Red curves represent saccadic probabilities for perceptual switching or stimulus change to the downward orientation. Blue curves represent saccadic probabilities for perceptual switching or stimulus change to the upward orientation. Green denotes periods in which perceptual switching or stimulus change to the downward orientation showed larger saccadic probabilities (P < 0.005). Purple denotes periods in which perceptual switching or stimulus change to the upward orientation showed larger saccadic probabilities (P < 0.005)
Table 5.
Peaks in the temporal distributions of saccadic probability in the PS-condition for individual participants
| Participant | Peak-timing (ms) | Number of saccades |
|---|---|---|
| A | −300 | 20 |
| B | −200 | 28 |
| C | −150 | 54 |
| D | −150 | 19 |
| E | – | – |
| F | −300 | 35 |
Peak-timing indicates the bin where the time-series of saccadic probabilities showed a peak. Timing of saccades was aligned with timing of switching responses. Numbers of saccades in the bin that corresponds with the peak probability are also shown (Participant-E did not show a large peak in saccadic probabilities.)
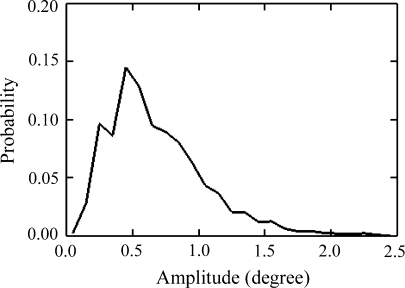
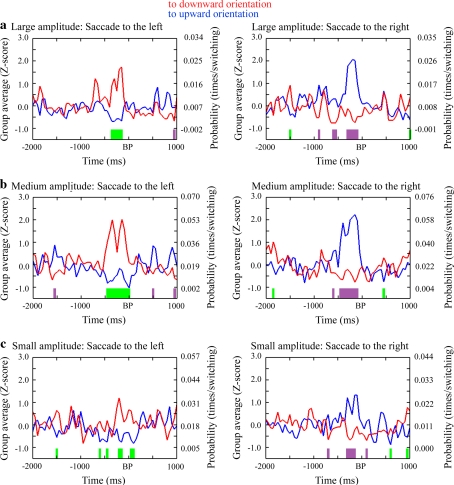
Figure 5 shows the variability in saccadic amplitude in the PS-condition. We considered whether there was any relationship between saccadic amplitude and perceptual switching. Saccades were classified based on their amplitude into “Large”: greater than 1.0°, “Medium”: between 0.5° and 1.0°, and “Small”: smaller than 0.5°. For these three categories, we analyzed separately the time curves of saccadic probabilities when saccades occurred to the left and the right (Fig. 6). Leftward and rightward saccades prior to the button press responses were preferentially associated with perceptual switching to downward and upward interpretations, respectively, approximately equally across saccade size categories.
Fig. 5.
PS-condition: probability distribution of saccadic amplitudes. The values are averaged across participants
Fig. 6.
PS-condition: effect of saccadic amplitude on directions of perceptual switching. Saccades were classified into three groups based on their amplitude. “Large” saccades had an amplitude > 1.0°. “Medium” saccades had an amplitude between 0.5° and 1.0°. “Small” saccades had an amplitude < 0.5°. a–c Relationships between, respectively, the direction of “Large”, “Medium”, and “Small” saccades, and orientation of the Necker cube. Red curves represent saccadic probabilities for perceptual switching to the downward orientation. Blue curves represent saccadic probabilities for perceptual switching to the upward orientation. Green denotes periods in which perceptual switching to the downward orientation showed larger saccadic probabilities (P < 0.005). Purple denotes periods in which perceptual switching to the upward orientation showed larger saccadic probabilities (P < 0.005)
EEG activity accompanying switching-related blinks and saccades
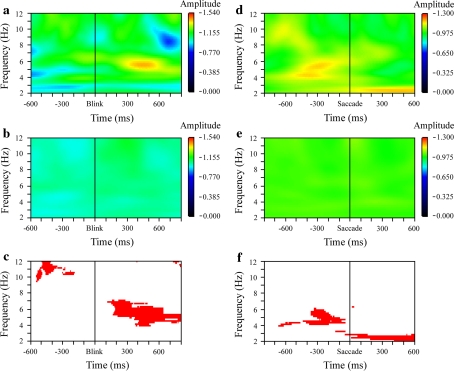
If blinks at the peak, 1,000 ms-prior to the button pressed switching response, selectively facilitate perceptual switching to the preferred interpretation of the Necker cube (Fig. 2a), a characteristic EEG activity that reflects the switching process might accompany these blinks. We found a transient period of theta band activity in the parietal area (Pz-recording site) that followed these blinks (Fig. 7a). When blinks occurred at a different timing, such theta band activity was not observed (Fig. 7b).
Fig. 7.
PS-condition: parietal theta band activity that accompanied perceptual switching-related blinks or saccades. The EEG activity in the parietal area (Pz) was normalized by the mean amplitude at each frequency, aligned with blink-onset or saccadic-onset, and averaged across the switching events and participants. a When switching involved a blink in the bin where the time curve of blink probabilities showed a peak at 1,000 ms-prior to the button press responses, corresponding Pz-recordings were aligned with blink-onset and averaged. The numbers of blinks used for averaging are shown in Table 4. b Pz-recordings were aligned with blink-onset and averaged. Blinks in the bin where the time curve of blink probabilities showed a peak at 1,000 ms-prior to the responses were excluded. The numbers of blinks used for averaging are shown in Table 6. c Statistical difference in Pz-recordings between a and b. The color red denotes that amplitude in a was larger than that in b (P < 0.01). d When the switching events involved a saccade in the bin where the time curve of saccadic probabilities showed a peak 150 ms-prior to the responses, corresponding Pz-recordings were aligned with saccadic-onset and averaged. The numbers of saccades in each participant are shown in Table 5. e Pz-recordings were aligned with saccadic-onset and averaged. Saccades in the bin where the time curve of saccadic probabilities showed a peak 150 ms-prior to the responses were excluded. The numbers of blinks used for averaging are shown in Table 6. f Statistical difference in Pz-recordings between d and e. The color red denotes that amplitude in d was larger than that in e (P < 0.01)
We also found a transient period of theta band activity related to the saccades occurring 150 ms prior to the switch response. Directions of these saccades were predictive of subsequent switching directions (Fig. 4a, b). The theta band activity preceded these saccades (Fig. 7c). When saccades occurred at different timing from 150 ms-prior to the response, such theta band activity was not observed (Fig. 7d).
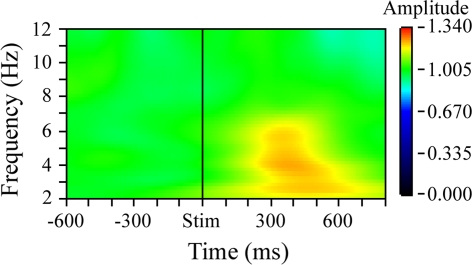
If the parietal theta band activity in the PS-condition (Fig. 7a, d) reflects the changing of the percept, in the SI-condition change of stimulus will also accompany parietal theta band activity. As shown in Fig. 8, this was indeed the case. Change of stimulus in the SI-condition evoked a transient period of theta band activity. We may conclude that the parietal theta activity is a signature of perceptual configuration change. Therefore, in the PS-condition, blinks 1,000 ms-prior to the response must have led to a change of the percept, and saccades 150 ms-prior to the response must have followed its initiation.
Fig. 8.
SI-condition: changes of the stimulus evoked theta and delta band responses in the parietal area. The EEG activity in the parietal area (Pz) was normalized by the mean amplitude at each frequency, aligned with change of presented stimulus, and averaged across trials and participants
Besides theta, the SI condition also revealed an evoked transient period of delta band activity in response to the change of the stimulus (Fig. 8). Since no similar activity occurred in the PS condition, the change-related activity is likely to reflect stimulus-driven components.
Discussion
We studied the properties of blinks and saccades in the time course of perceptual switching. The time-curves of blink and saccade probabilities in the PS-condition showed peaks when they were aligned with button press responses. This result indicates that blinks and saccades associated with perceptual switching occur in specific intervals, time-locked to the change of percept. A limited set of precisely timed blinks and saccades are predictive of the direction of perceptual switching. Blinks 1,000 ms prior to the response lead to switching to the preferred interpretation, and the direction of saccades 150 ms prior to the response is associated with the orientation of the percept after the switch. Our results indicate that we need to take timing of blinks and saccade into account in order to understand how spontaneous oculomotor behavior influences our percept.
As time-curves of blink probabilities in the PS-condition showed a peak 1,000 ms prior to button press responses (Fig. 2a), it is possible that transient changes in the visual input, resulting from blinks around the peak, initiate the perceptual switching process. Perturbations of the visual system caused by blinking might lead to switching in a manner analogous to ones that are caused externally, when the visual stimulus is perturbed. For instance, perturbation produced by illuminating the background in a brief flash facilitates perceptual switching in ambiguous figures (Kanai et al. 2005).
There are many blinks that are not associated with switching. Blink-suppression in the magnocellular pathway (Volkmann et al. 1980, 1982; Ridder and Tomlinson 1993, 1997) will normally protect the percept against perturbation. Accordingly, as opposed to blinks associated with switching (Fig. 7a), blinks not associated with switching did not evoke parietal activity (Fig. 7b).
A hint to interpret the role of blinking might be obtained from the relationship between blinks and the switching direction. Blinks around a peak 1,000 ms prior to button press responses were preferentially associated with switching to the preferred interpretation of the Necker cube (Fig. 2a). In the SI-condition, time-curves of blink probabilities showed a peak after the responses for both stimulus changes to preferred and to non-preferred orientation of the biased versions of the Necker cube (Fig. 2a). As the task in the SI-condition is to press a response button whenever the figure was changed, blinks after the responses may reflect detachment of attention from the stimulus. If this is also the case in the blinks 1,000 ms prior to the response in the PS-condition, the blinks might reorganize attentional resources by detaching attention from one part of the stimulus and attaching it to another, where observers prefer to allocate attention. As this reorganization process works as a shift of attention, the blinks would most likely be associated with switching to the preferred interpretation of the Necker cube. If this is the case, parietal theta band activity after the switching-related blinking (Fig. 7a) may reflect a process of changing the percept, initiated by a reallocation of attentional resources, while the stimulus remains unchanged.
Time-curves of saccadic probabilities in the PS-condition showed a peak 150 ms prior to the button press response (Fig. 4a, b). Furthermore, the direction of a saccade occurring around this peak was preferentially associated with a specific direction of perceptual switching (Fig. 4a, b). As a saccade is associated with a transient shift of attention, a saccade interacts with an ongoing switching process by changing the locus of attention. Furthermore, when a certain part within an object is selectively attended, the corresponding information is enhanced (Chelazzi et al. 2001). Therefore, when the process of changing a percept, as indicated by parietal theta band activity, has already started (Fig. 7d), a saccade facilitates this ongoing process by shifting attention to a suitable part within the figure, presumably one that is of diagnostic value to the new interpretation.
The systematic relationship between saccade direction and switching direction is consistent with the focal-feature hypothesis (Toppino 2003): different focal regions within an ambiguous figure are considered to favor perception of an ambiguous figure. Several studies support this hypothesis by showing that eye-fixation position biases the interpretation of ambiguous figures (Einhäuser et al. 2004; Ellis and Stark 1978; Hochberg and Peterson 1987; Kawabata 1986; Kawabata et al. 1978; Ruggieri and Fernandez 1994; Toppino 2003). Our results indicate that changing eye-fixation position by a saccade can transiently bias the interpretation of ambiguous figures. However, only a small set of saccades are effective in this way; and those saccades occuring within a short time interval prior to the button press response.
As only precisely timed blinks and saccades were associated with perceptual switching, small numbers of switching were characterized by such blinks (Table 4) and saccades (Table 5). The question, therefore, should arise: what initiates perceptual switching in the remaining cases? In our previous study (Nakatani and van Leeuwen 2006), we found four types of gamma band synchrony patterns in relation to perceptual switching. In all cases where gamma band synchrony was observed, this occurred between parietal and frontal areas. The gamma synchrony was observed in about 60% of the perceptual switching responses. These results indicate that there are several distinct mechanisms underlying perceptual switching. Another candidate mechanism is pupil dilation. Einhäuser et al. (2008) reported a relationship between pupil dilation and perceptual switching. They found that pupil dilation effect was independent of blinks and saccades. To understand the entire picture of the dynamics underlying perceptual switching, a multi-causal framework is necessary. Perceptual switching is a transition of the cognitive system reflected in the dynamics of brain states. Thus, neurodynamical framework would offer a good starting point for integrating the various processes involved in perceptual switching (Werner 2009).
The interpretation that parietal theta activity reflects change of the percept is consistent with the SI-condition. Here, change of the stimulus evoked this activity (Fig. 8). This is unlike in the PS-condition, where no stimulus change occurred. The most parsimonious explanation for both conditions combined is that the theta activity reflects both spontaneous and stimulus-induced changes of the perceptual interpretation. In addition, a dissociation between stimulus driven and spontaneous changes in percept was observed: the SI-condition was characterized by evoked delta activity in addition to the theta activity in response to stimulus change; no corresponding delta activity was observed in the PS-condition.
In conclusion, our results point out the roles of blinks and saccades in perceptual switching in precisely-timed intervals. In these cases, blinks and saccade occur in combination with transient parietal theta activity, which marks the change in interpretation. This activity follows the relevant blinks. Perturbation caused by these blinks results in the system having to newly construct an interpretation. Consequently, blinks are associated with switching to the preferred interpretation of the Necker cube. The relevant saccades follow parietal theta activity, indicating that the switching process has already started. The saccades facilitate the ongoing switching process by shifting attention; consequently the saccade directions preferably correspond to the direction of the percept afterwards. These results underline the important role of transient, dynamic oculomotor events in perceptual organization.
Acknowledgments
We would like to acknowledge Peter Jurica, RIKEN Brain Science Institute, for technical support on eye-movement measurement. We thank Kameliya Dimova for running an eye-movement only pilot version of our current experiment.
Open Access
This article is distributed under the terms of the Creative Commons Attribution Noncommercial License which permits any noncommercial use, distribution, and reproduction in any medium, provided the original author(s) and source are credited.
References
- Attneave F. Multistability in perception. Sci Am. 1971;225:63–71. doi: 10.1038/scientificamerican1271-62. [DOI] [PubMed] [Google Scholar]
- Chelazzi L, Miller EK, Duncan J, Desimone R. Responses of neurons in macaque area V4 during memory-guided visual search. Cereb Cortex. 2001;11:761–772. doi: 10.1093/cercor/11.8.761. [DOI] [PubMed] [Google Scholar]
- Efron B. Bootstrap methods: another look at the jackknife. Ann Stat. 1979;7:1–26. doi: 10.1214/aos/1176344552. [DOI] [Google Scholar]
- Efron B, Tibshirani R. Bootstrap methods for standard errors, confidence intervals, and other measures of statistical accuracy. Stat Sci. 1986;1:54–77. doi: 10.1214/ss/1177013815. [DOI] [Google Scholar]
- Einhäuser W, Martin KAC, König P. Are switches in perception of the Necker cube related to eye position? Eur J Neurosci. 2004;20:2811–2818. doi: 10.1111/j.1460-9568.2004.03722.x. [DOI] [PubMed] [Google Scholar]
- Einhäuser W, Stout J, Koch C, Carter O. Pupil dilation reflects perceptual selection and predicts subsequent stability in perceptual rivalry. Proc Natl Acad Sci USA. 2008;105:1704–1709. doi: 10.1073/pnas.0707727105. [DOI] [PMC free article] [PubMed] [Google Scholar]
- Ellis SR, Stark L. Eye movements during the viewing of Necker cubes. Perception. 1978;7:575–581. doi: 10.1068/p070575. [DOI] [PubMed] [Google Scholar]
- Hochberg J, Peterson MA. Piecemeal organization and cognitive components in object perception: perceptually coupled responses to moving objects. J Exp Psychol Gen. 1987;116:370–380. doi: 10.1037/0096-3445.116.4.370. [DOI] [PubMed] [Google Scholar]
- Hyvärinen A, Oja E. A fast fixed-point algorithm for independent component analysis. Neural Comput. 1997;9:1482–1492. doi: 10.1162/neco.1997.9.7.1483. [DOI] [Google Scholar]
- Hyvärinen A, Oja E. Independent component analysis: algorithms and applications. Neural Networks. 2000;13:411–430. doi: 10.1016/S0893-6080(00)00026-5. [DOI] [PubMed] [Google Scholar]
- İşoğlu-Alkaç Ü, Başar-Eroğlu C, Ademoğlu A, Demiralp T, Miener M, Stadler M. Analysis of the electroencephalographic activity during the Necker cube reversals by means of the wavelet transform. Biol Cybern. 1998;79:437–442. doi: 10.1007/s004220050492. [DOI] [PubMed] [Google Scholar]
- İşoğlu-Alkaç Ü, Başar-Eroglu C, Ademoglu A, Demiralp T, Miener M, Stadler M. Alpha activity decreases during the perception of Necker cube reversals: an application of wavelet transform. Biol Cybern. 2000;82:313–320. doi: 10.1007/s004220050585. [DOI] [PubMed] [Google Scholar]
- Ito J, Nikolaev AR, Luman M, Aukes MF, Nakatani C, van Leeuwen C. Perceptual switching, eye movements, and the bus paradox. Perception. 2003;32:681–698. doi: 10.1068/p5052. [DOI] [PubMed] [Google Scholar]
- Kanai R, Moradi F, Shimoji S, Verstraten FA. Perceptual alternation induced by visual transients. Perception. 2005;34:803–822. doi: 10.1068/p5245. [DOI] [PubMed] [Google Scholar]
- Kawabata N. Attention and depth perception. Perception. 1986;15:563–572. doi: 10.1068/p150563. [DOI] [PubMed] [Google Scholar]
- Kawabata N, Yamagami K, Noaki M. Visual fixation points and depth perception. Vis Res. 1978;18:853–854. doi: 10.1016/0042-6989(78)90127-X. [DOI] [PubMed] [Google Scholar]
- Murata T, Matsui N, Miyauchi S, Kakita Y, Yanagida T. Discrete stochastic process underlying perceptual rivalry. Neuroreport. 2003;14:1347–1352. doi: 10.1097/01.wnr.0000077553.91466.41. [DOI] [PubMed] [Google Scholar]
- Nakatani H, van Leeuwen C. Individual differences in perceptual switching rates; the role of occipital alpha and frontal theta band activity. Biol Cybern. 2005;93:343–354. doi: 10.1007/s00422-005-0011-2. [DOI] [PubMed] [Google Scholar]
- Nakatani H, van Leeuwen C. Transient synchrony of distant brain areas and perceptual switching in ambiguous figures. Biol Cybern. 2006;94:445–457. doi: 10.1007/s00422-006-0057-9. [DOI] [PubMed] [Google Scholar]
- Peterson MA, Gibson BS. Directing spatial attention within an object: altering the functional equivalence of shape descriptions. J Exp Psychol Hum Percept Perform. 1991;17:170–182. doi: 10.1037/0096-1523.17.1.170. [DOI] [PubMed] [Google Scholar]
- Ridder WH, 3rd, Tomlinson A. Suppression of contrast sensitively during eyelid blinks. Vis Res. 1993;33:1795–1802. doi: 10.1016/0042-6989(93)90170-2. [DOI] [PubMed] [Google Scholar]
- Ridder WH, 3rd, Tomlinson A. A comparison of saccadic and blink suppression in normal observers. Vis Res. 1997;37:1795–1802. doi: 10.1016/s0042-6989(97)00110-7. [DOI] [PubMed] [Google Scholar]
- Rock I, Hall S, Davis J. Why do ambiguous figures reserse? Acta Psychol. 1994;87:33–59. doi: 10.1016/0001-6918(94)90065-5. [DOI] [PubMed] [Google Scholar]
- Ruggieri V, Fernandez MF. Gaze orientation in perception of reversible figures. Percept Mot Skills. 1994;78:299–303. doi: 10.2466/pms.1994.78.1.299. [DOI] [PubMed] [Google Scholar]
- Slotnick SD, Yantis S. Common neural substrates for the control and effects of visual attention and perceptual bistability. Cogn Brain Res. 2005;24:97–108. doi: 10.1016/j.cogbrainres.2004.12.008. [DOI] [PubMed] [Google Scholar]
- Stern JA, Walrath LC, Goldstein R. The endogenous eyeblink. Psychophysiology. 1993;21:22–23. doi: 10.1111/j.1469-8986.1984.tb02312.x. [DOI] [PubMed] [Google Scholar]
- Toppino TC. Reversible-figure perception: mechanisms of intentional control. Percept Psychophys. 2003;65:1285–1295. doi: 10.3758/BF03194852. [DOI] [PubMed] [Google Scholar]
- van Dam LCJ, van Ee R. The role of saccades in exerting voluntary control in perceptual and binocular rivalry. Vis Res. 2006;46:787–799. doi: 10.1016/j.visres.2005.10.011. [DOI] [PubMed] [Google Scholar]
- Veltman JA, Gaillard AW. Physiological workload reactions to increasing levels of task difficulty. Ergonomics. 1998;41:656–669. doi: 10.1080/001401398186829. [DOI] [PubMed] [Google Scholar]
- Volkmann FC, Riggs LA, Moore RK. Eyeblinks and visual suppression. Science. 1980;207:900–902. doi: 10.1126/science.7355270. [DOI] [PubMed] [Google Scholar]
- Volkmann FC, Riggs LA, Ellicott AG, Moore RK. Measurements of visual suppression during opening, closing and blinking of the eyes. Vis Res. 1982;22:991–996. doi: 10.1016/0042-6989(82)90035-9. [DOI] [PubMed] [Google Scholar]
- Werner G. Consciousness related neural events viewed as brain state space transitions. Cogn Neurodyn. 2009;3:83–95. doi: 10.1007/s11571-008-9040-6. [DOI] [PMC free article] [PubMed] [Google Scholar]
- Zangemeister WH, Sherman K, Stark L. Evidence for a global scanpath strategy in viewing abstract compared with realistic images. Neuropsychologia. 1995;33:1009–1025. doi: 10.1016/0028-3932(95)00014-T. [DOI] [PubMed] [Google Scholar]


